Search
Co-pilot is your personal data analysis assistant, designed to help you get instant insights without manual exploration. Instead of spending time navigating through dashboards and reports, you can now simply ask a question and get real-time answers.
Whether you need to analyze key CX metrics, generate charts, summarize dashboards, analyze open-ended feedback, compare data for deeper analysis, Co-pilot instantly delivers the insights you need. It also provides recommendations, helping you spot trends and make smarter decisions effortlessly.
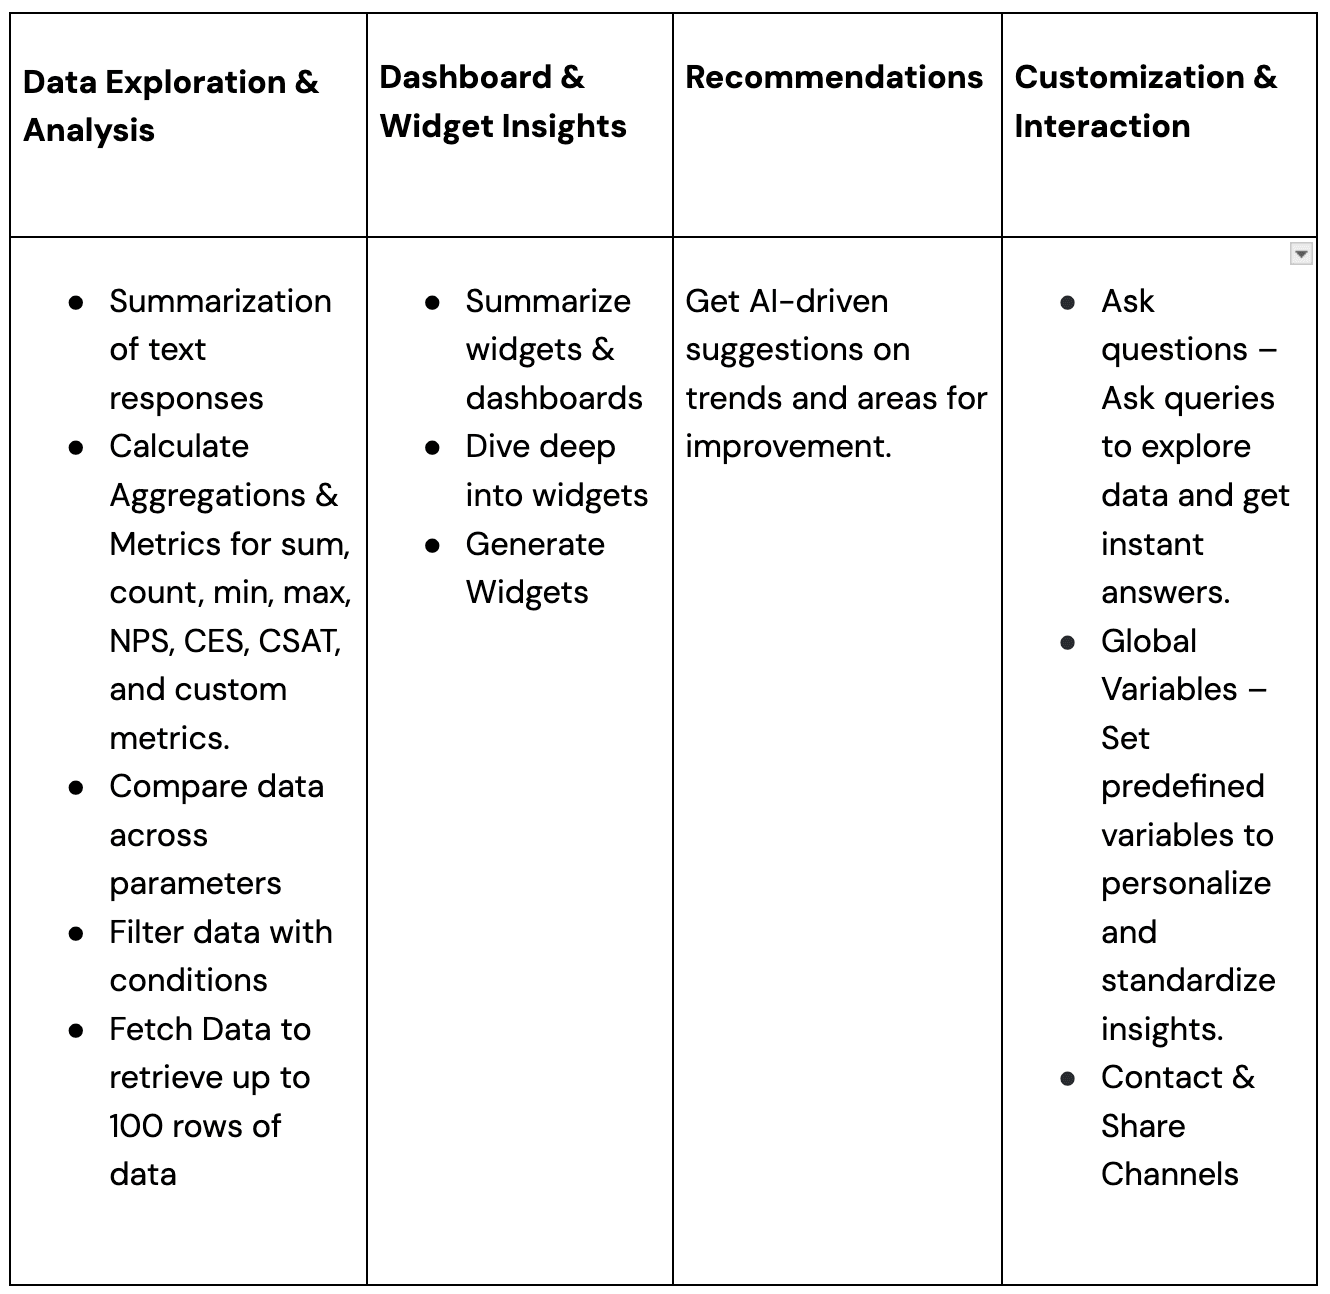
List of capabilities of Co-pilot
The following are the different capabilities of the Co-pilot feature. For better clarity and understanding, we have categorized them into four groups.
Let’s look at a quick use case to understand how Co-pilot helps.
For years, Coffee Cafe had been a go-to spot for coffee lovers. But something was changing—foot traffic was declining across outlets, and NPS had dropped in just three months.
Fewer people were visiting stores, and even loyal customers weren’t recommending it as much. The leadership team needed to understand why—and fast.
Instead of spending weeks manually sifting through data, the CX team turned to Co-pilot to uncover the issue in minutes.
Co-pilot is the best option in this use case as it helps to quickly analyse feedback.
We will deep dive into 3 main use cases to understand Co-pilot.
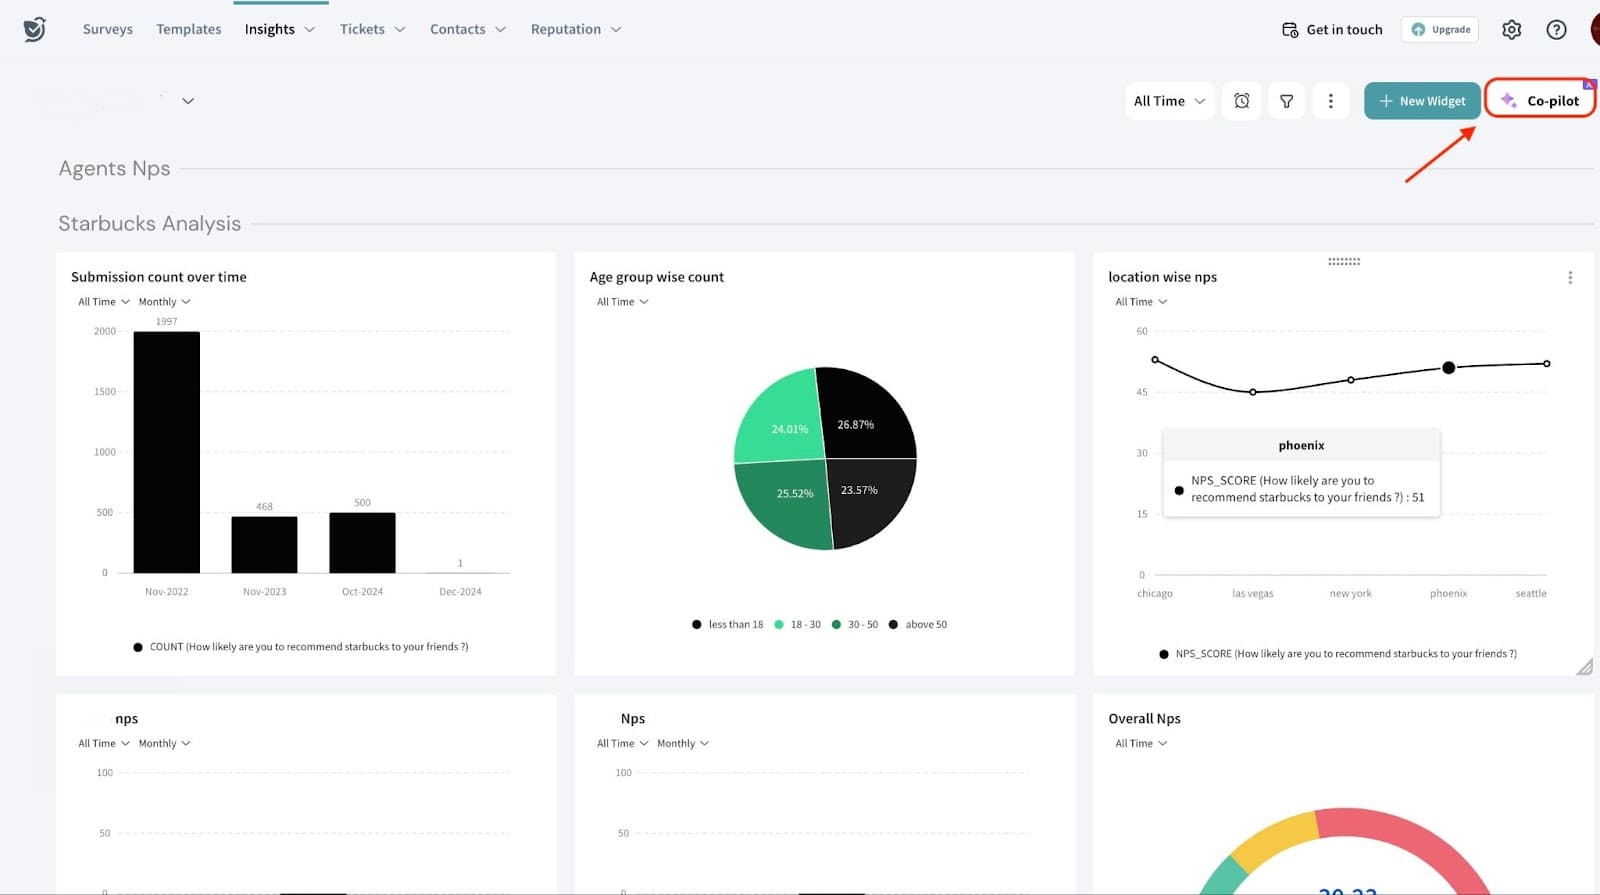
Co-pilot in Executive Dashboard
Using the above example let’s now see how to use Co-pilot for Executive Dashboard
The Executive Dashboard allows you to collate, compare, and correlate data from multiple survey sources in one centralized view. By bringing all key metrics together, it enables businesses to identify trends, uncover patterns, and make data-driven decisions. With an intuitive interface, it ensures a holistic understanding of customer feedback.
In Executive Dashboard, Co-pilot helps synthesize data across surveys, highlighting key trends and patterns to support strategic decision-making. It provides quick, actionable insights from a unified customer feedback view.
Let’s see how.
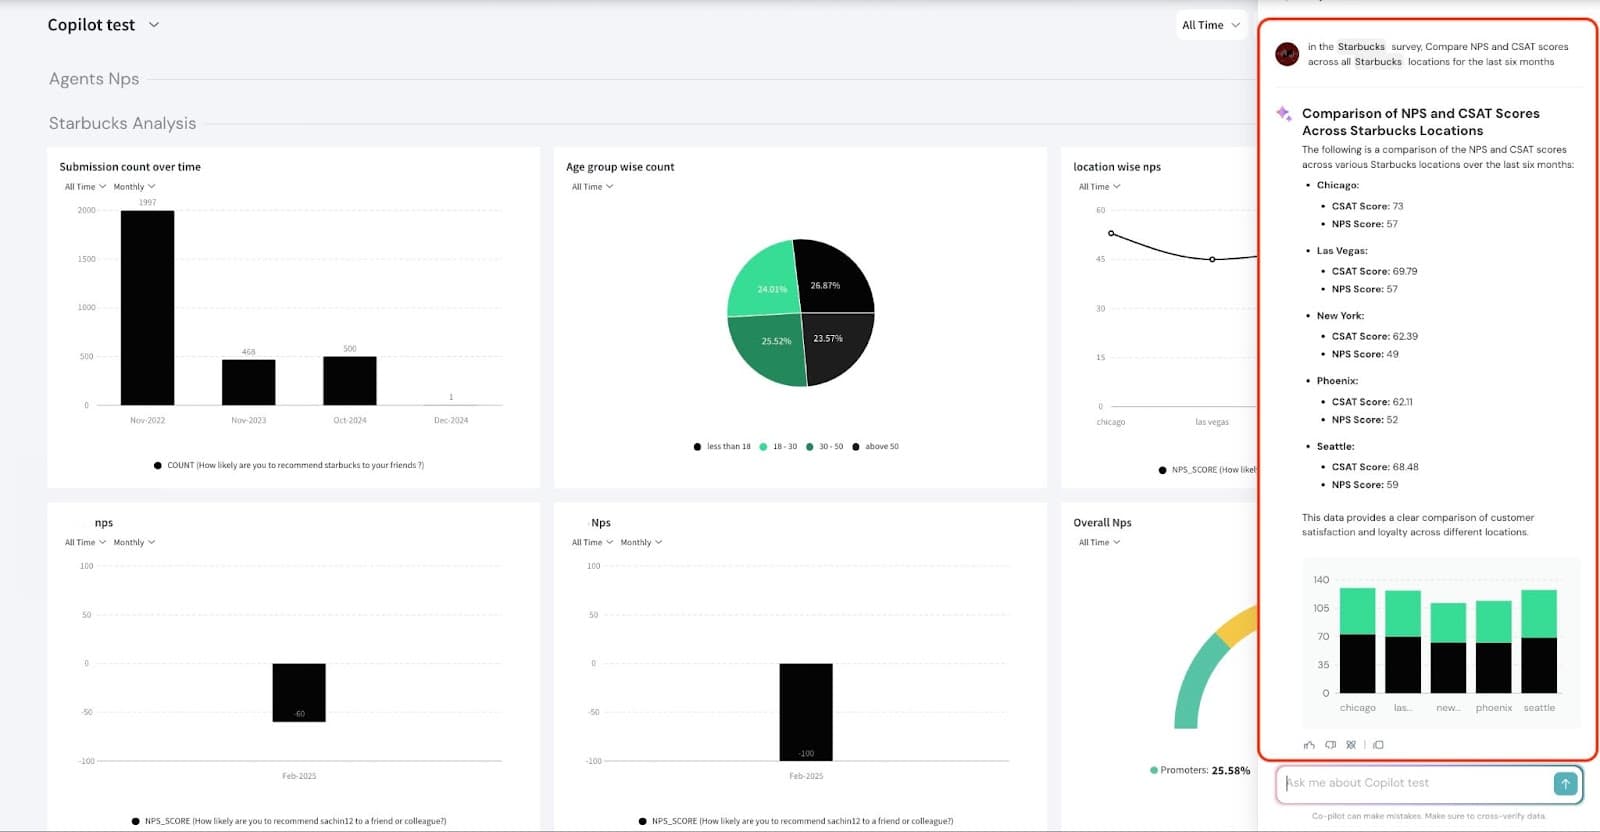
Sample prompts:
These are sample prompts that can be entered
Summarizing the capabilities of Co-pilot in Executive Dashboard
Note: For analyzing existing charts, the following chart types are supported for chart creation:
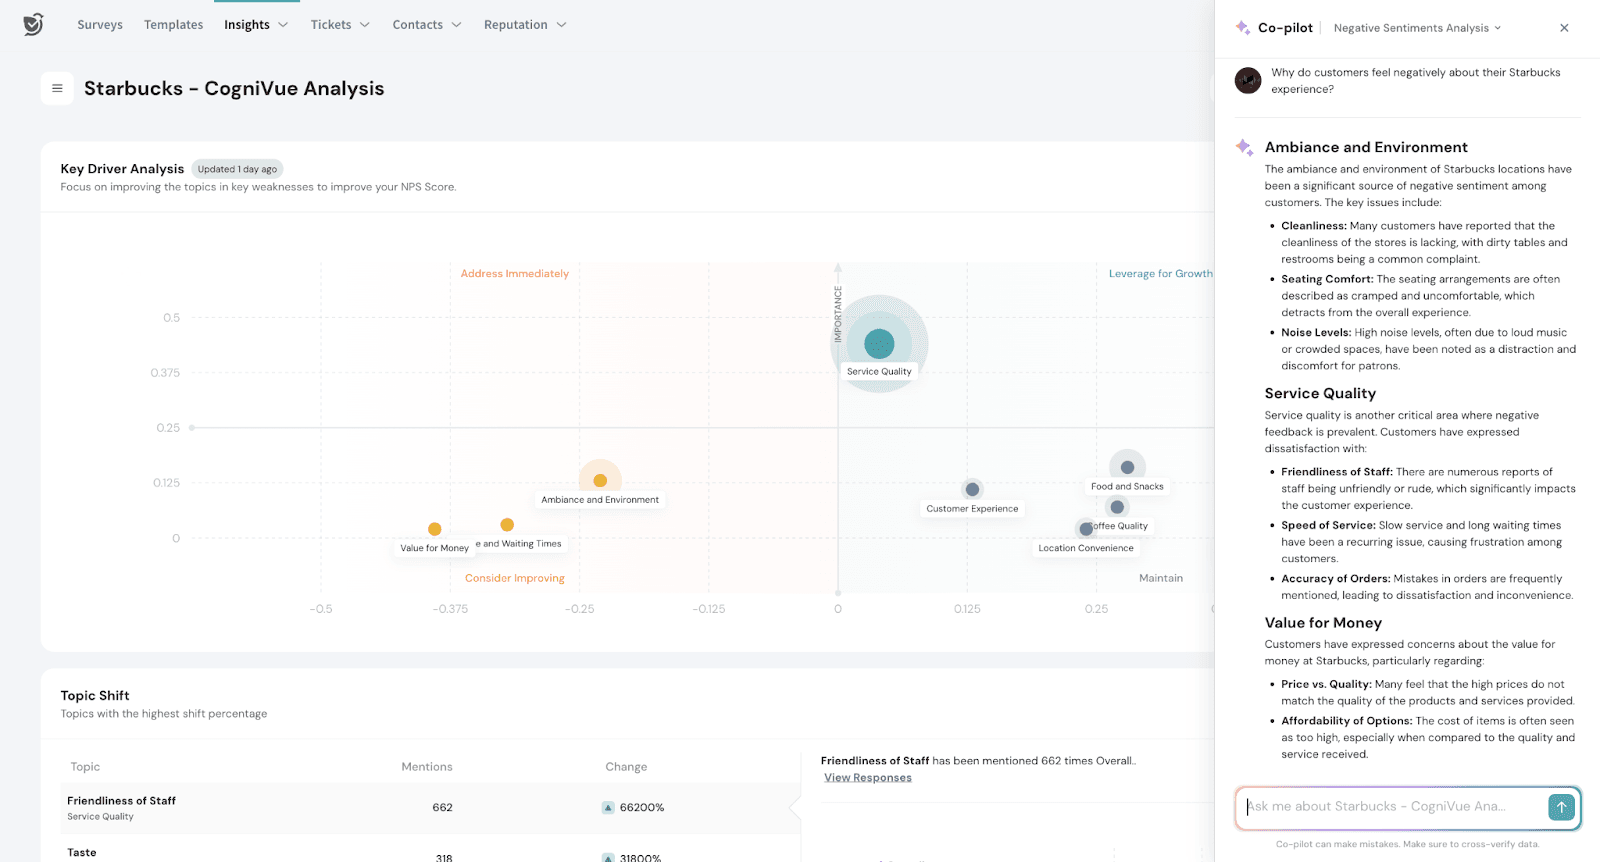
Co-pilot in CogniVue
CogniVue processes unstructured text feedback to uncover key themes, key drivers of sentiment, and areas needing attention. It helps businesses
gain actionable insights, enabling faster and more informed decisions to enhance customer experience.
In this example we can use Co-pilot to extract actionable insights from large volumes of open-ended customer feedback efficiently
3. Navigate to Insights and go to CogniVue.
Using Key Driver Analysis, you can enter prompts to explore specific topics in depth.
Sample prompts:
These are sample prompts that can be entered
Summarizing capabilities of Co-pilot in CogniVue
Co-pilot in Survey Results Analysis
Survey Responses is the final step in the survey process, and is part of the Results section. It provides an overview of the analysis, reports, and individual responses and helps understand customer feedback in detail.
In our example, we can use Co-pilot to deep dive and further understand the demographics, sentiments, location-wise trends, and individual responses.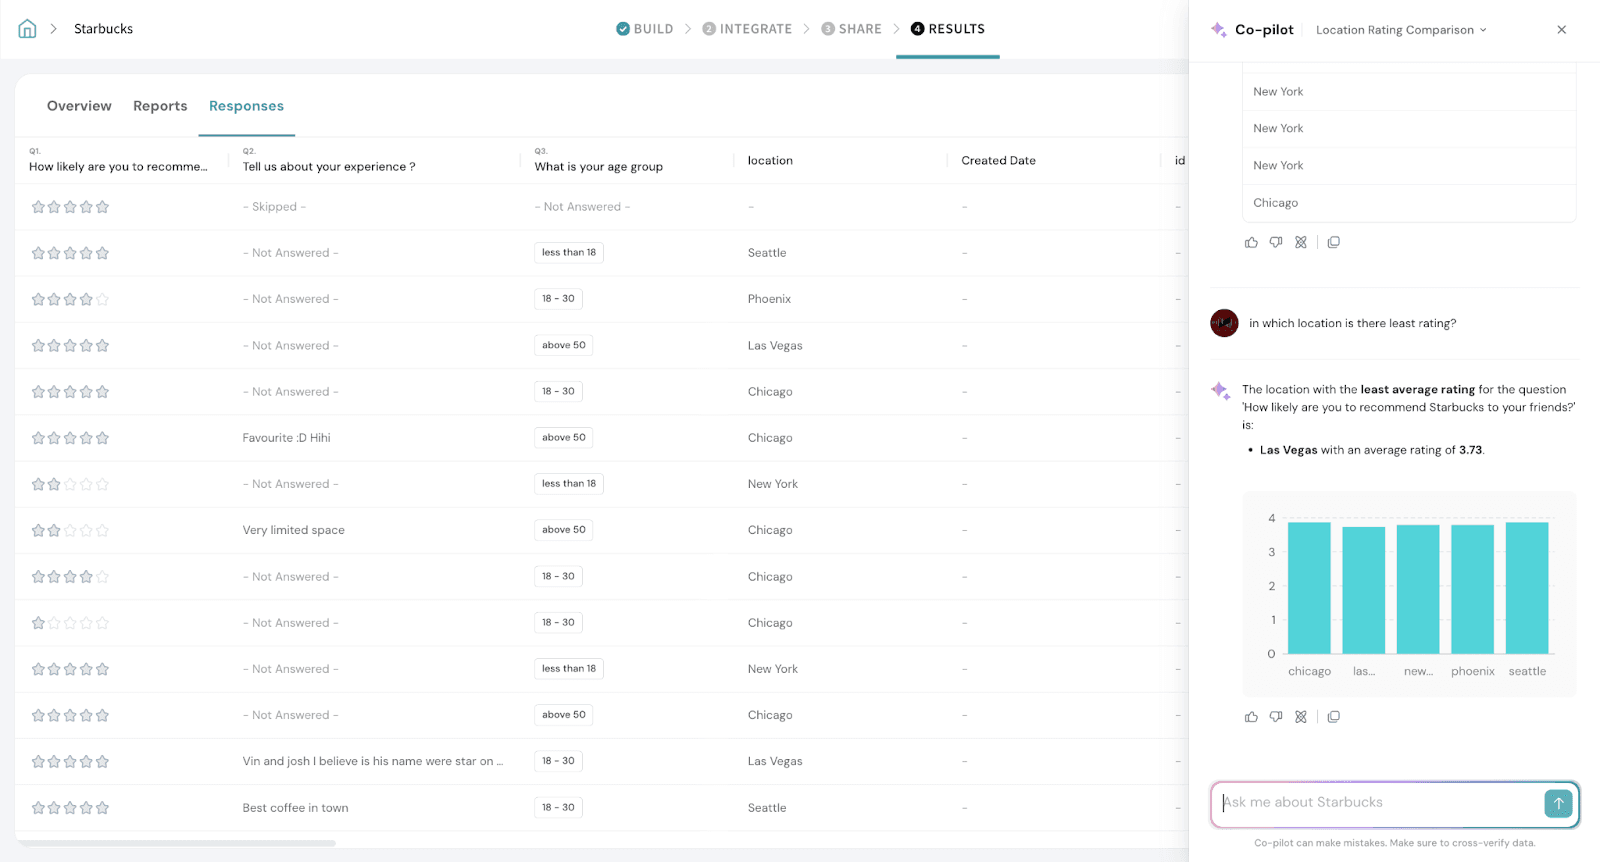
Sample Prompts
These are sample prompts that can be entered
Capabilities of Co-pilot in Survey responses
Tips and Best Practices

1.1 Click the arrow icon to maximize the chart view.
1.2 Click the three-dot menu to download the chart as an image or export it to the dashboard.
2. You can also view the approach used by clicking on the ‘Understand approach’ icon. This will display the parameters, the question used for plotting the chart, and the selected time period.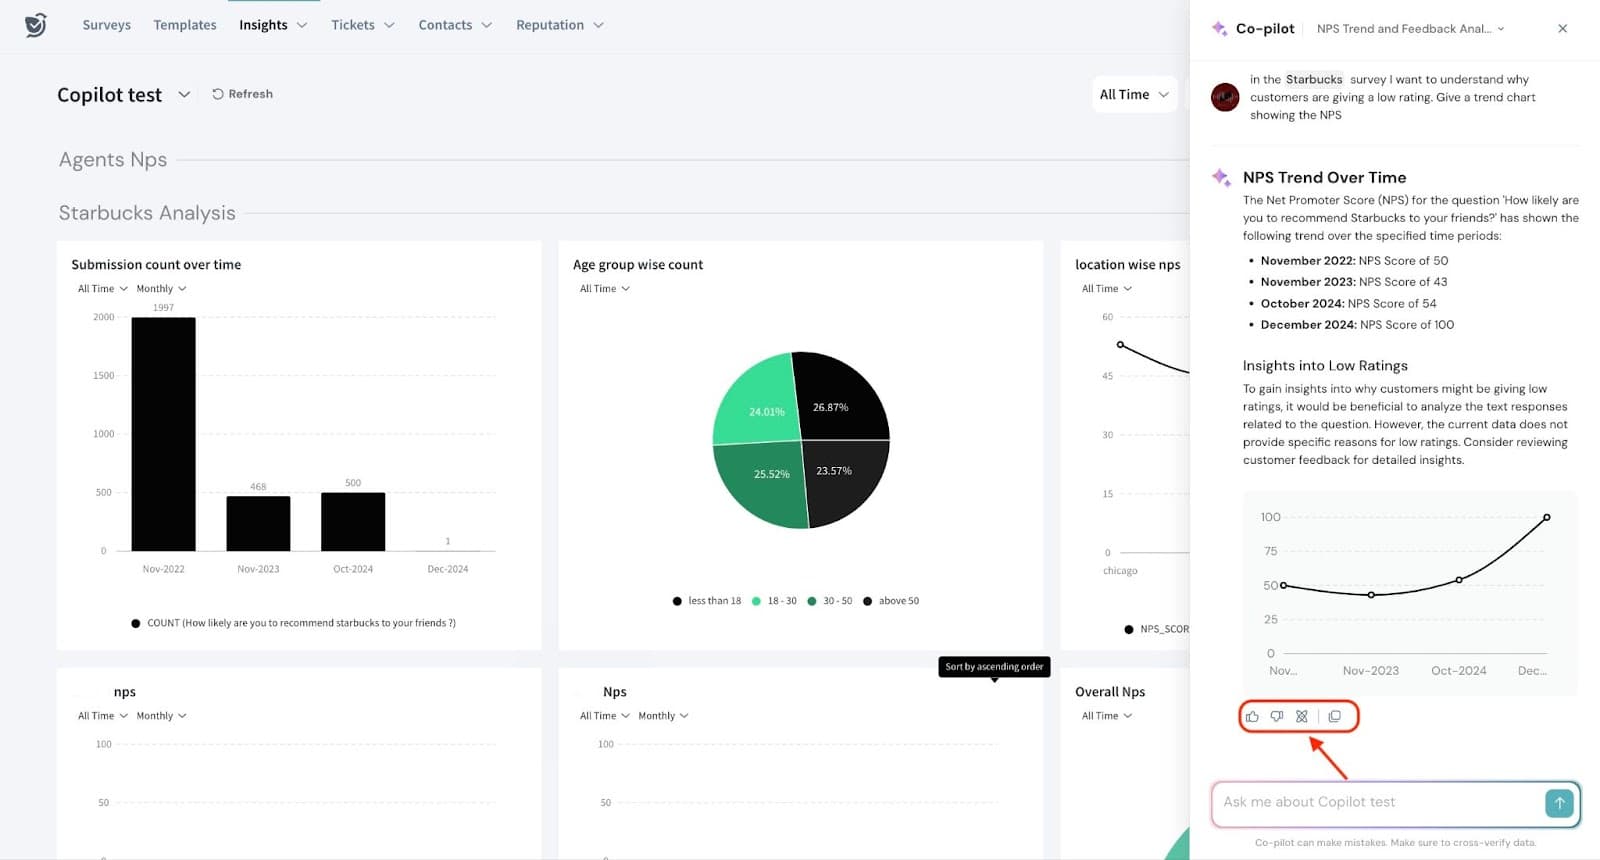
3. Use '@' to select a specific survey or widget to refine your query when using the Executive Dashboard.
Limitation
Please note that Co-pilot currently does not support predictive analysis.
Related resources
Powered By SparrowDesk