
Analyzing responses at question-level
Gather valuable insights from the responses of your survey
The main purpose of conducting a survey is to gain important and useful data. SurveySparrow has a rich question-level report page which helps you gain in-depth analysis about the survey responses.
The Results section is dedicated to helping you provide a detailed review about the Survey performance.
To analyse the responses of each question, follow the below mentioned steps:
1. Go to the survey from SurveySparrow’s Home page. Click on the Results tab and then choose Reports. A detailed view of inferences of the responses is shown.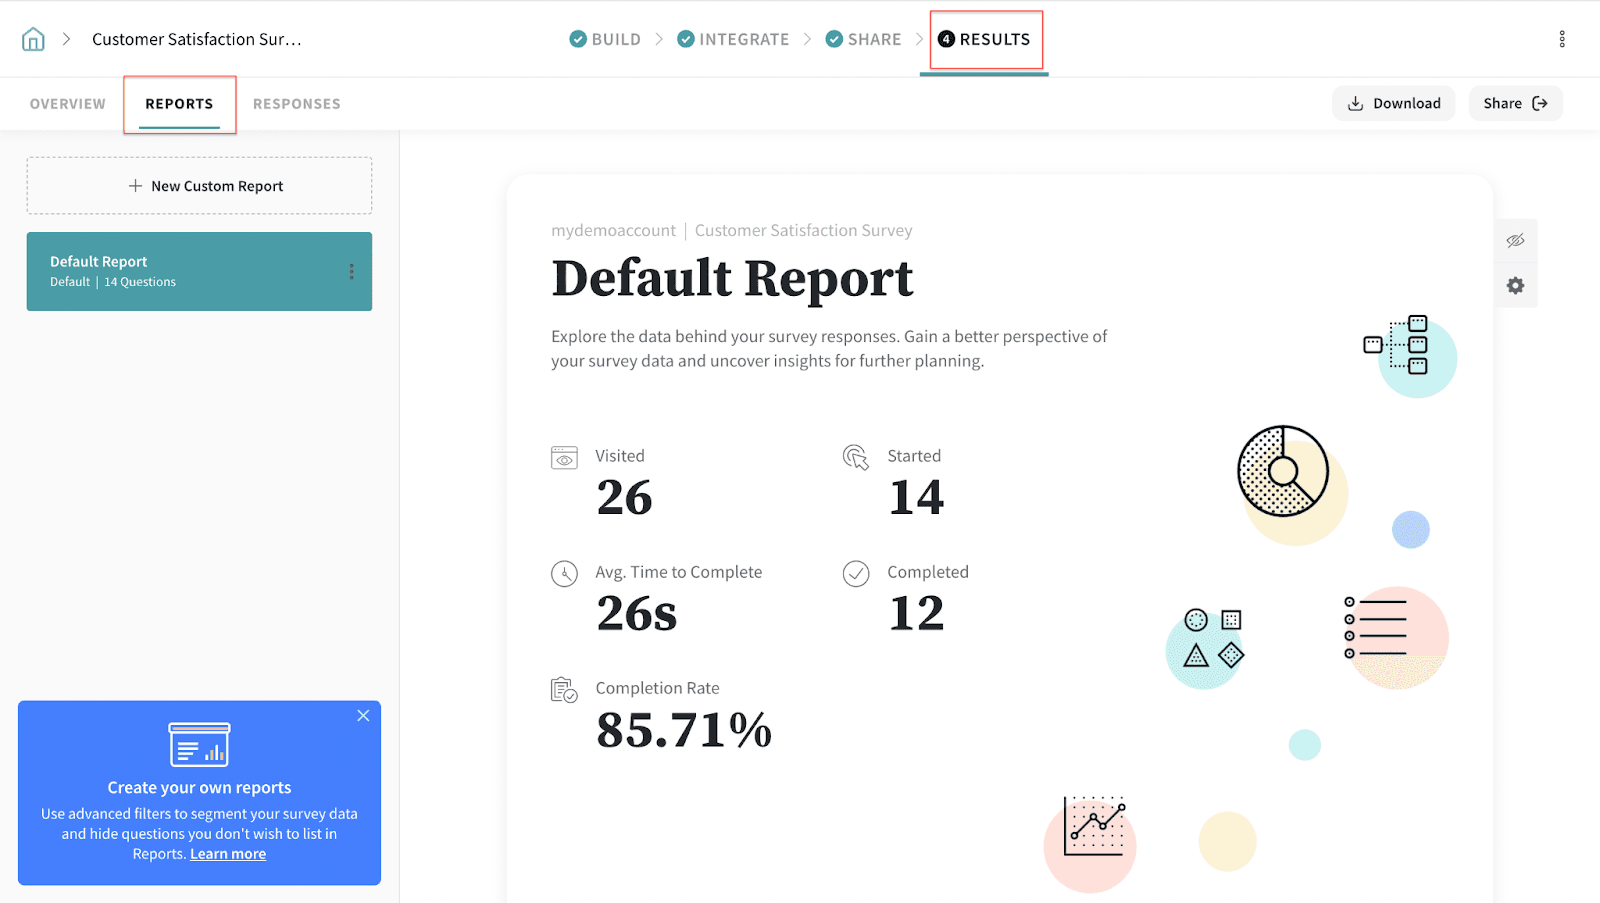
2. By clicking on the highlighted option, you can change the chart type of the individual question. Pie chart, Vertical Bar chart, Horizontal Bar chart and Line chart types are available.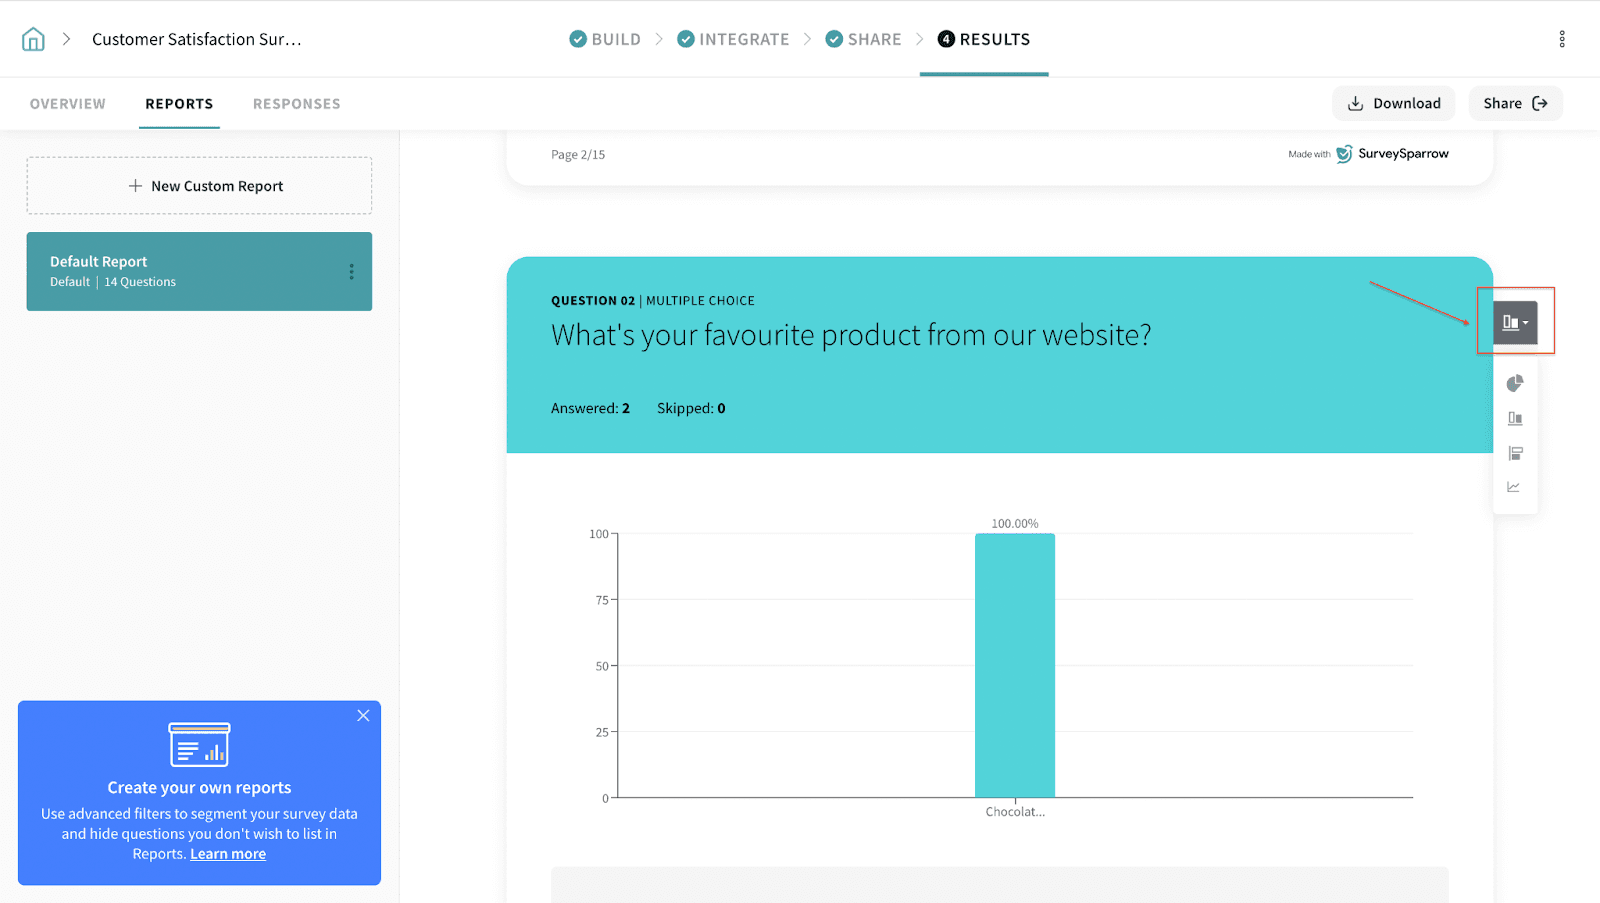
3. You can go to the question-level setting by clicking on the highlighted option: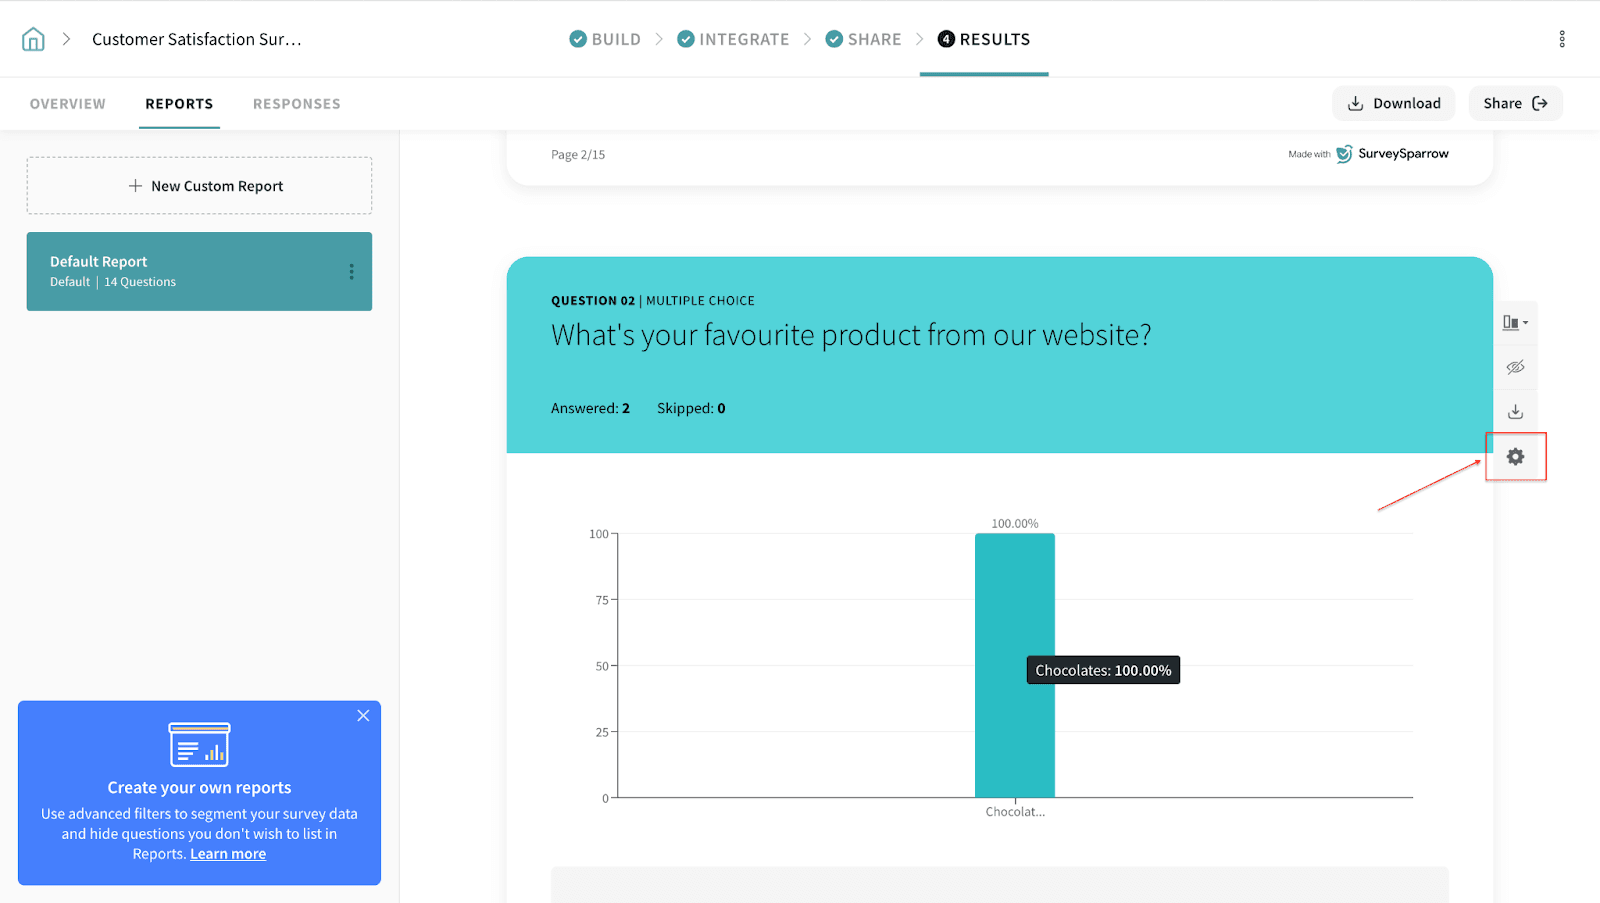
4. Once you click on the Settings, the following screen appears. You can edit the question label, description, chart type and what to display from this page: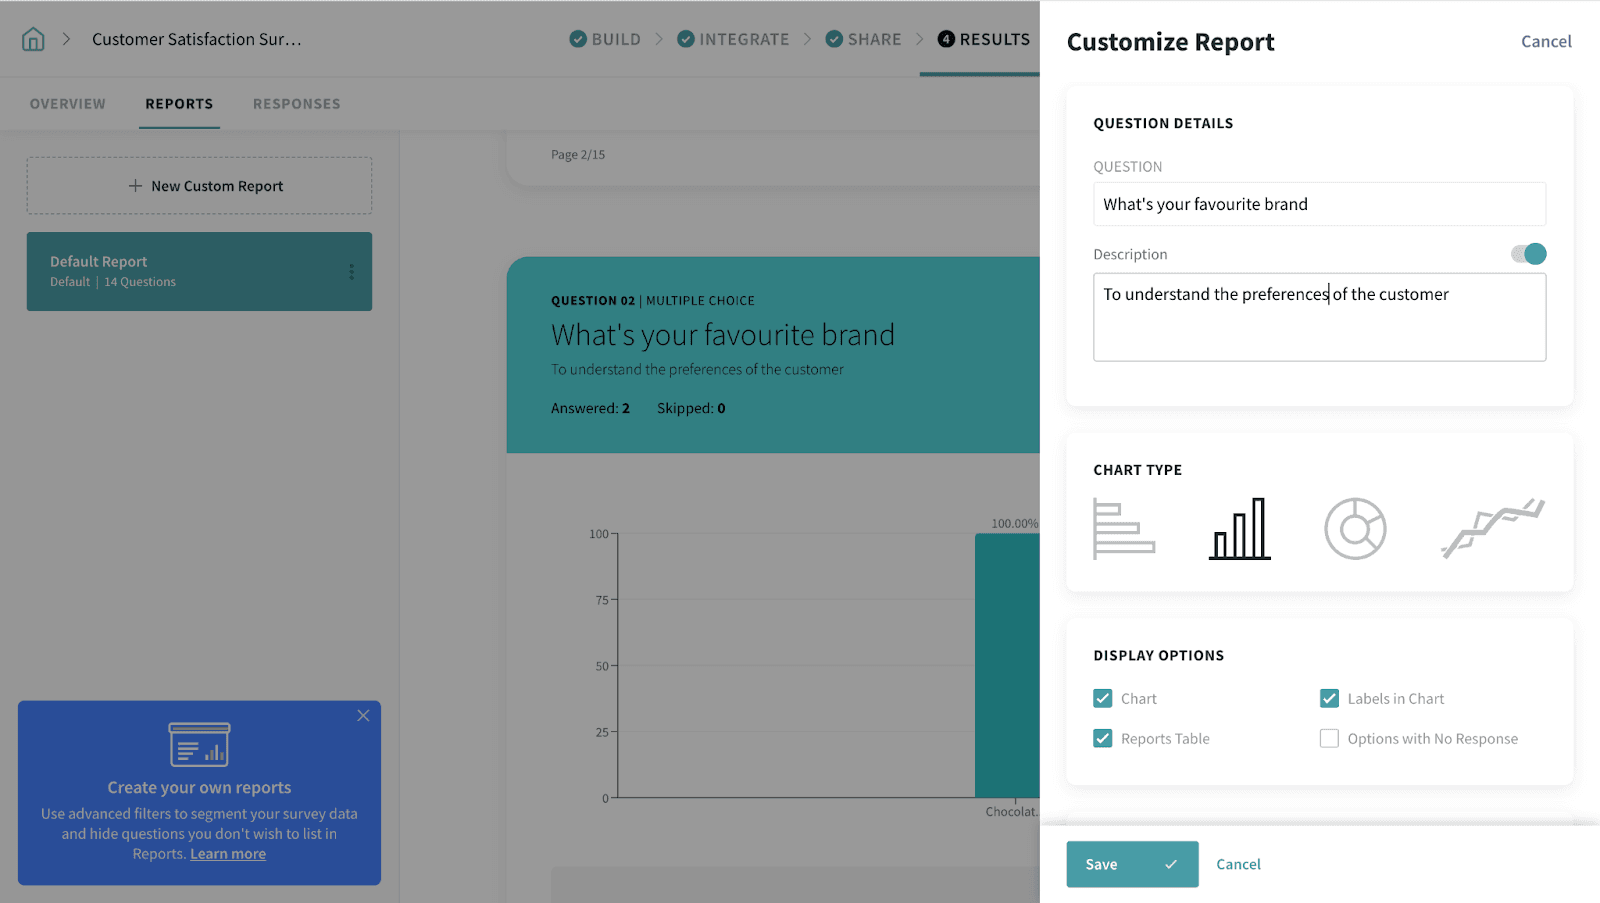
5. You can also change the bar colour of each of the options from here: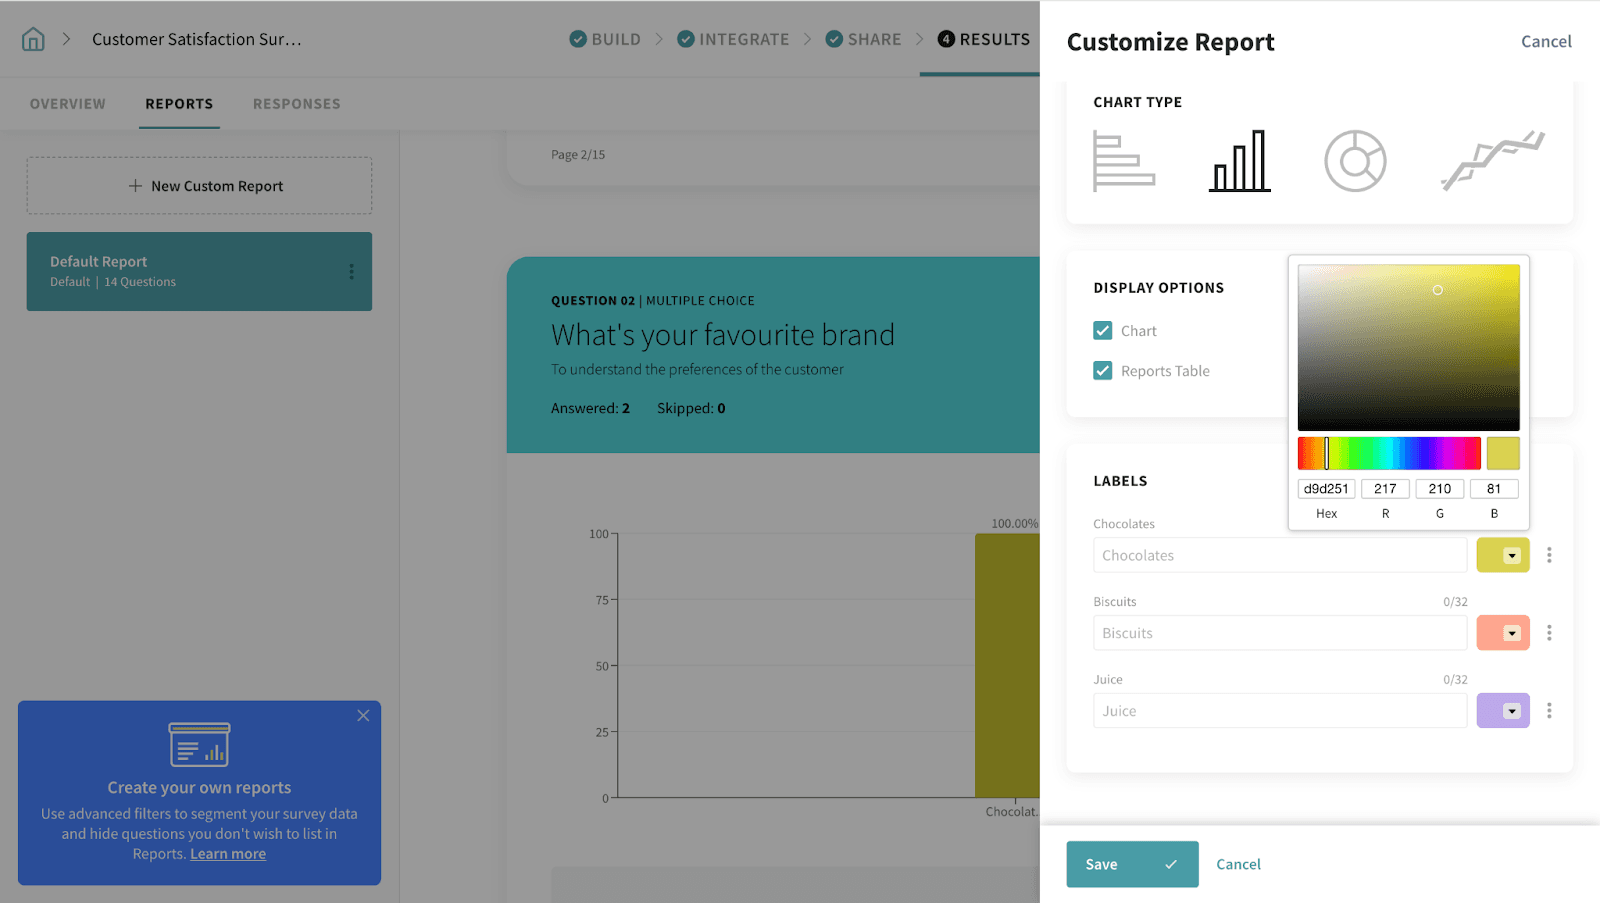
With this, we come to the end of the article. However, it is possible to do more with the reports, you can refer to the following articles to know more about reports