
CogniVue - Advanced Text Analytics
CogniVue is your intelligent data analyst that transforms your unstructured text feedback into actionable insights, thus helping in making faster and more accurate decisions to craft exceptional CX. By meticulously extracting pertinent topics from customer discourse within your industry, it pinpoints the key drivers behind customer sentiment and the areas requiring attention to maximize impact on your CX metrics.
This is an ideal tool for VOC Analysts. You're bombarded with customer feedback – reviews on various platforms and survey feedback daily. However, sorting through this mountain of data is a time-consuming process. It takes forever to:
- Gather feedback: Find relevant information scattered across platforms.
- Clean the data: Fix typos and inconsistencies in messy text.
- Analyze everything: Run complex programs to extract insights.
By the time you finally uncover valuable insights, new trends might have already emerged. Imagine if this tedious process could be accurately and automatically done in a matter of days.
CogniVue is here to help. With this, you can set up a smooth-running system to analyze all text feedback your brand receives and easily arrive at valuable insights that can be effectively communicated to the top management.
In this article, let’s explore in detail how CogniVue can make data analysis a breeze. This will walk you through the various widgets of a CogniVue. To learn more about the setup process, click here.
Basics of a CogniVue
Topics
When creating a CogniVue, you must set up topics. A "topic" refers to a specific theme or subject that emerges from your customer feedback data. It's like a category that groups similar customer comments.
You can setup sub-topics under a topic when creating your CogniVues. You can add up to 15 topics and a maximum of 10 subtopics under each sub-topic. We will explore this in more detail in this article.
Sections
CogniVue has three main sections inside that give a nifty view of all your customer feedback data.
- Topic Analysis: This covers the topical sentiments across, tracks the change in sentiment over time, and breaks down which is pushing the needle up or down.
- Key Driver: This helps the user understand what topics need to be worked on to drastically improve the score of their CX metrics.
- Deep Dives: This does a detailed breakdown of customer sentiment across special segments with advanced heatmaps
Note: The sections available for you depend on the usecase you tailor when setting up a CogniVue. E.g: If you do not opt for Key Driver and do not set up a scale question, you will not get the section. Understand more here.
Before getting into what each section tells you, let us pick a usecase to understand the functioning of CogniVue better.
Let’s pick a fictitious brand MetroMart, which is a retail store with branches in major cities. The data is compiled from their NPS to understand the brand performance, and a CogniVue is setup for the same.
Now, let us see how its performance is tracked across the different sections and the insights gleaned.
Topic Analysis
This section covers the sentiment analyzed across topics with various widgets covering aspects of the same.
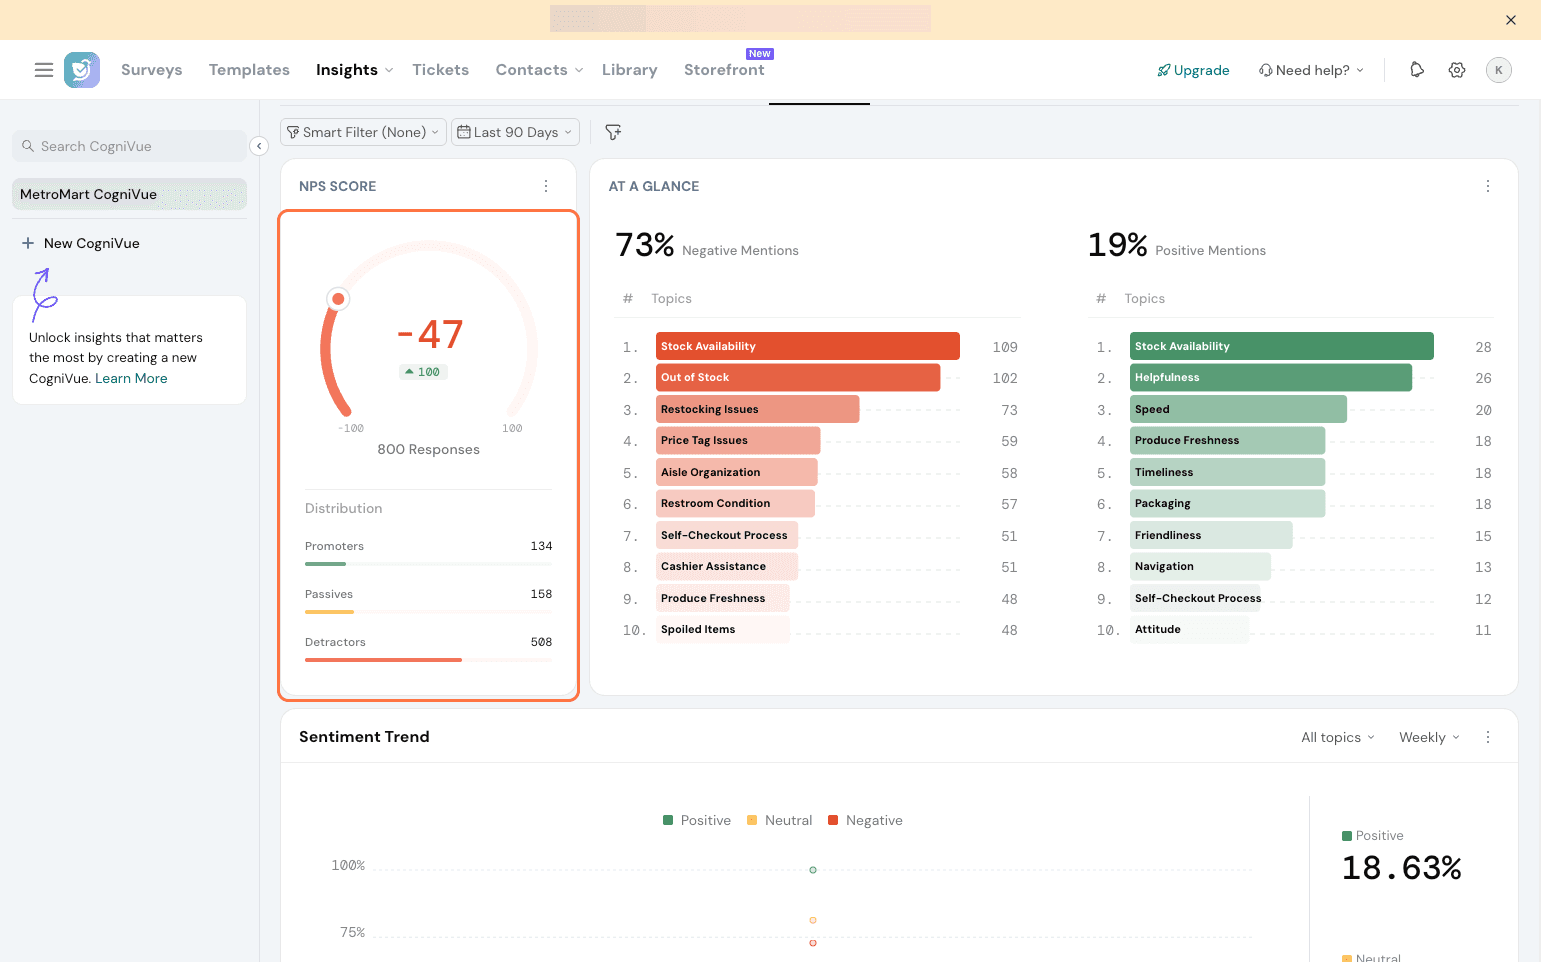
Metrics Widget:
This widget shows the absolute change of the selected metric, like NPS, CSAT, CES, or the review score, across time. The time period could be month-on-month or based on a custom range set up. This is visible only if a metric/review source was opted for during setup.
Here, the NPS of MetroMart is shown.
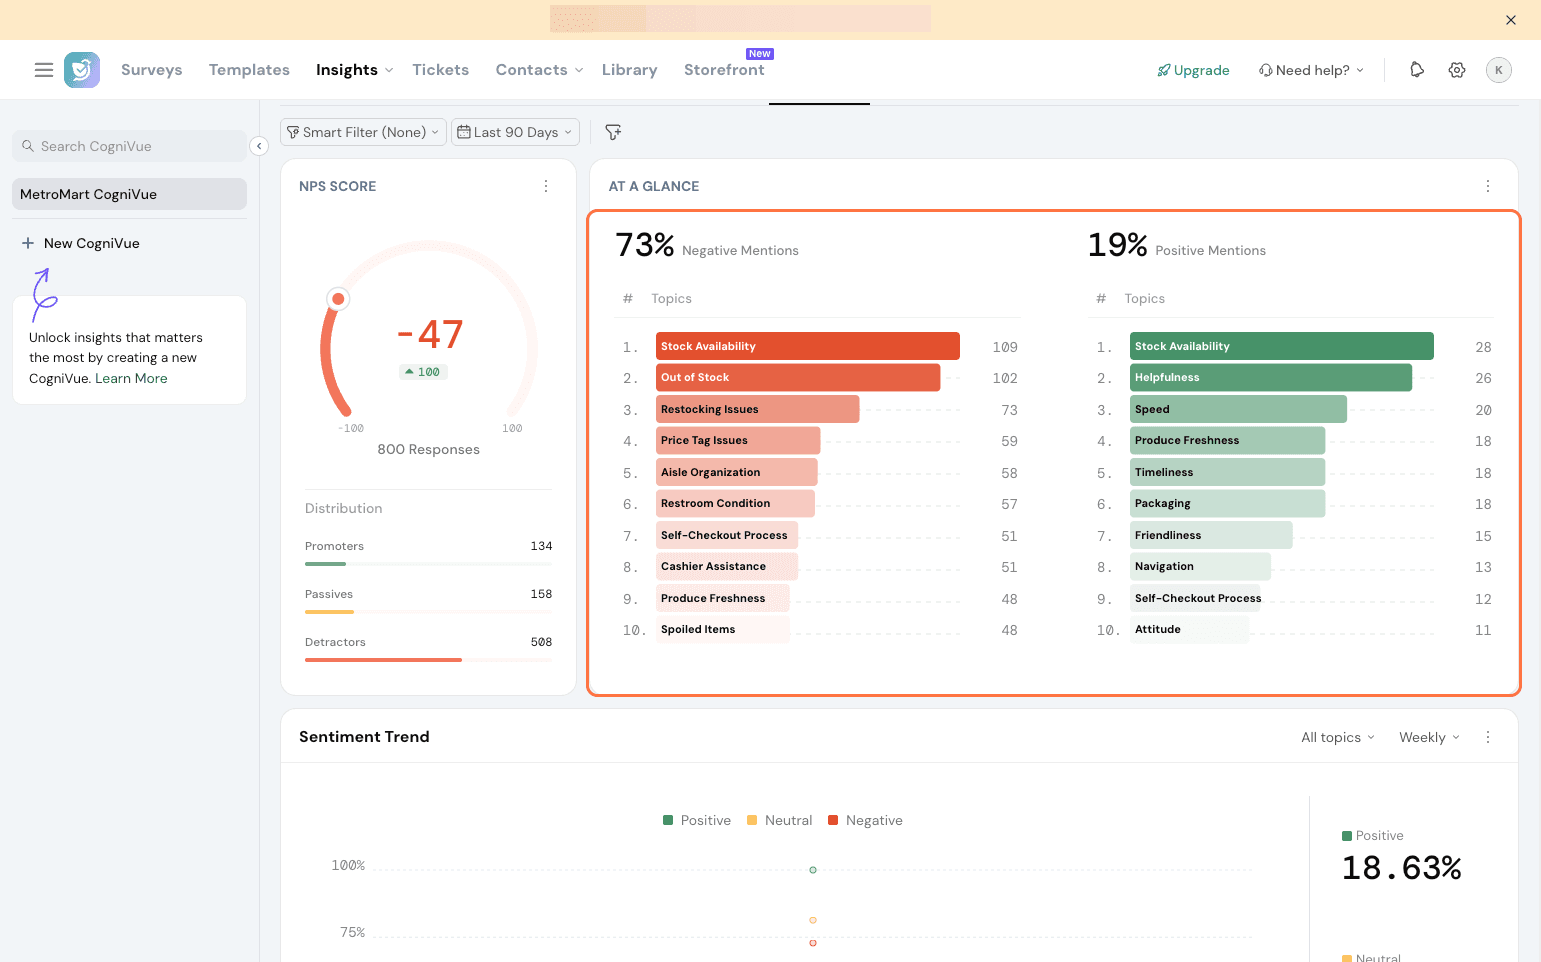
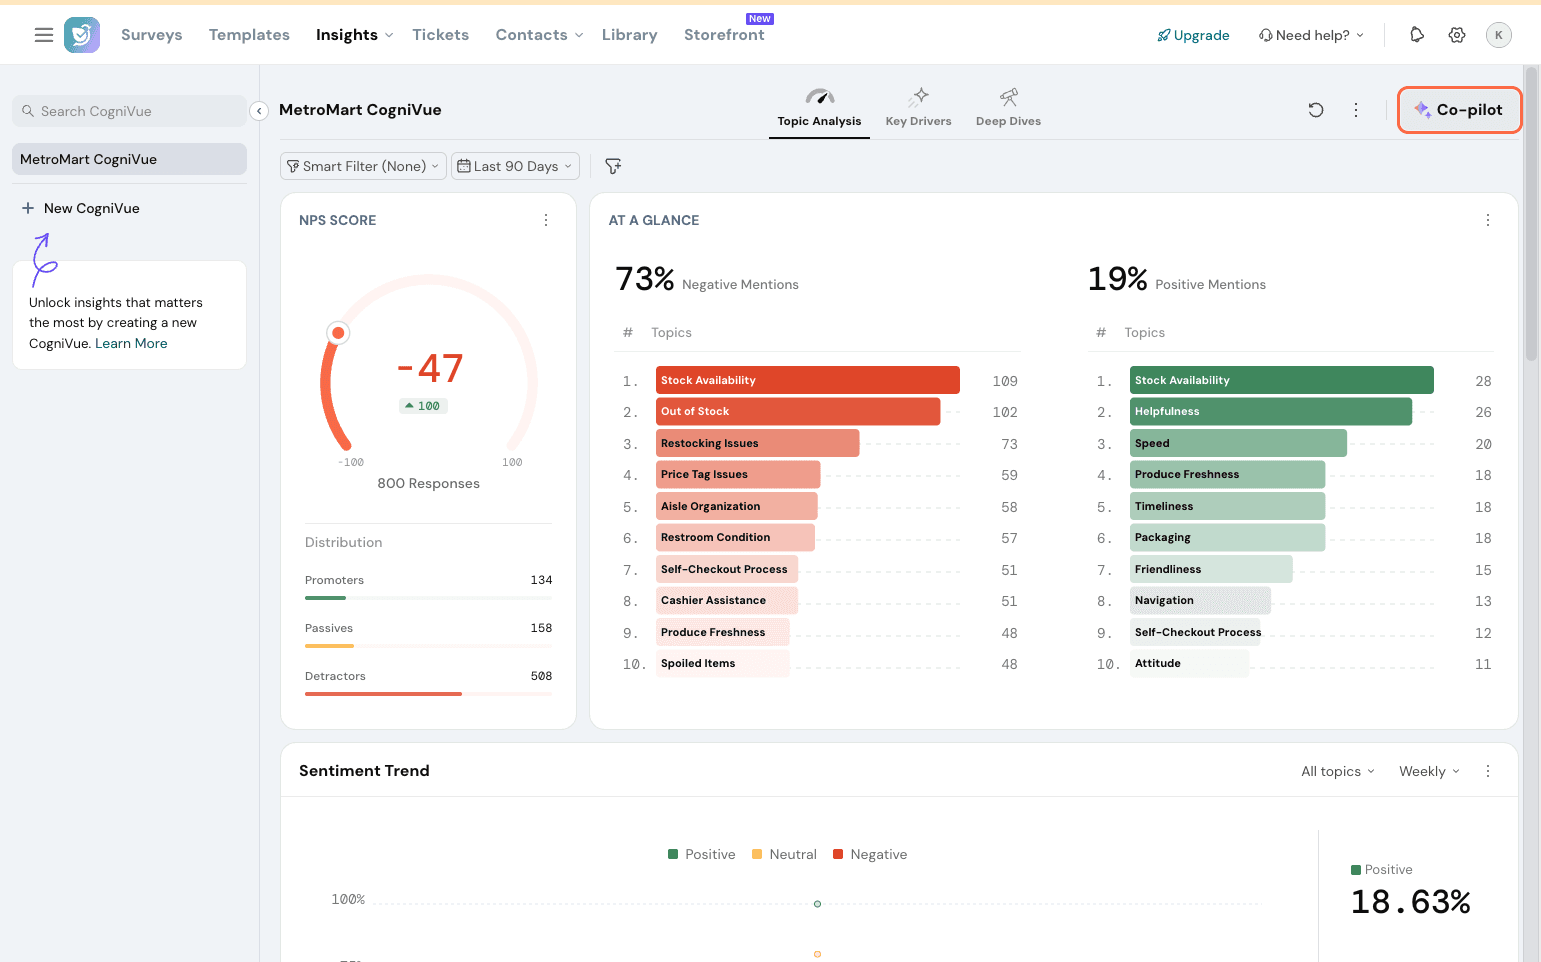
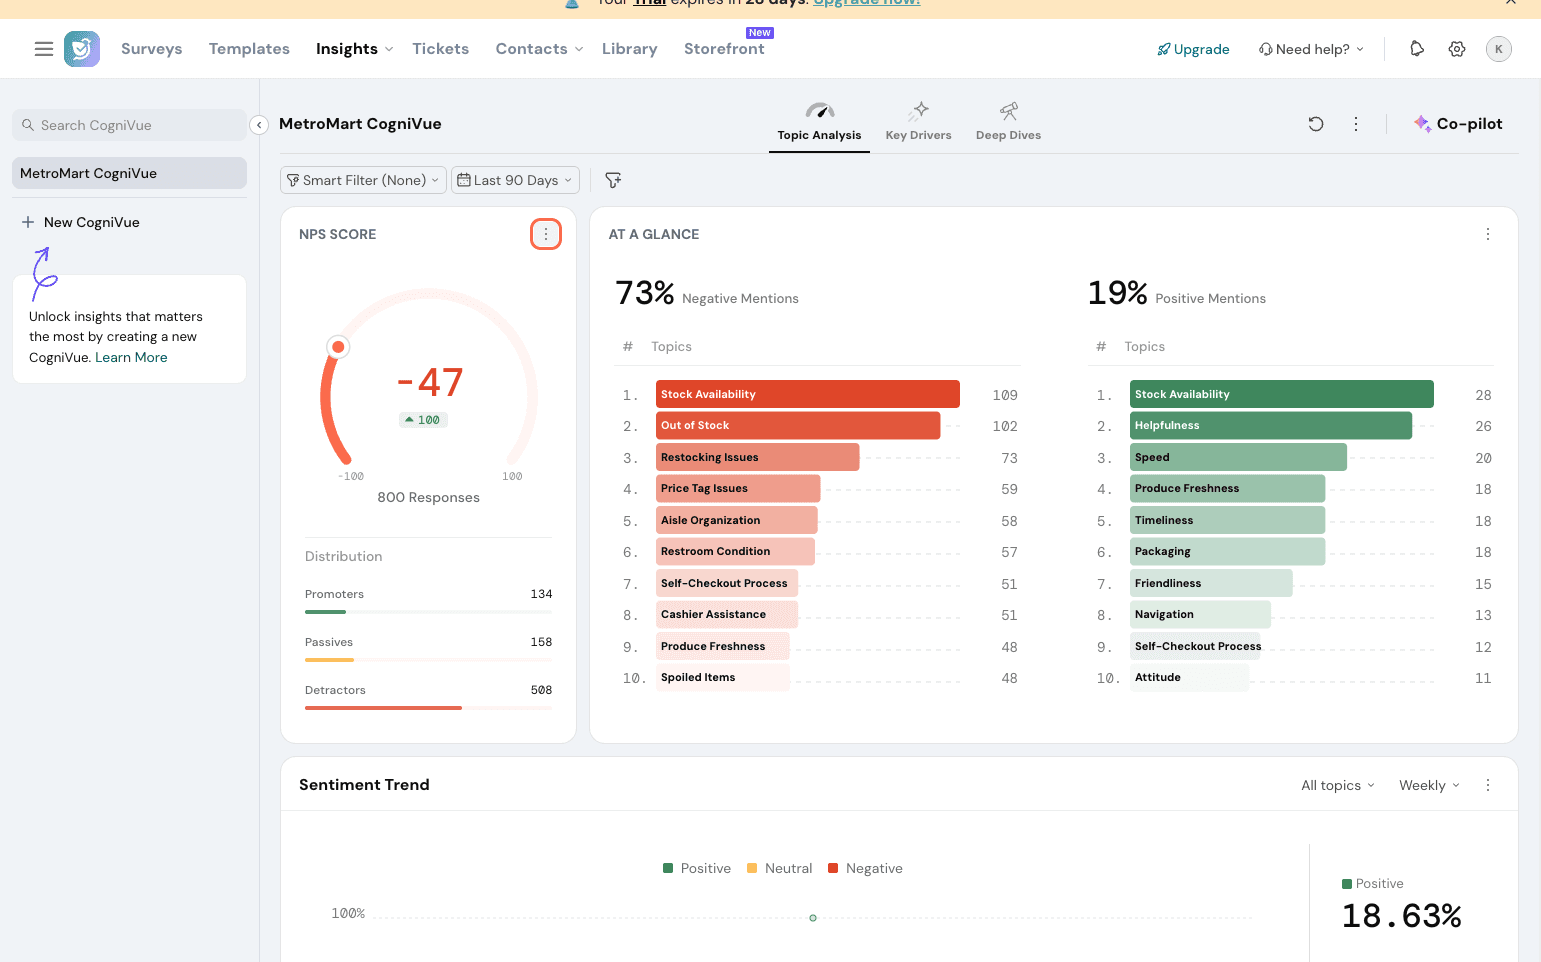
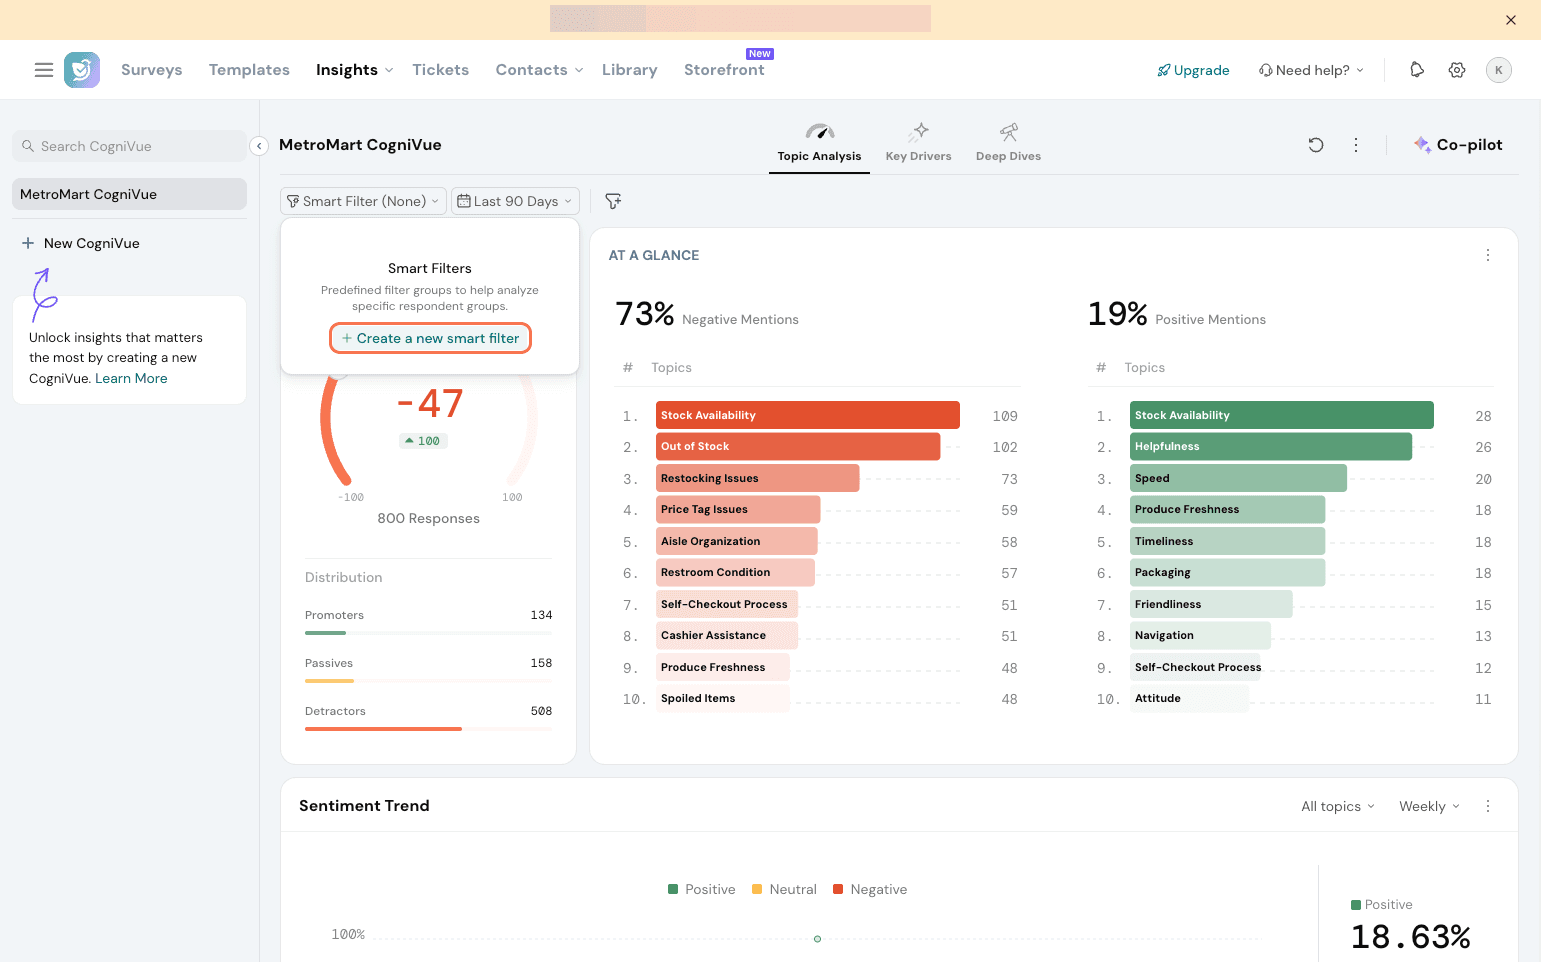
At a Glance
This widget lets you know the number of overall positive and negative mentions you have. It lists the top 10 sub-topics ranking positively and the top 10 in terms of negative mentions.
As the name suggests, you get the picture of what is working or not working for your brand. In MetroMart’s case, you can see these are the trending topics.
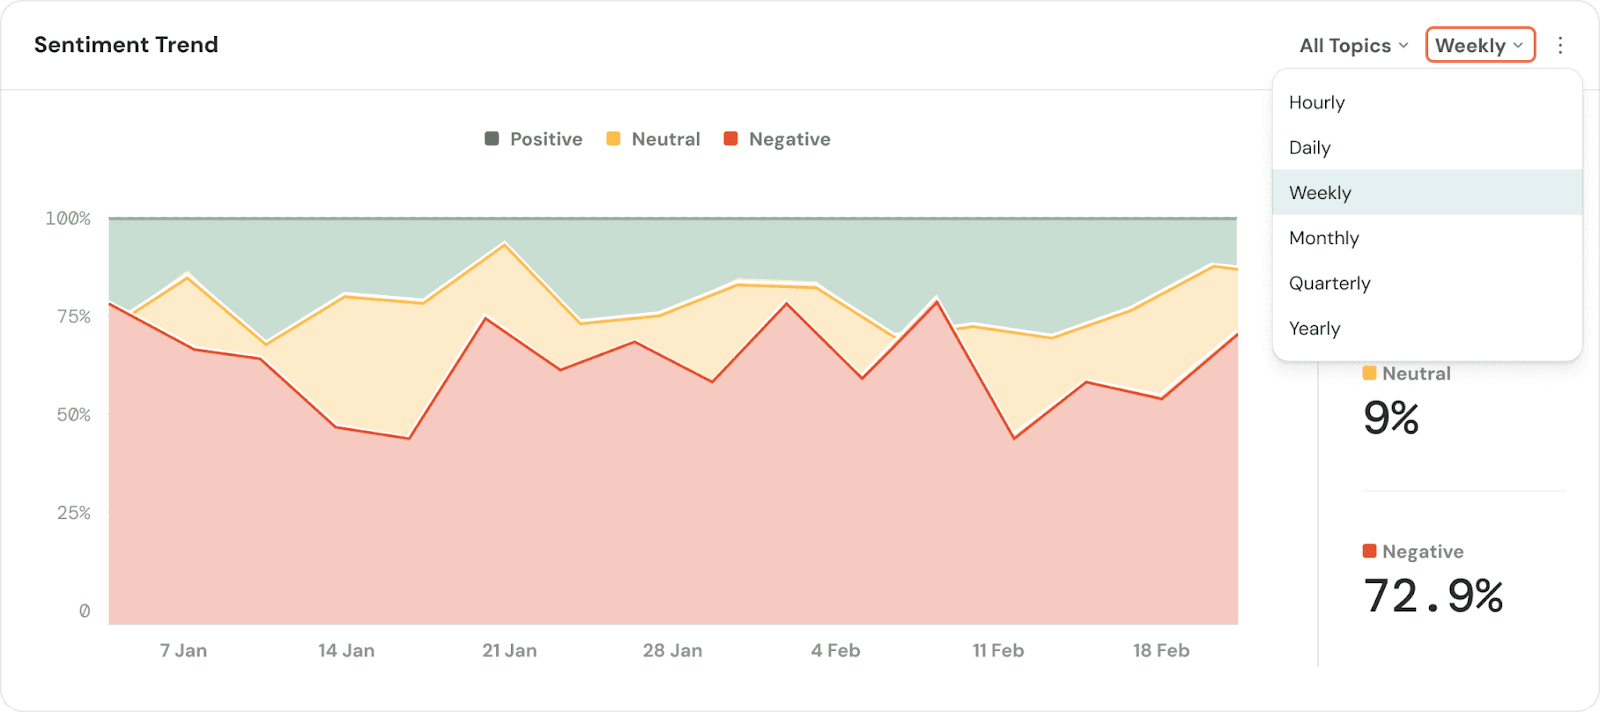
Sentiment Trend
This is a stacked area chart that tracks the % of positive, neutral, and negative sentiment trends over time and plots them for you.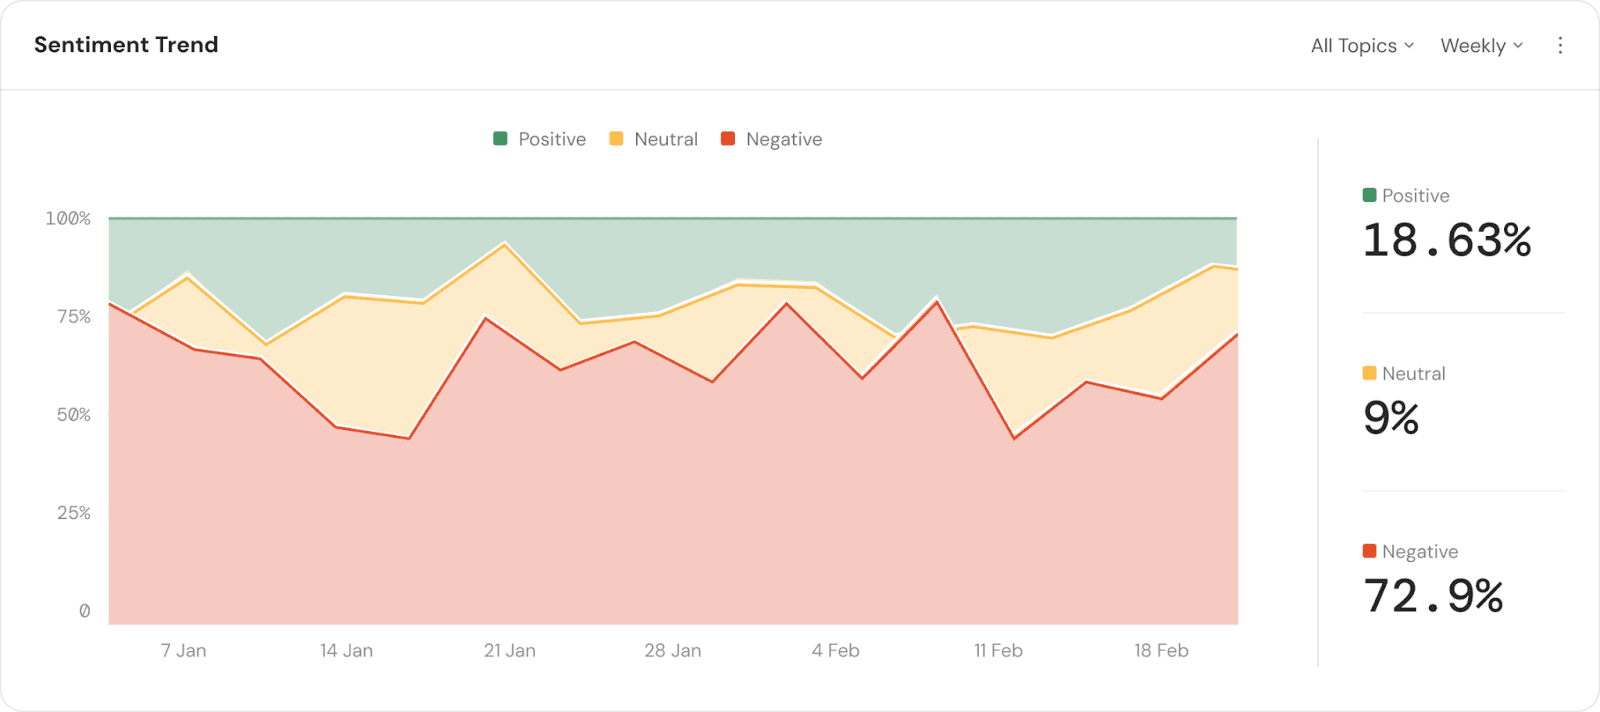
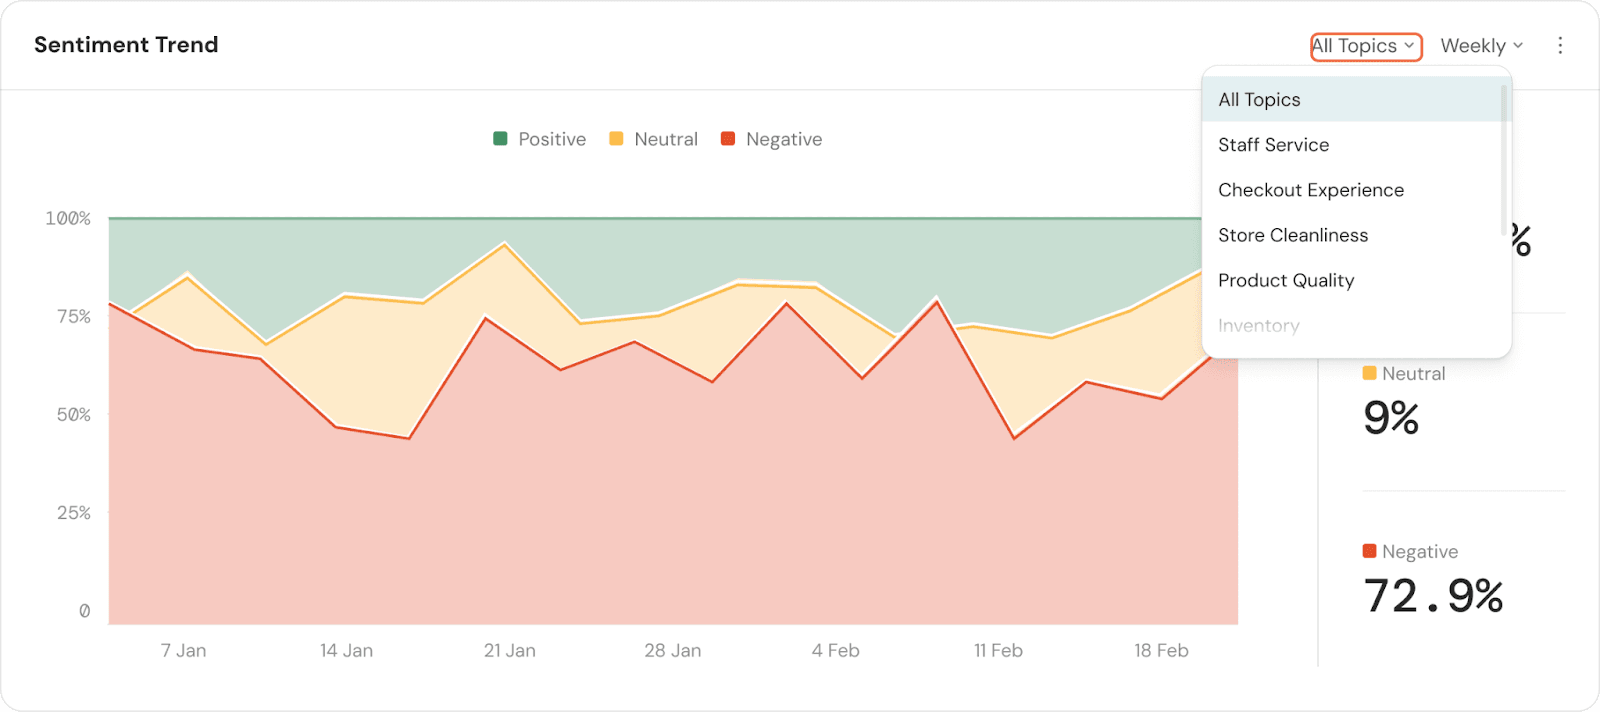
There is a dropdown for you to customise whether the chart needs to plot only the specific topics or the sub-topics. By default, all topics are chosen.
You can also choose to compare sentiment trends across time periods. Click on the dropdown and choose the timeframe.
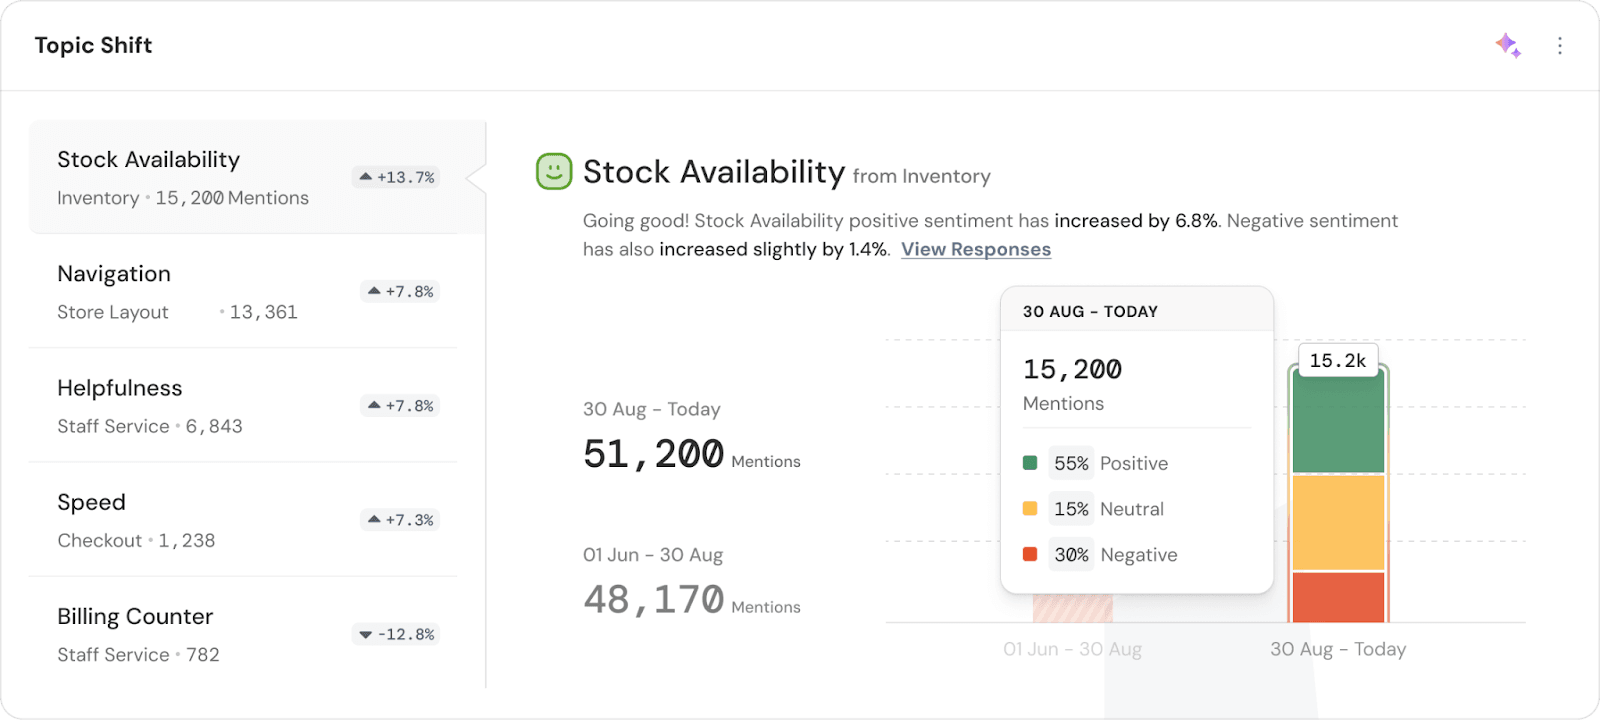
Topic Shift
The Topic Shift widget highlights the top five topics or sub-topics that have shown the most change in conversation volume when compared to the previous time period.
This widget helps you quickly understand which topics are gaining or losing attention in customer feedback and how sentiment within those topics is shifting.
- Top Topics: The five topics or sub-topics with the most change compared to the previous period.
- Mentions: The number of times each topic was mentioned.
- Change Percentage: This is the percentage change compared to the comparison period. This change reflects both volume and sentiment shifts, helping you understand not just how often a topic is mentioned, but also how sentiment around it has evolved.
Here, you can see the top topics for MetroMart.
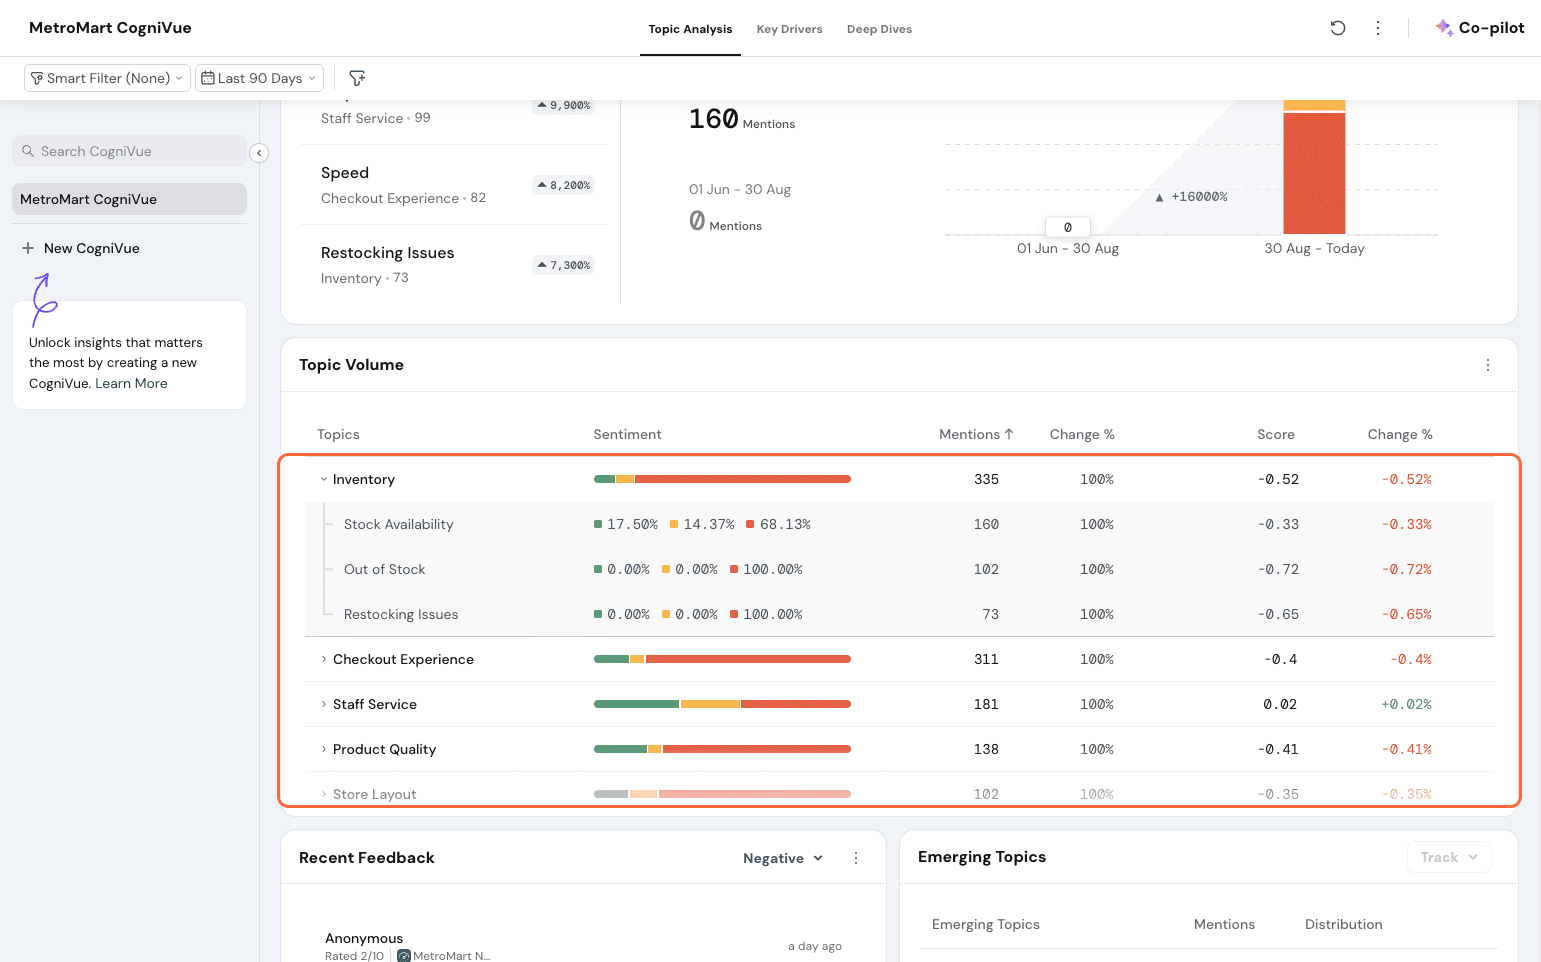
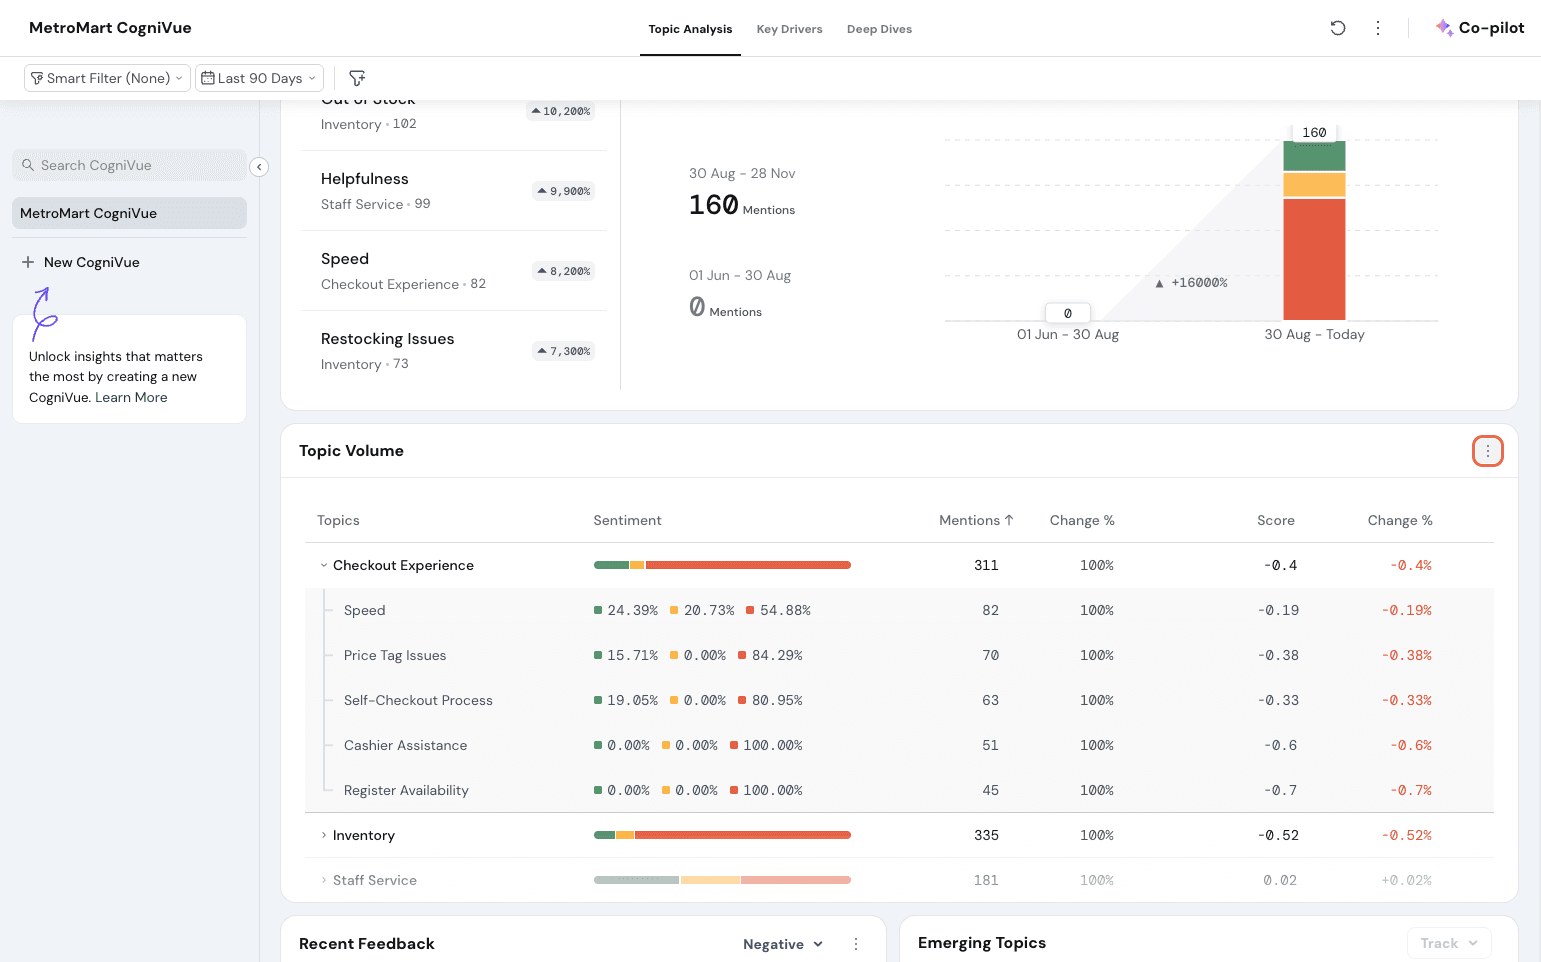
Topic Volume
The Topic Volume widget provides a comprehensive overview of all your defined topics, keeping you updated on customer sentiment in real-time.
Here's what it offers:
- Sentiment Score and Mentions: See the overall sentiment score (reflecting customer perception) and the number of mentions for each topic.
- Mentions: The number of mentions for each topic.
- Count change: The change in the number of mentions of the topic compared to the previous time interval.
- Score Change: This highlights shifts in sentiments compared to the previous time interval. Sentiment for a topic is calculated by taking the sum of all sentiment instance scores and dividing it by the total instances. Values will range from -1 to 1, -1 being the most negative and 1 being the most positive. The value is determined by the severity of the responses.
Here, you can see the entire topics and subtopics split for MetroMart.
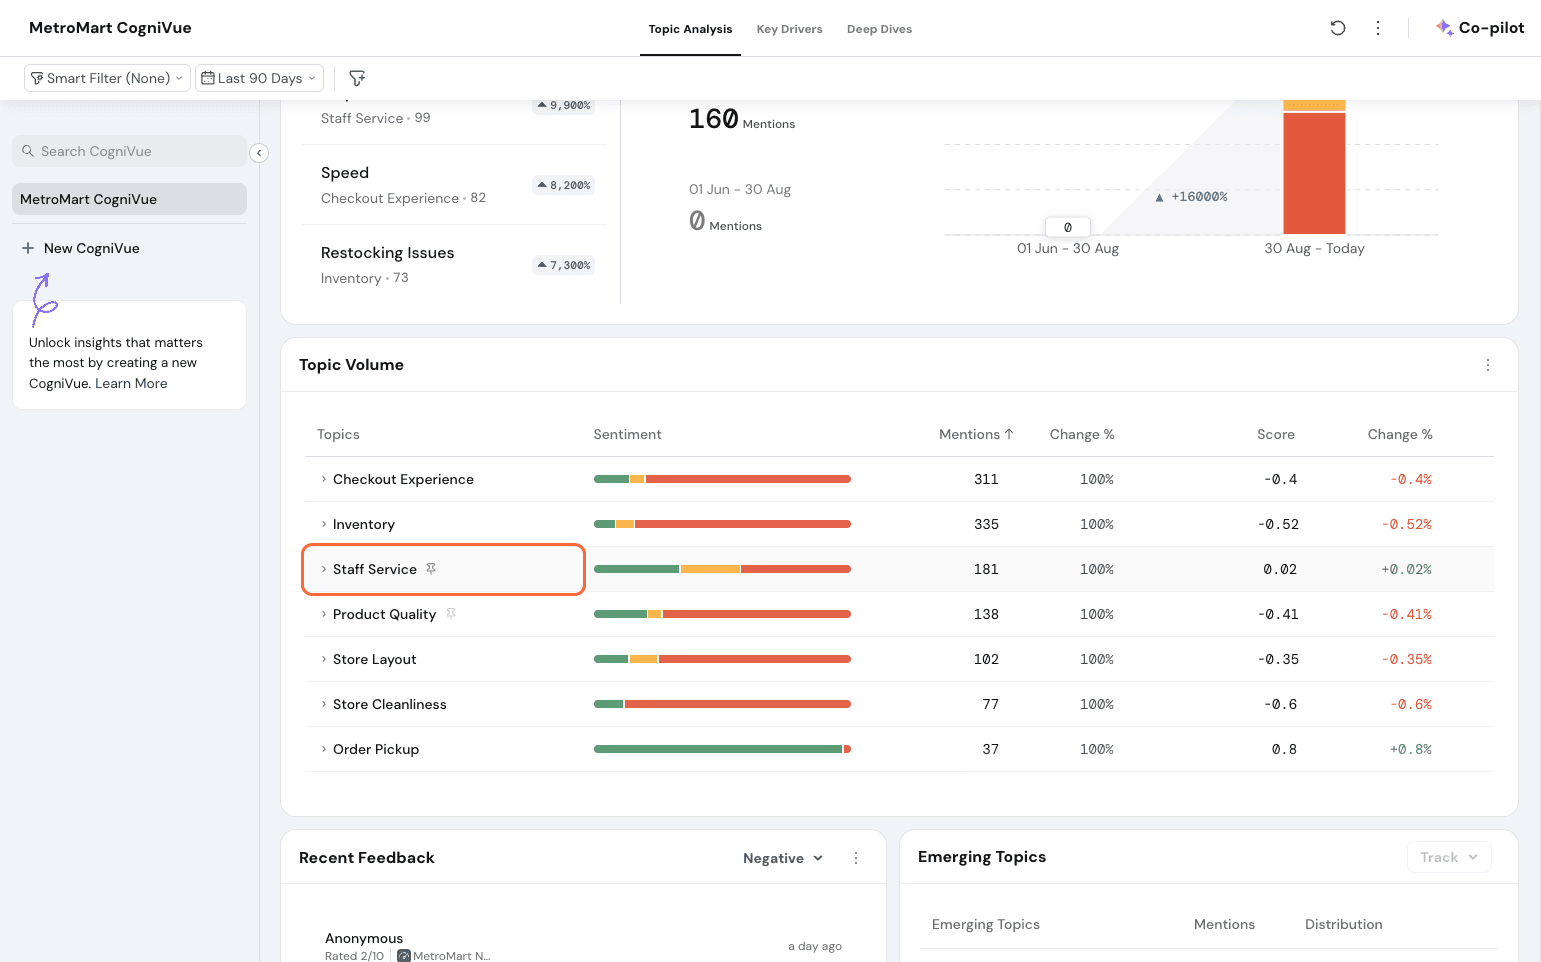
Subtopic Drill-Down:
For topics with subtopics, you can toggle to view individual subtopic scores or click on a topic to explore specific customer reviews. Let’s click on Staff Service and view the sub-topic split.
Here, you can see that the sub-topic Attitude has a 67% negative sentiment rating, and it has changed for the worse in the past few months.
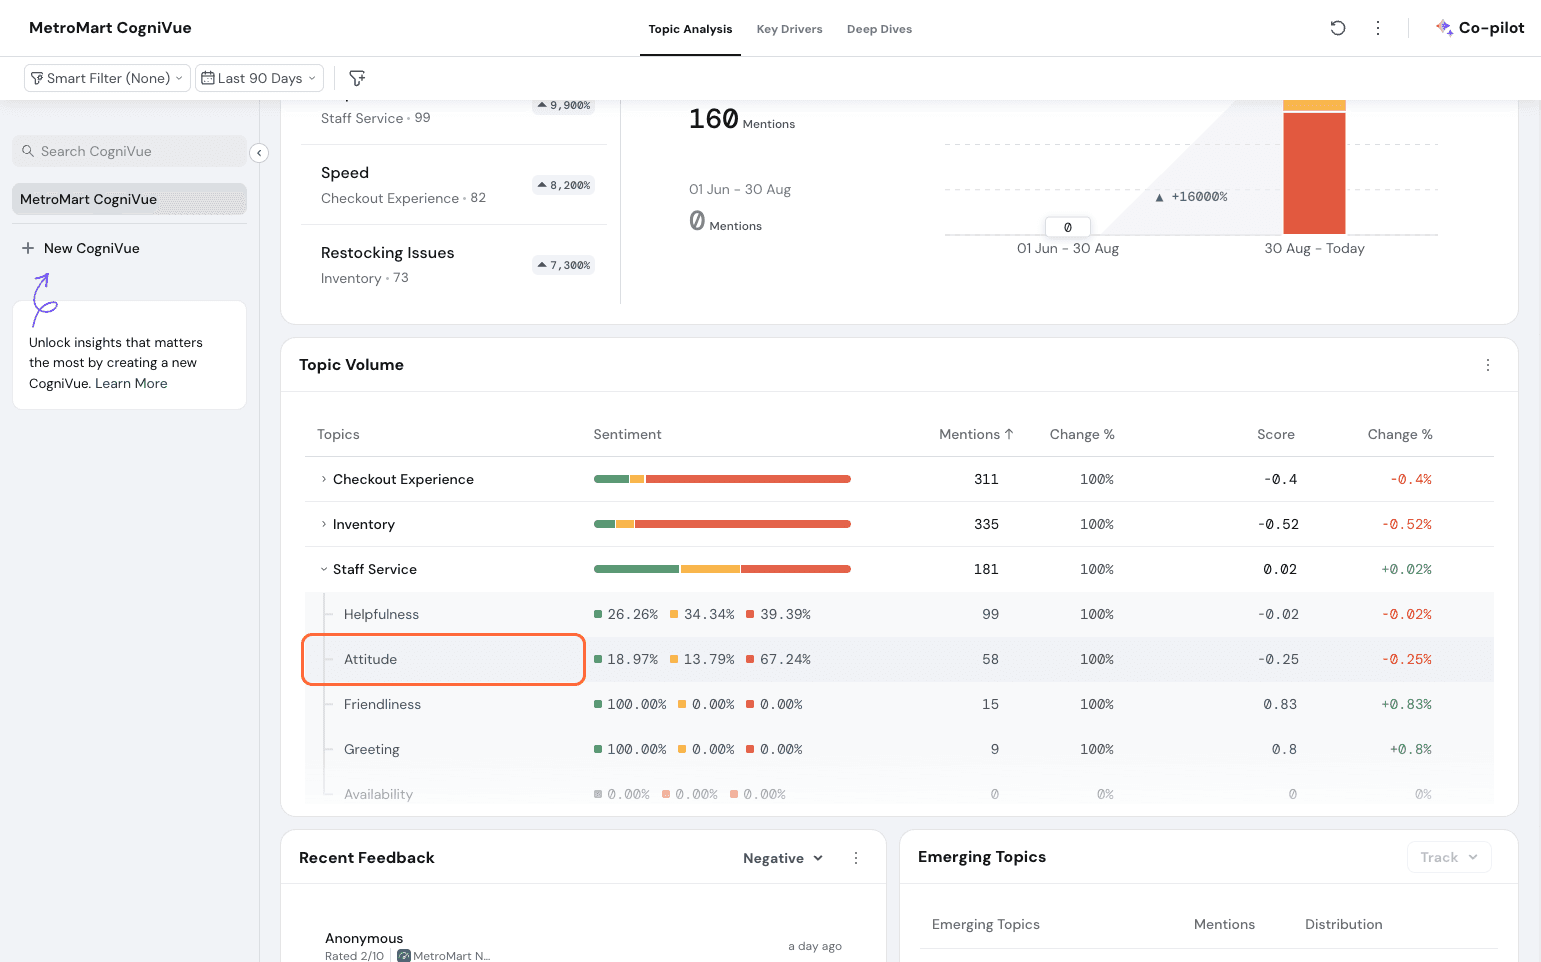
You can click on the sub-topic and go to the specific responses to understand what customers are feeling.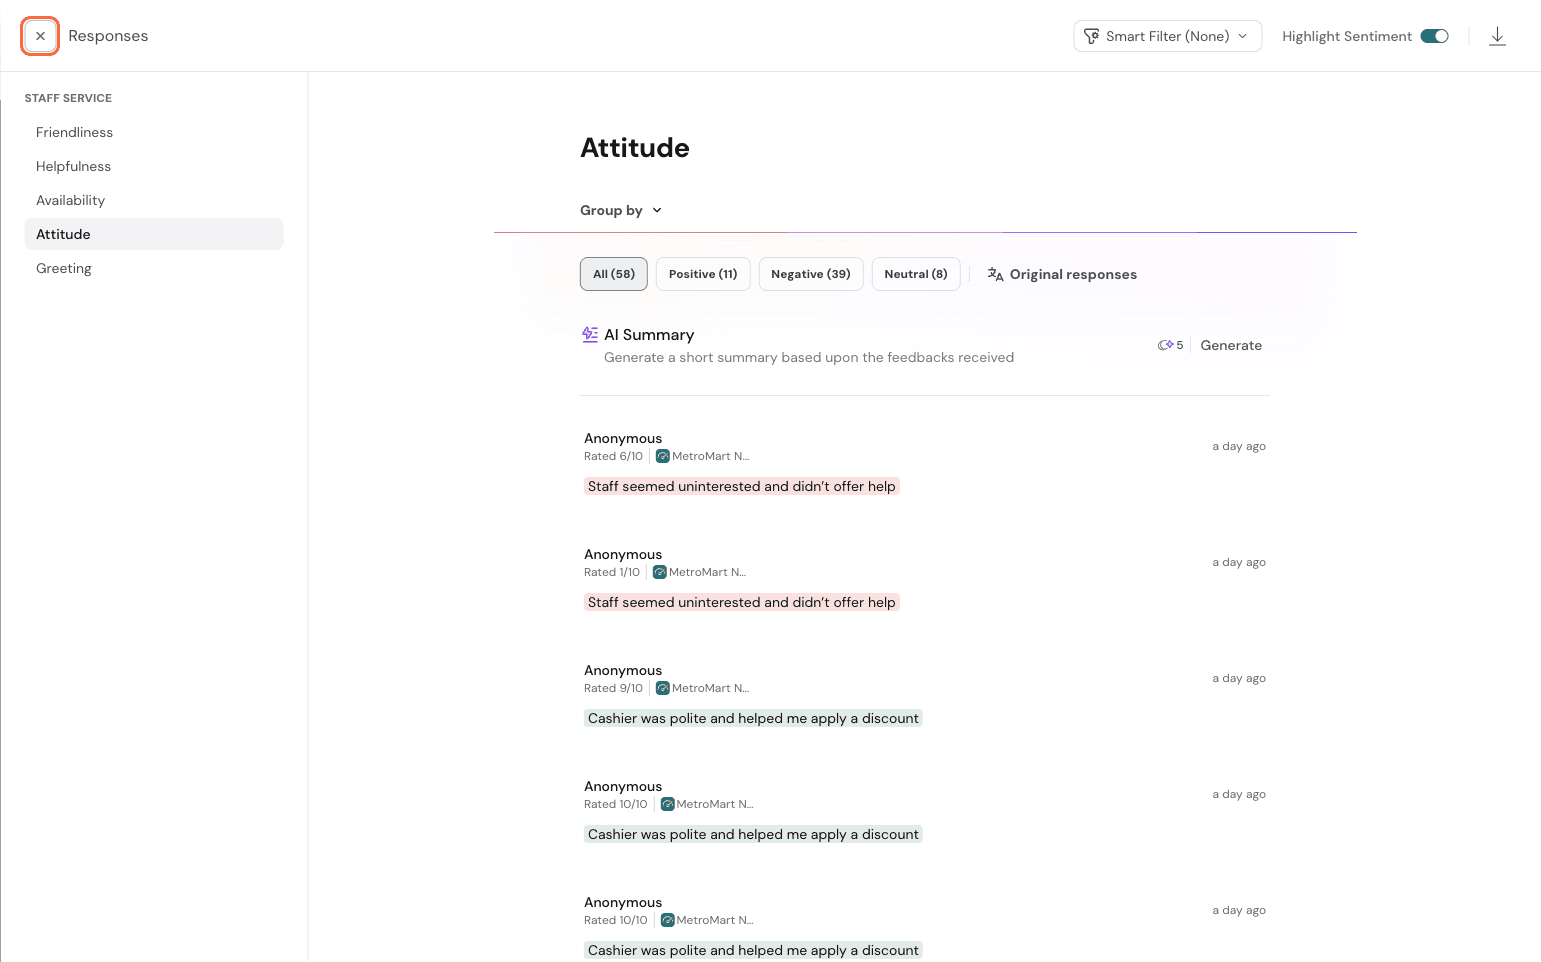
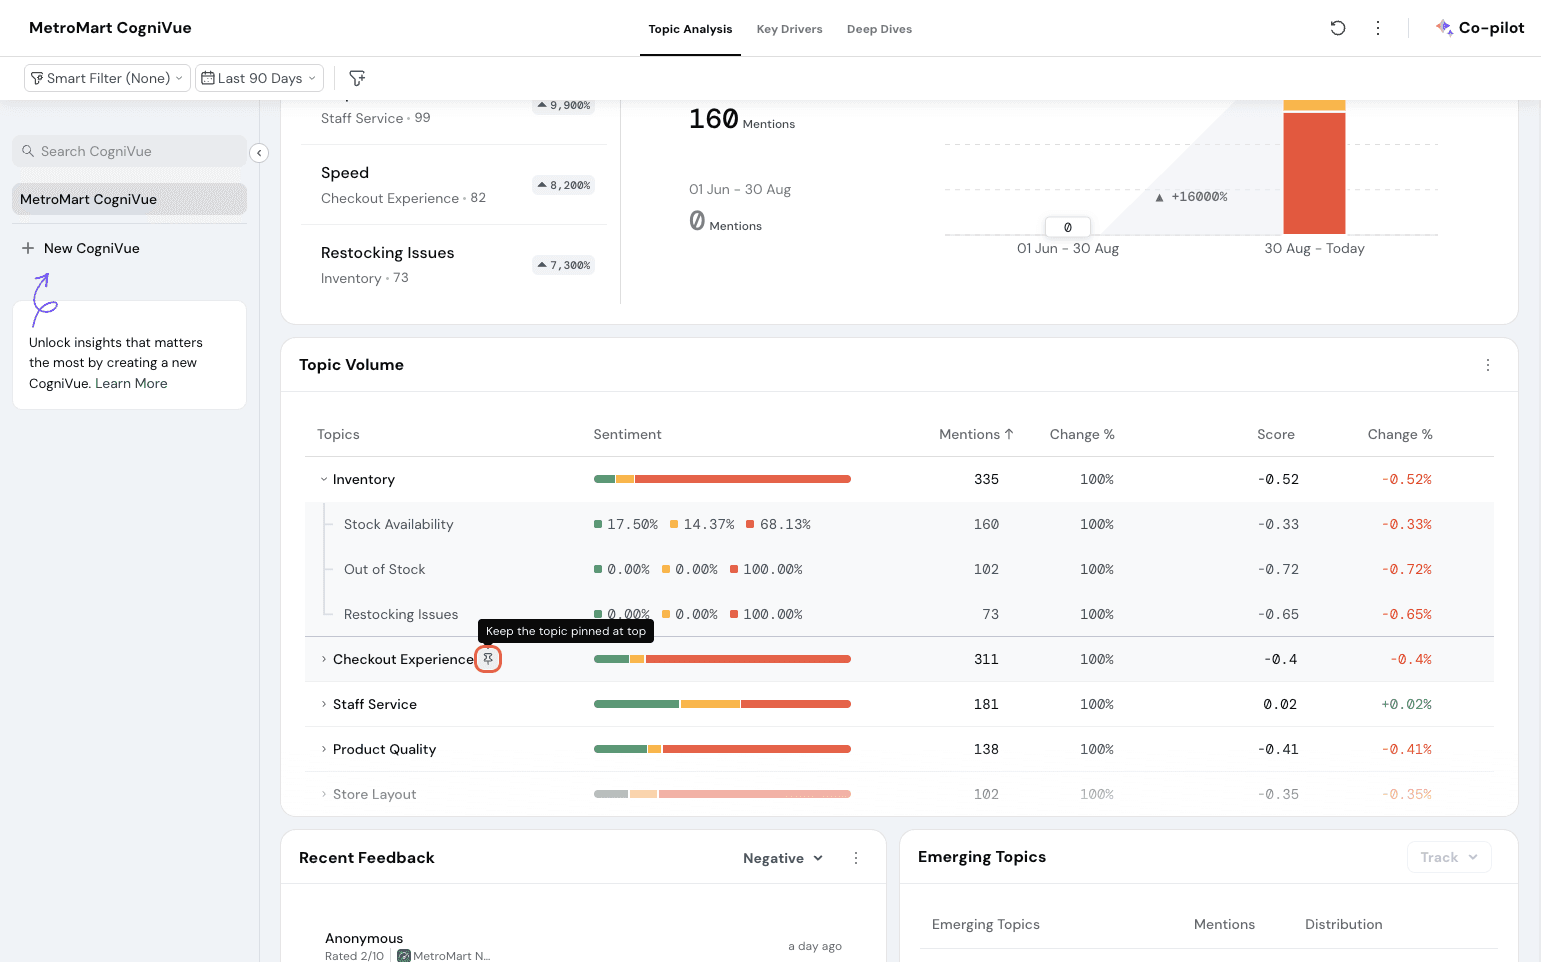
You can choose to have a specific topic pinned to the top, so you can always see its trends immediately.
Recent Feedback
This widget is a feed that shows the excerpts of the recent feedback for the selected date range received via your sources.
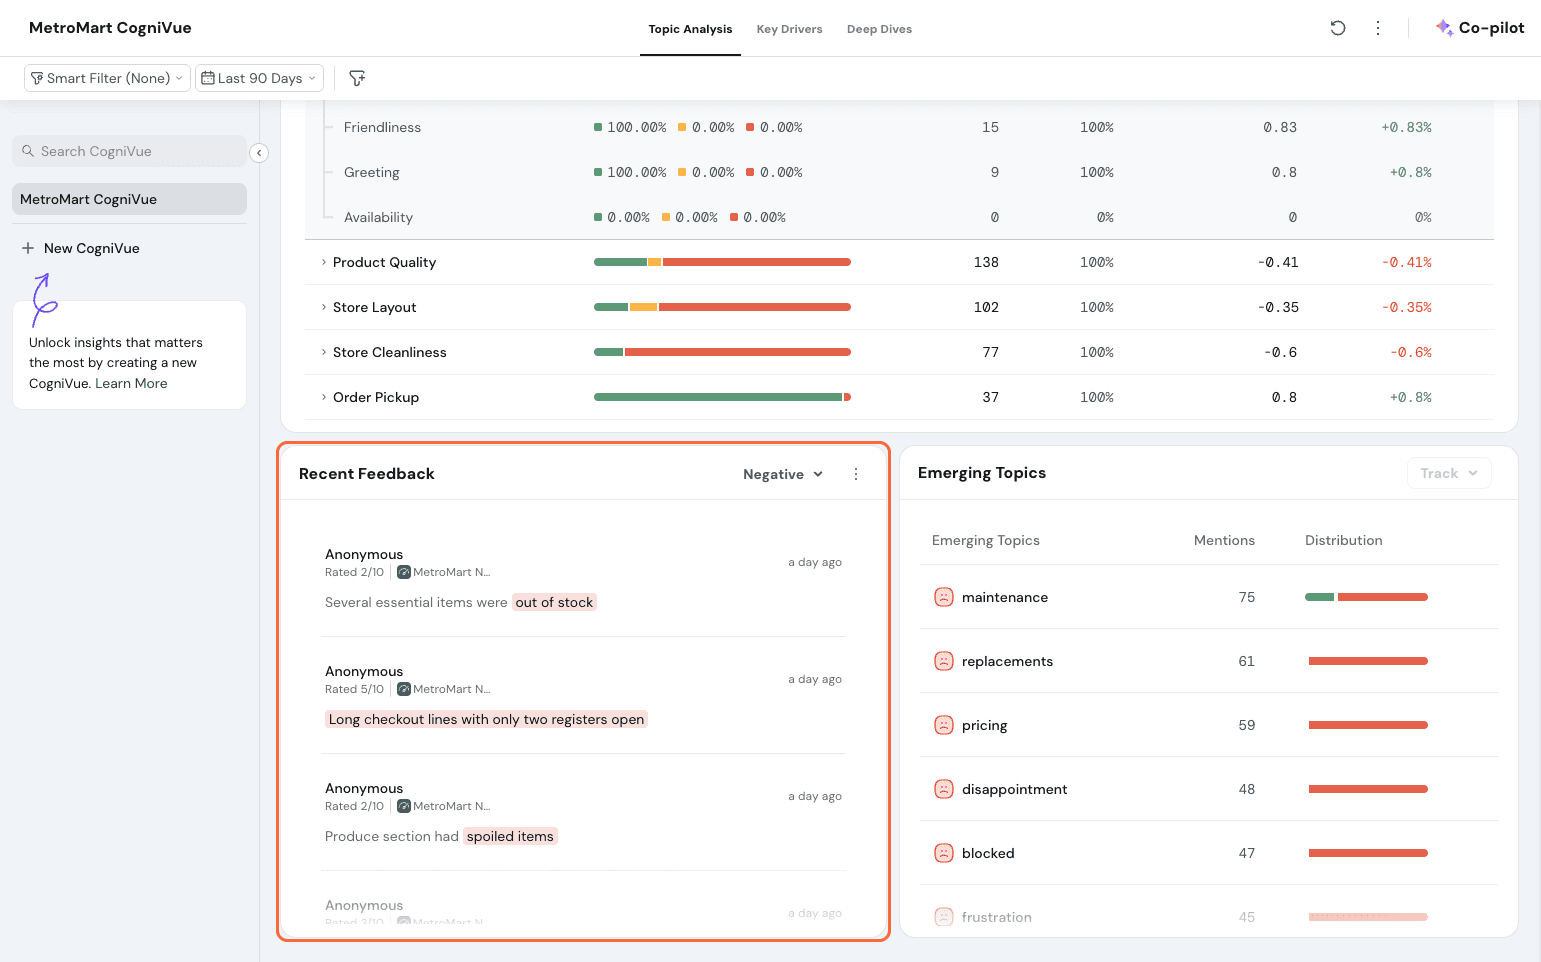
By default, the negative feedback is shown. You can toggle to have positive feedback shown.
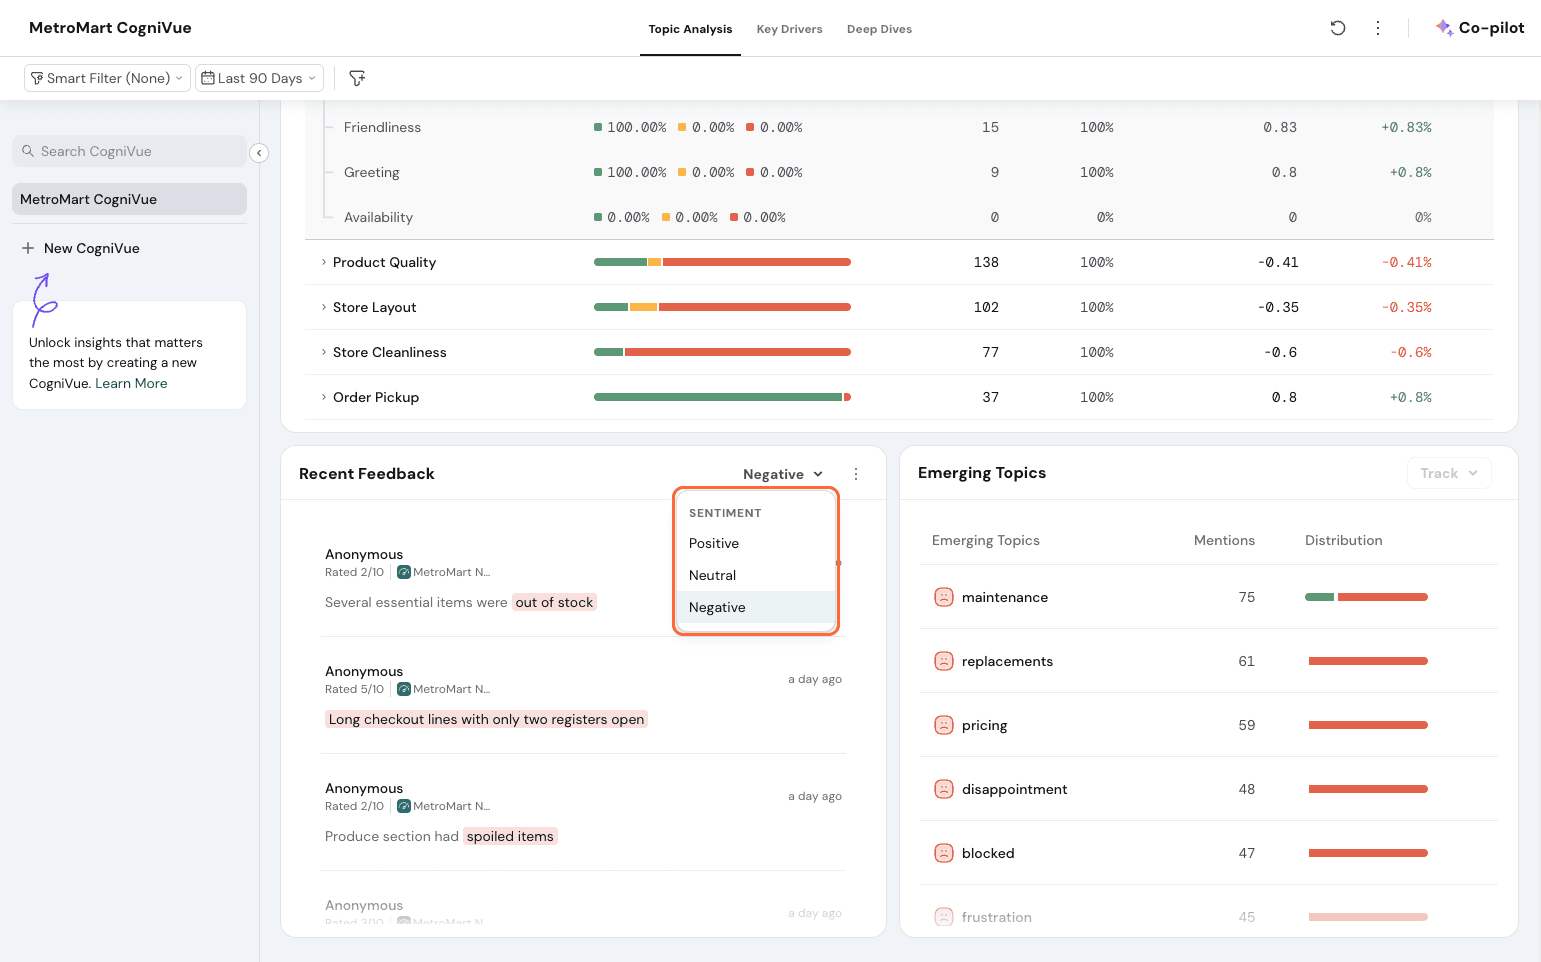
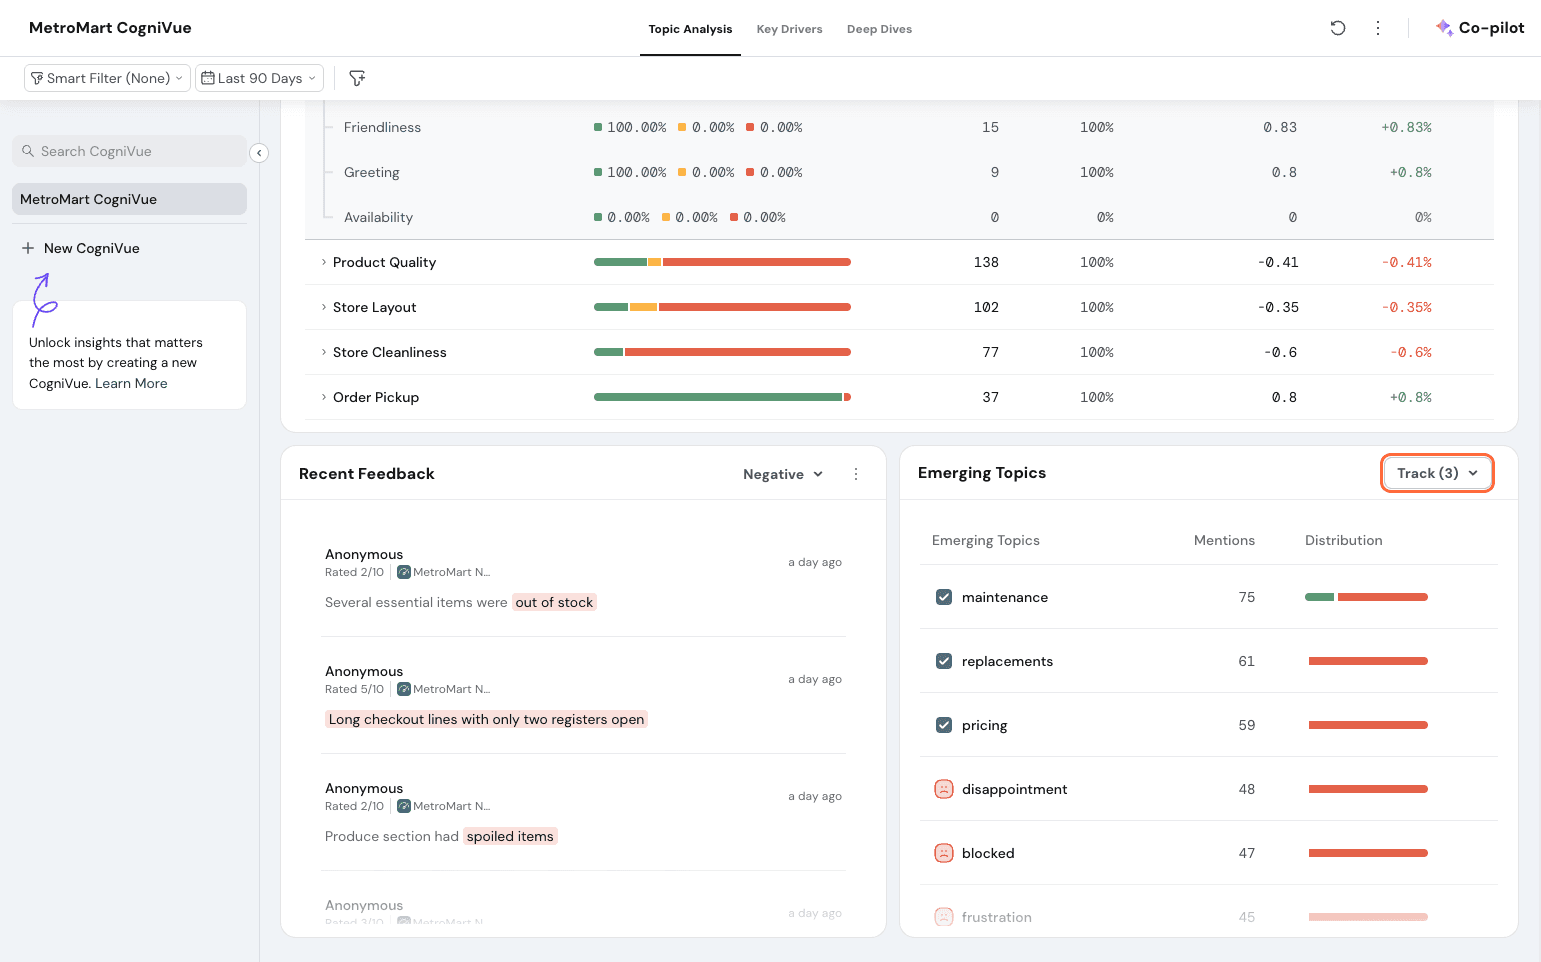
Emerging Topics
Emerging topics highlight themes that customers are discussing more often in the recent timeframe, but are not currently being tracked inside the CogniVue. It automatically detects topics that occur more frequently than a certain threshold.
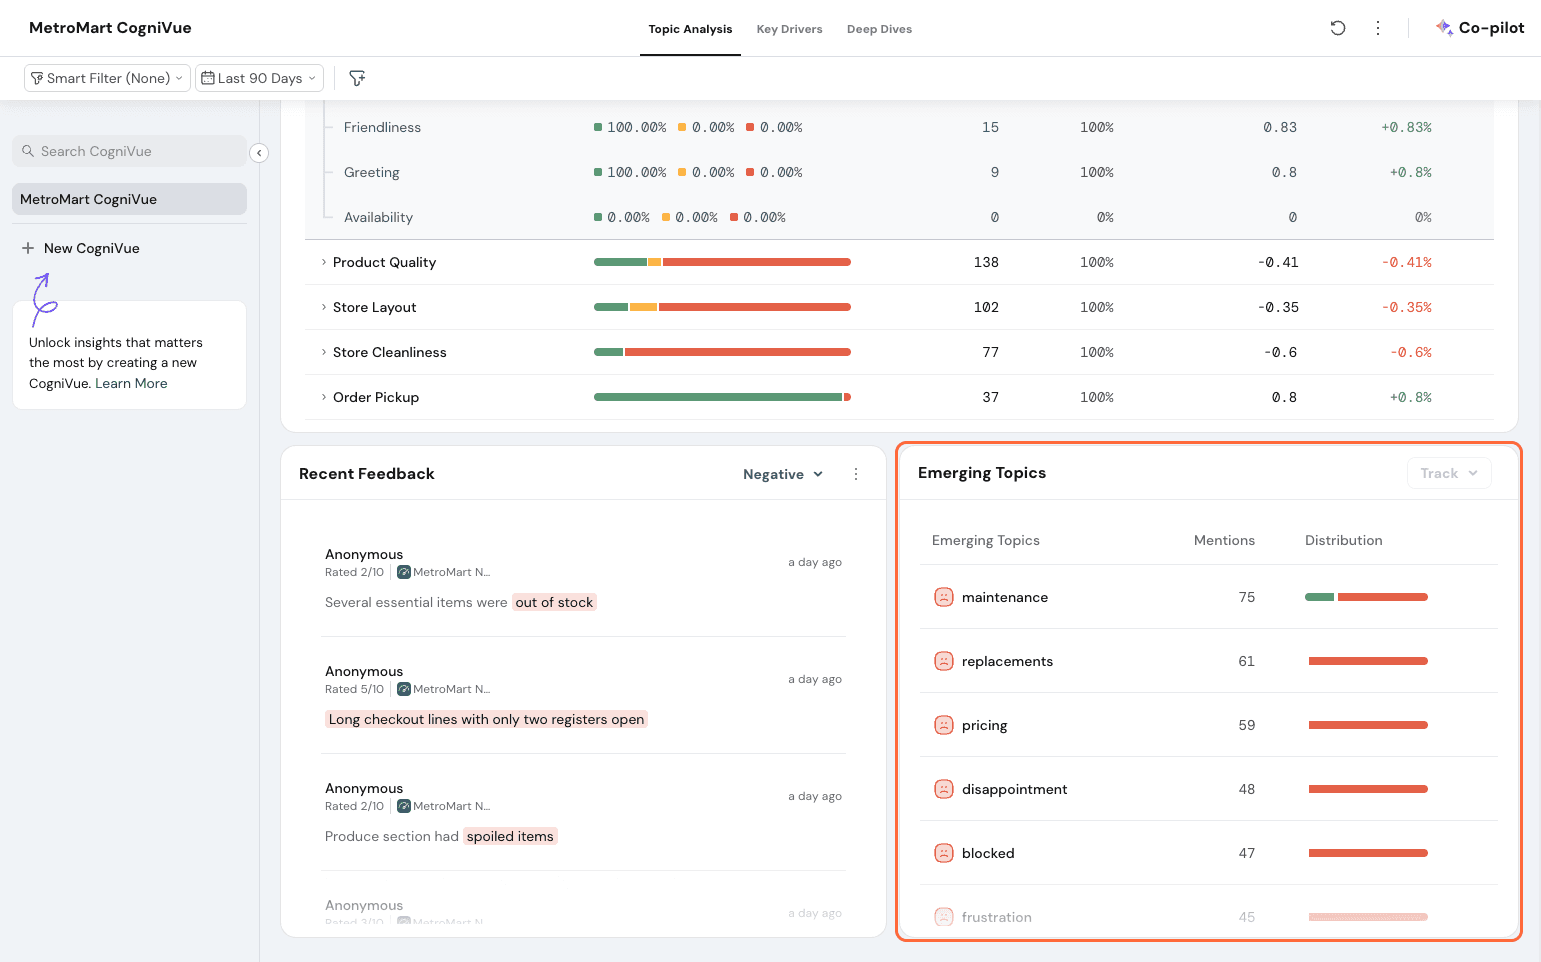
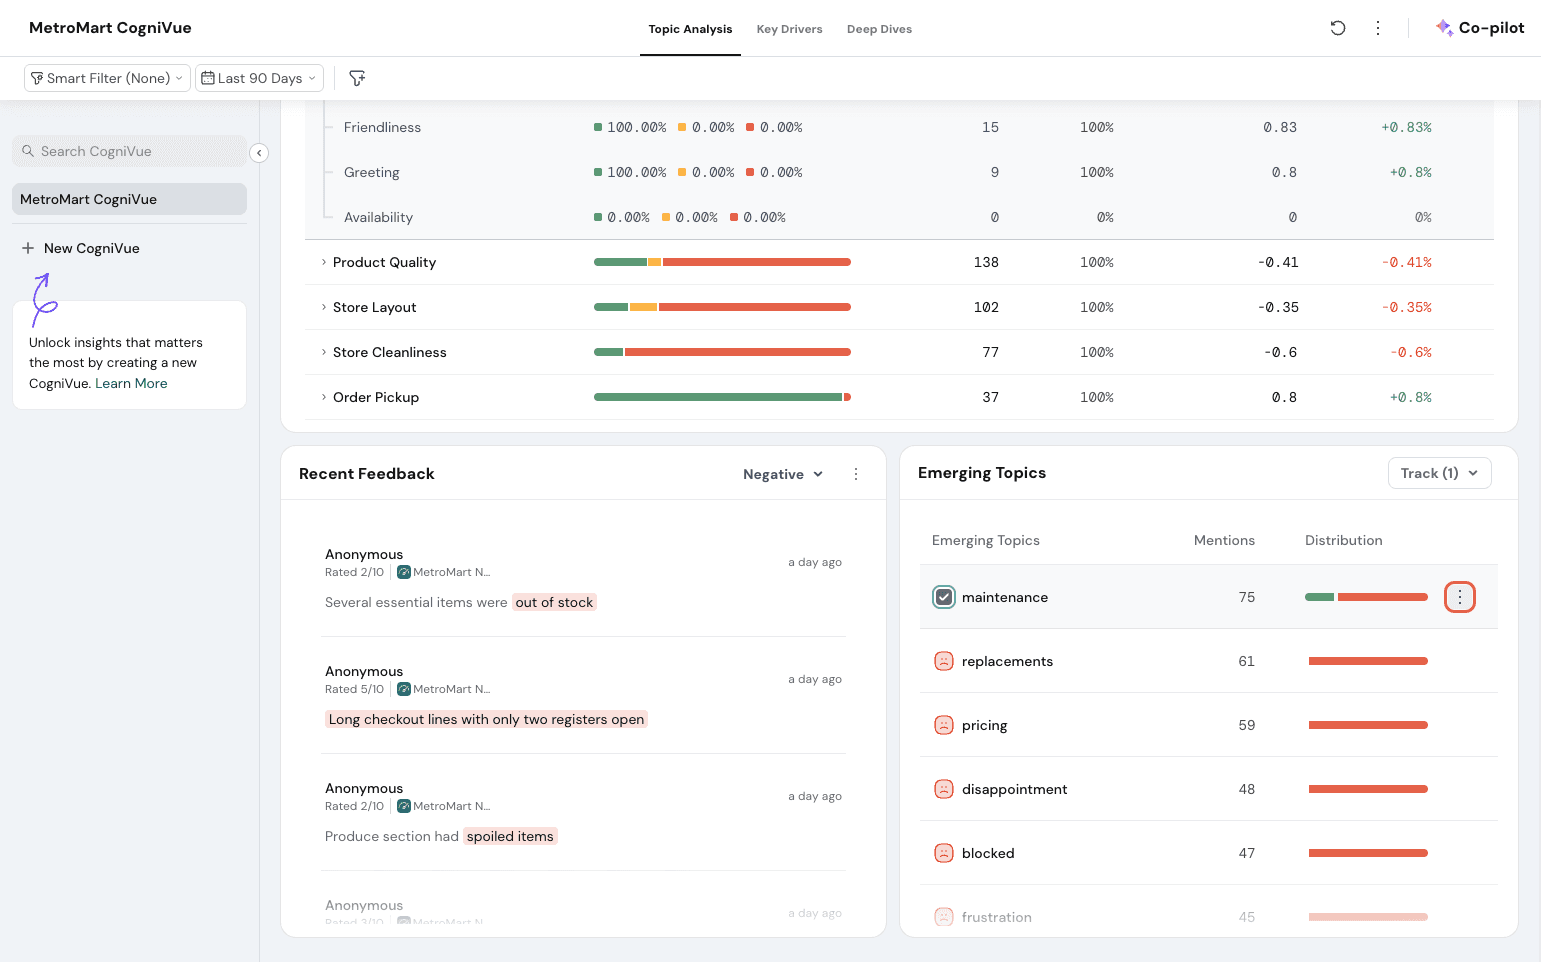
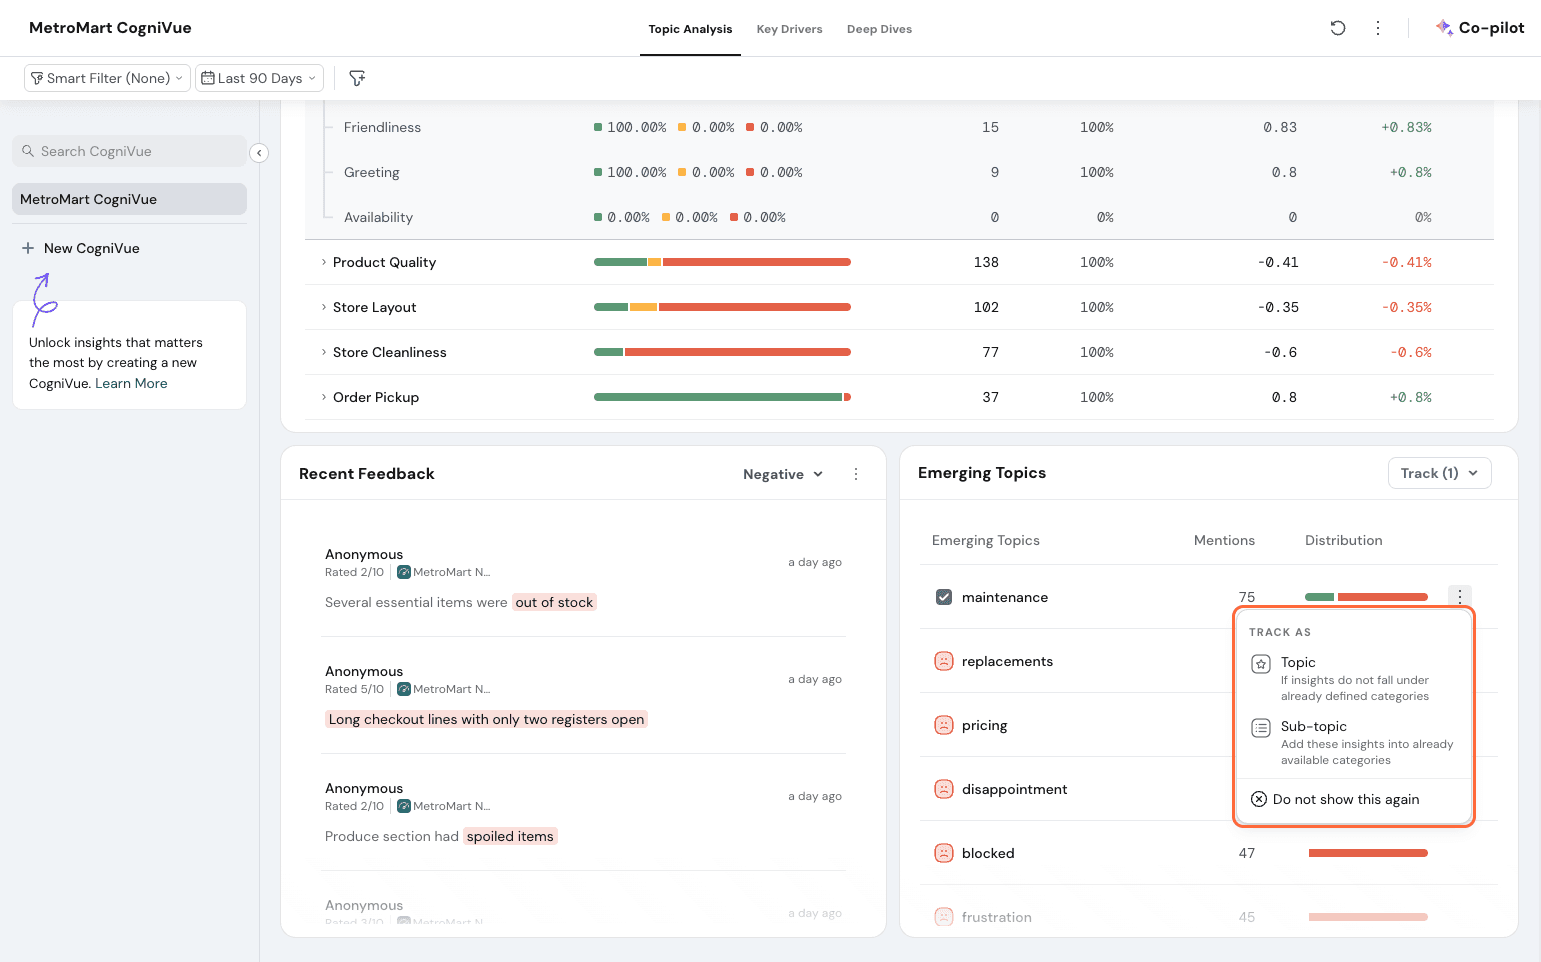
This widget shows the topic, the number of mentions, and the sentiment distribution. If you wish to act on this, click on the 3 dots at the side of a topic. Let’s select Maintenance.
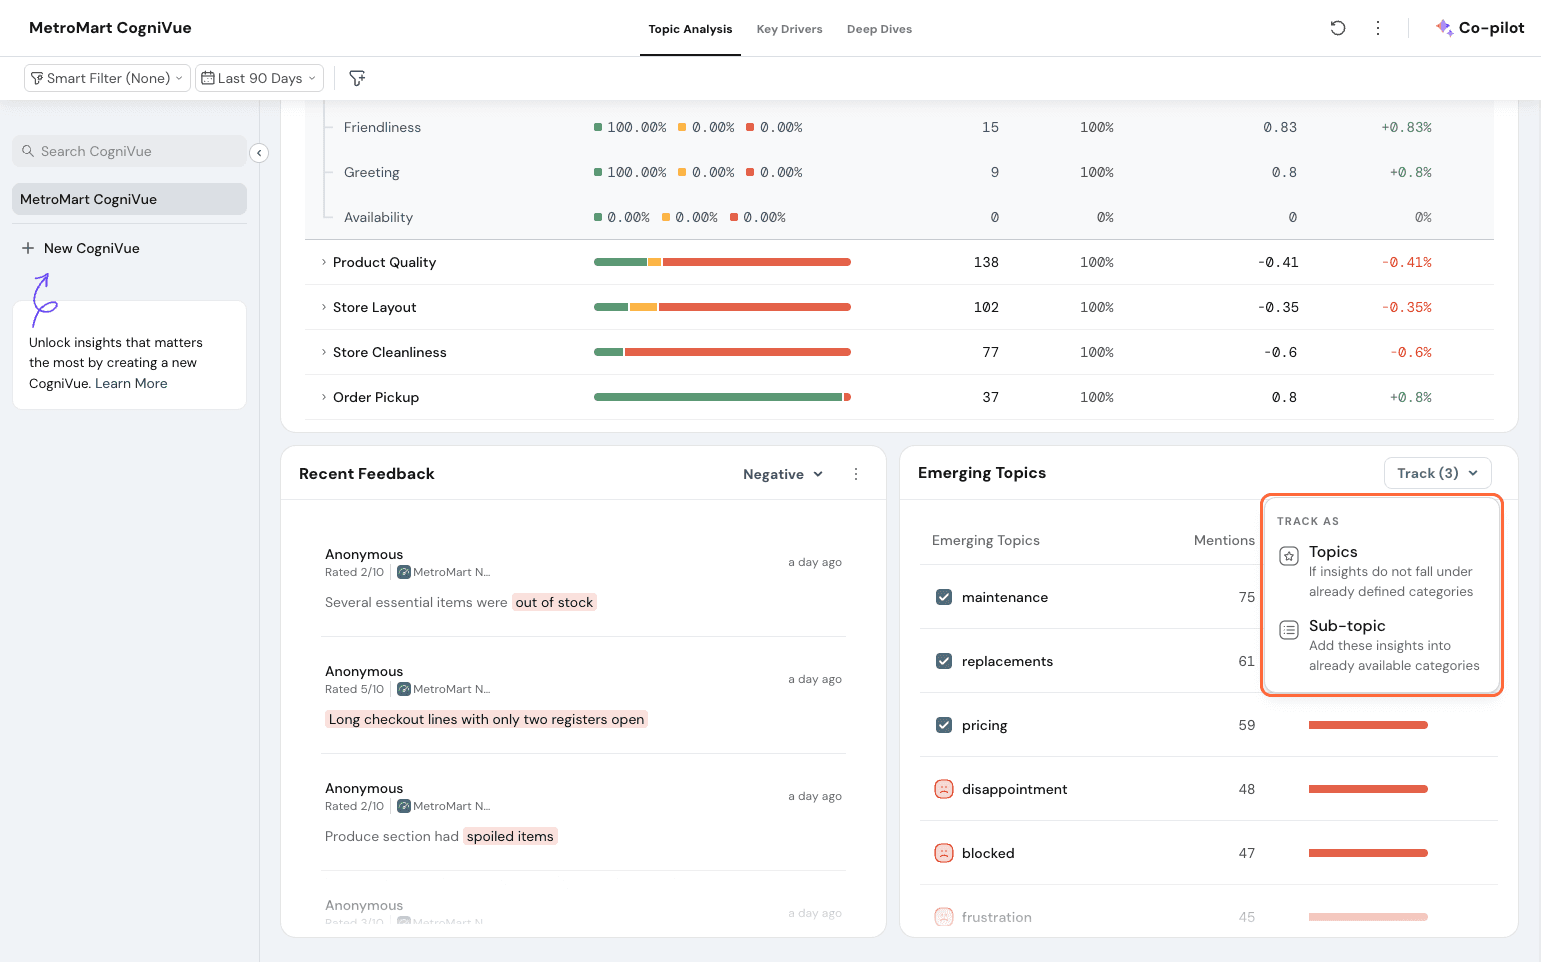
You can track as a topic, sub-topic, or if you wish to never receive that suggestion again, click on “Do not show this again”.
If you wish for all suggested topics or multiple topics to be added at once, select the topics in bulk.
Click on “Track” and choose whether they need to be topics or sub-topics.
Once you have added the sub-topic, it automatically updates in real-time to have the sentiment reflected in the widgets above.
Note: If your quota for topics and sub-topics is full and you try adding a new topic, you will be notified to remove an existing topic to accommodate the new one.
Common Actions:
Co-pilot
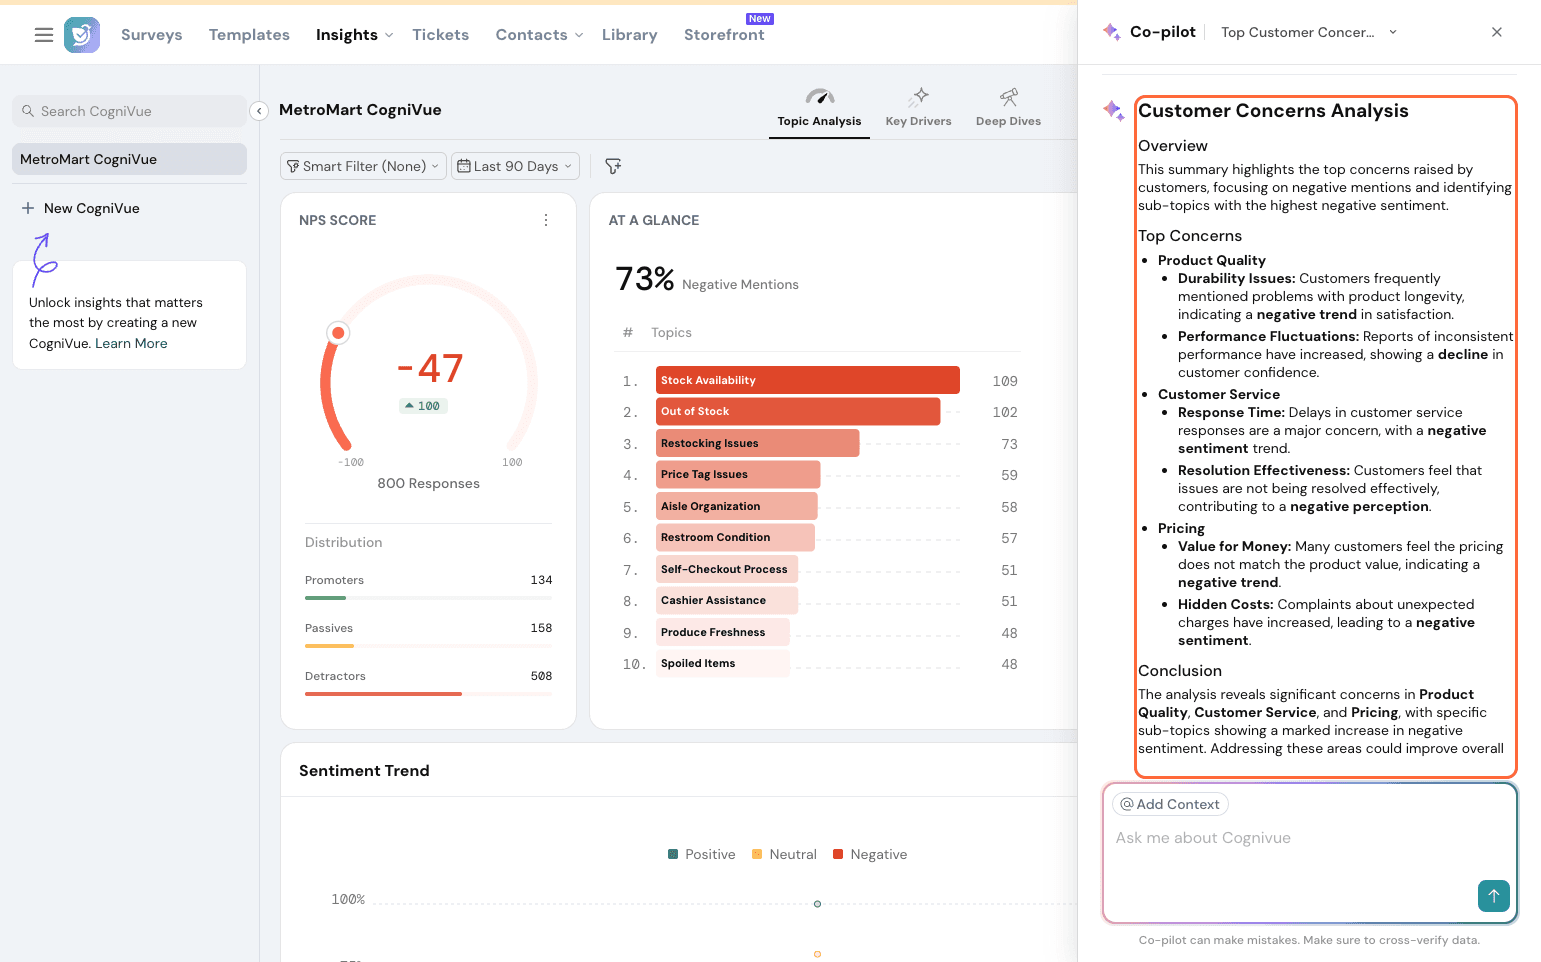
If you wish to understand more, you can utilise Co-Pilot to get the summary and ask more questions. Note that this action consumes AI credits.
Click on Co-pilot.
You can pick some commonly asked question prompts or type in your own query.
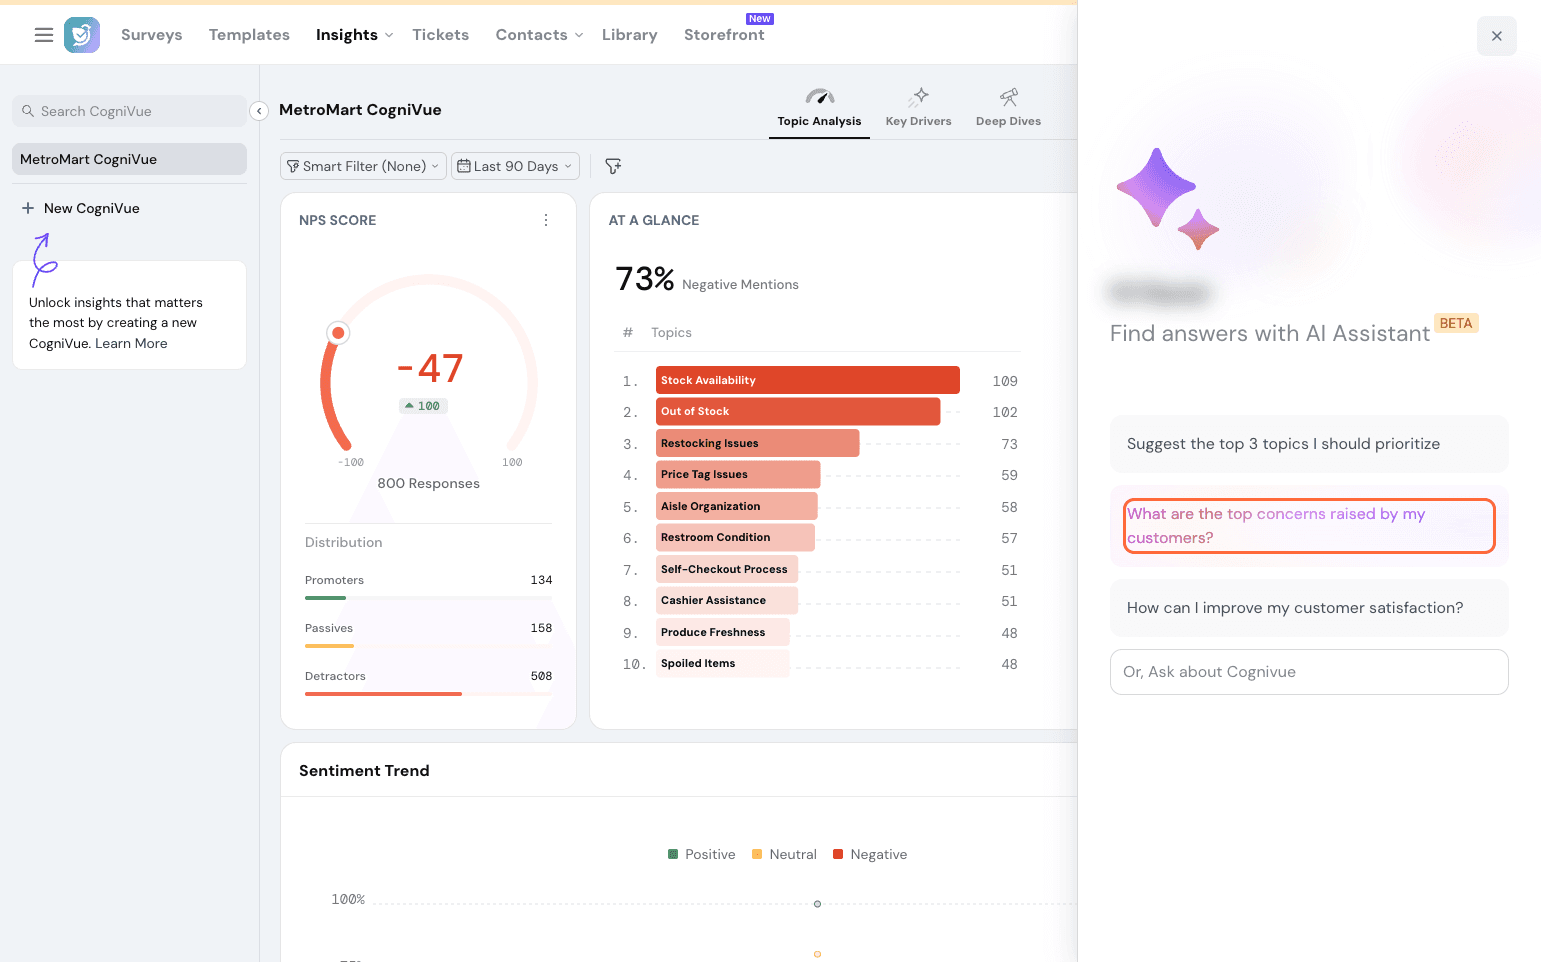
You will get a detailed explanation of your CogniVue dashboard to understand your metrics better.
Add to Dashboard
From the Topic Analysis section, you can add all widgets except emerging topics to your executive dashboard.
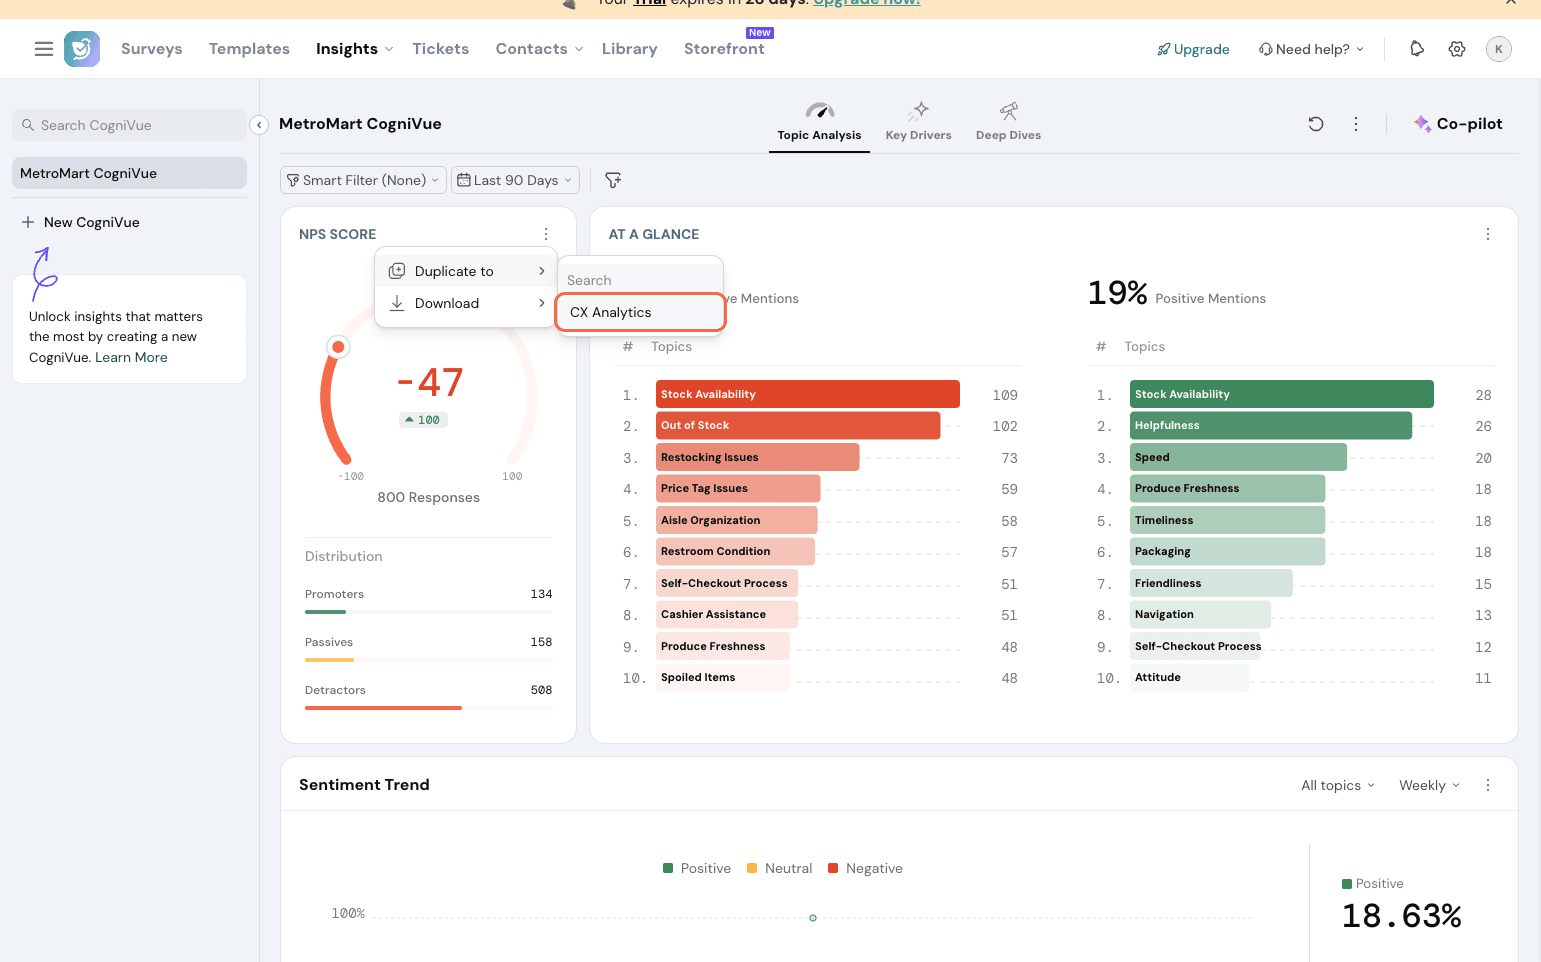
Select a widget to add to your dashboard. Let’s go with the NPS widget. Select the 3 dots on the widget.
Click on Duplicate, select your dashboard, and add it.
All widgets except emerging topics can be exported as PNG, JPEG, CSV, and XLSX. The metrics widget can be exported only as an image; the rest can be exported as CSV and XLSX as well.
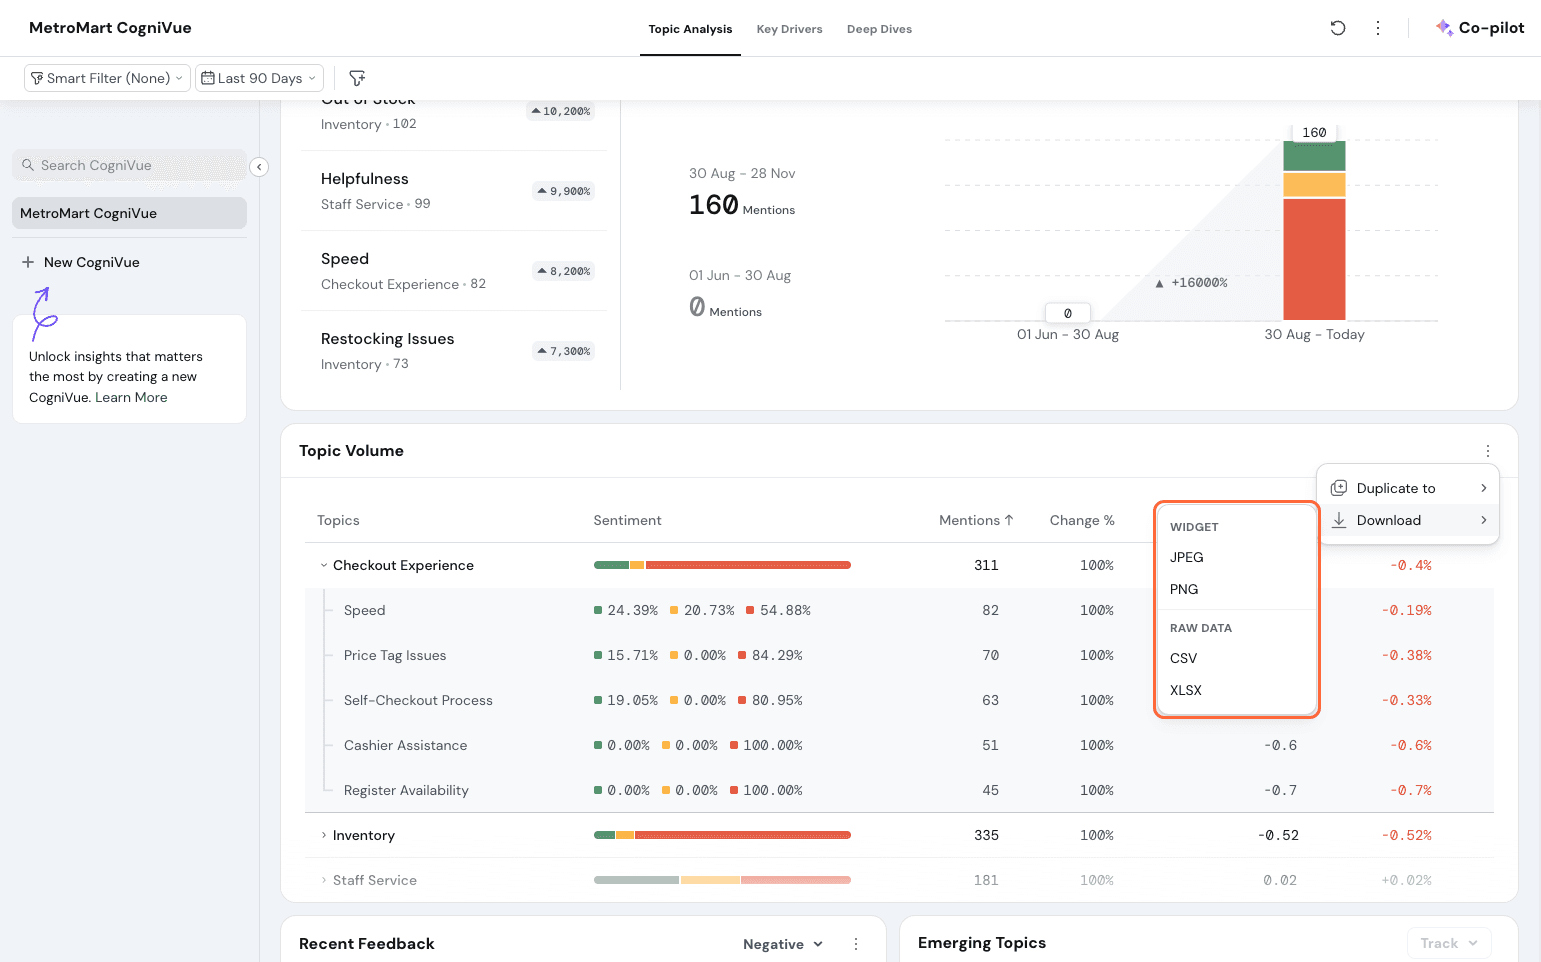
Click on the 3 dots on the widget. Here, let’s export Topic Volume.
Click on Download and choose from the options.
Key Drivers
This section paints a clear picture of what is driving your customer experience (CX) metrics. It visually highlights the specific topics and feedback patterns in your customer comments that are dragging down your score. This allows you to prioritize your efforts and address the root causes impacting customer satisfaction. Key Drivers are designed for strategic insights, so they refresh once every 30 days.
Calculation
Let’s understand how this is calculated first.
The Key Drivers are identified based on two criteria: Importance and Sentiment.
Sentiment for a topic is calculated by taking the sum of all sentiment instance scores and dividing it by the total instances. Values will range from -1 to 1, -1 being the most negative and 1 being the most positive. The value is determined by the severity of the responses.
So, in the case of MetroMart, feedback with ‘the quality of the product was poor’ could be -0.3, whereas ‘this is the worst shopping experience I’ve had’ could be -0.9.
Importance is calculated to determine its influence on the CX Metric - in this case, let’s take NPS. Importance is calculated on a scale of 0 to 1. Each topic will get a value from 0 to 1. A topic getting a score of 1 means that the topic has a very high impact on your NPS, and a topic getting 0 means it's not influencing your NPS score in any way.
When it comes to sub-topics, we calculate the importance of sub-topics against the main topic and then factor in the importance of the main topic against the CX metric.
So let’s take Topic A has an importance of 0.3, and its sub-topic A1 has an importance of 0.7. If you were to look at the importance of A1 to the NPS score, it would be 0.7*0.3 = 0.21.
This way, all sub-topics are computed for you to understand their importance on the CX metric in question.
Summary
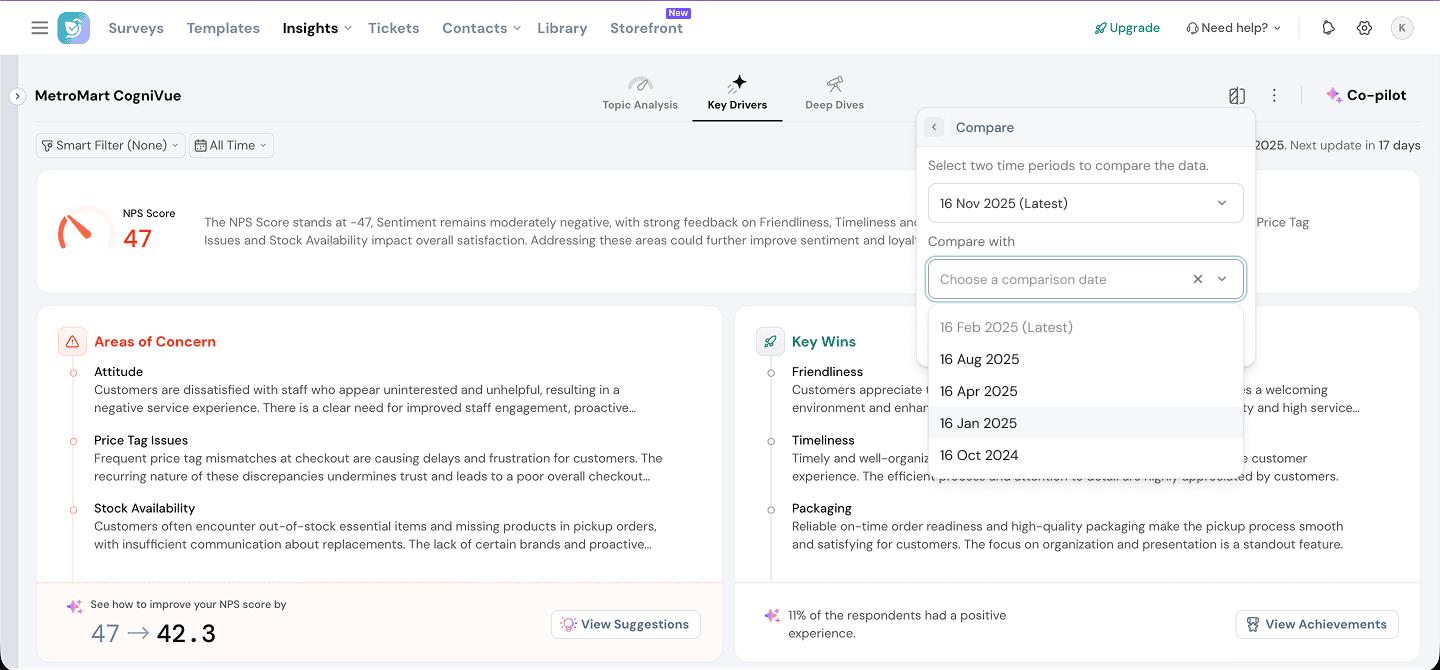
This widget offers a summary of your CX Metric based on the date range and filters applied. This covers the change in outcome metric, overall sentiment, key areas of concern, key wins, and topics to act on immediately. Here, you can see the summary of MetroMart’s NPS. 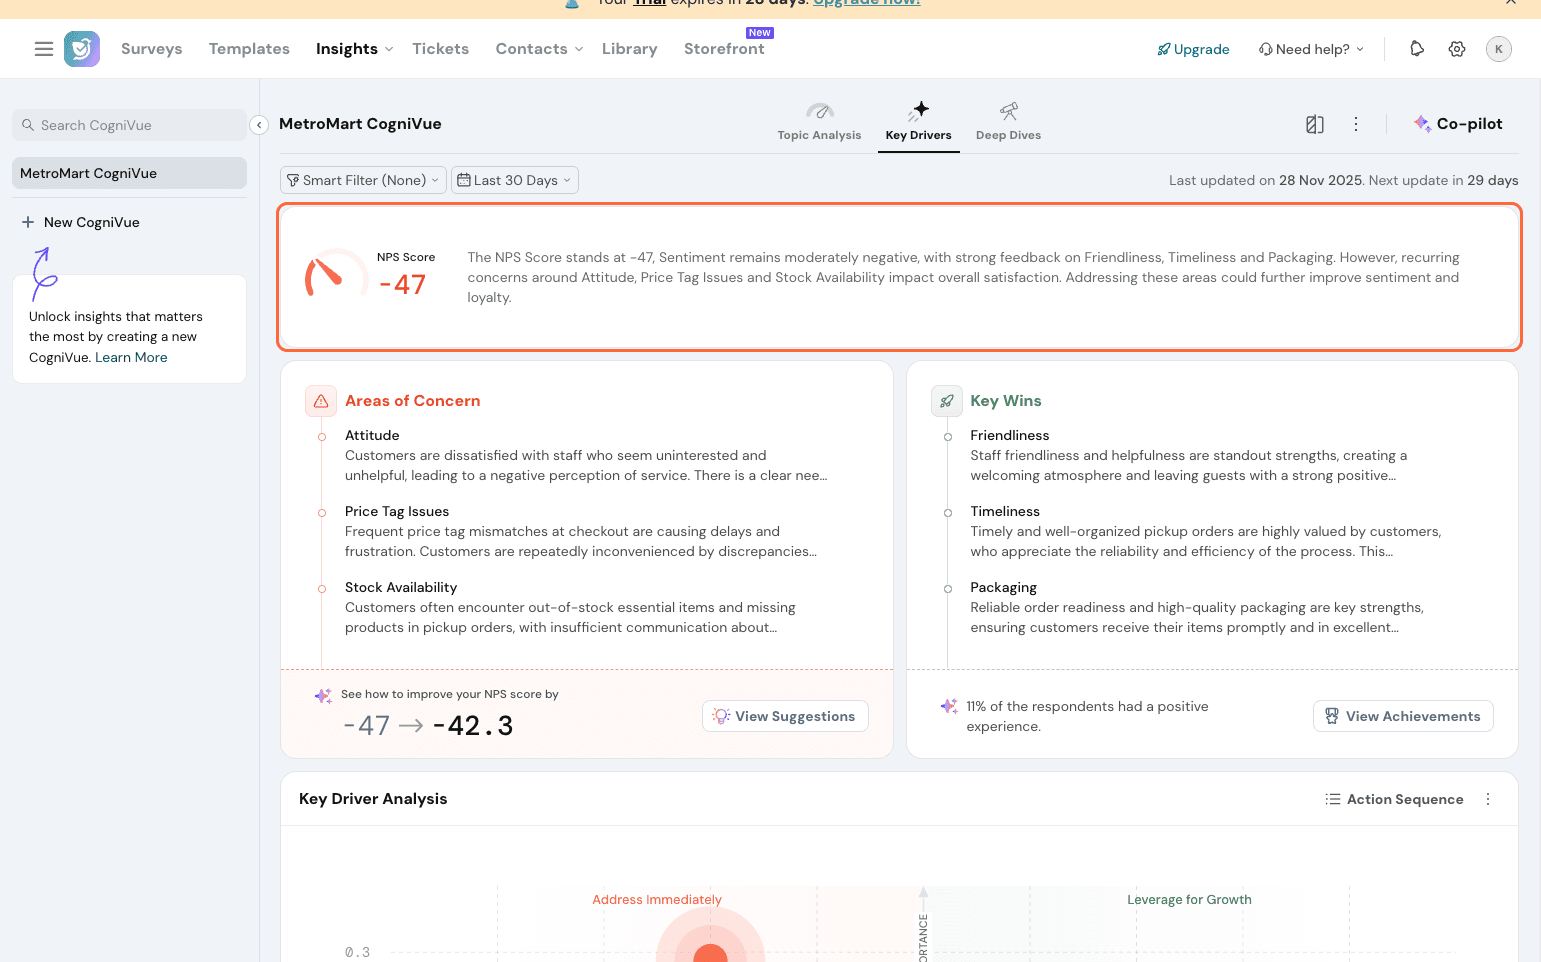
Areas of Concern
This plots the top 3 sub-topics that users need to improve on, along with a summary of the sub-topic.
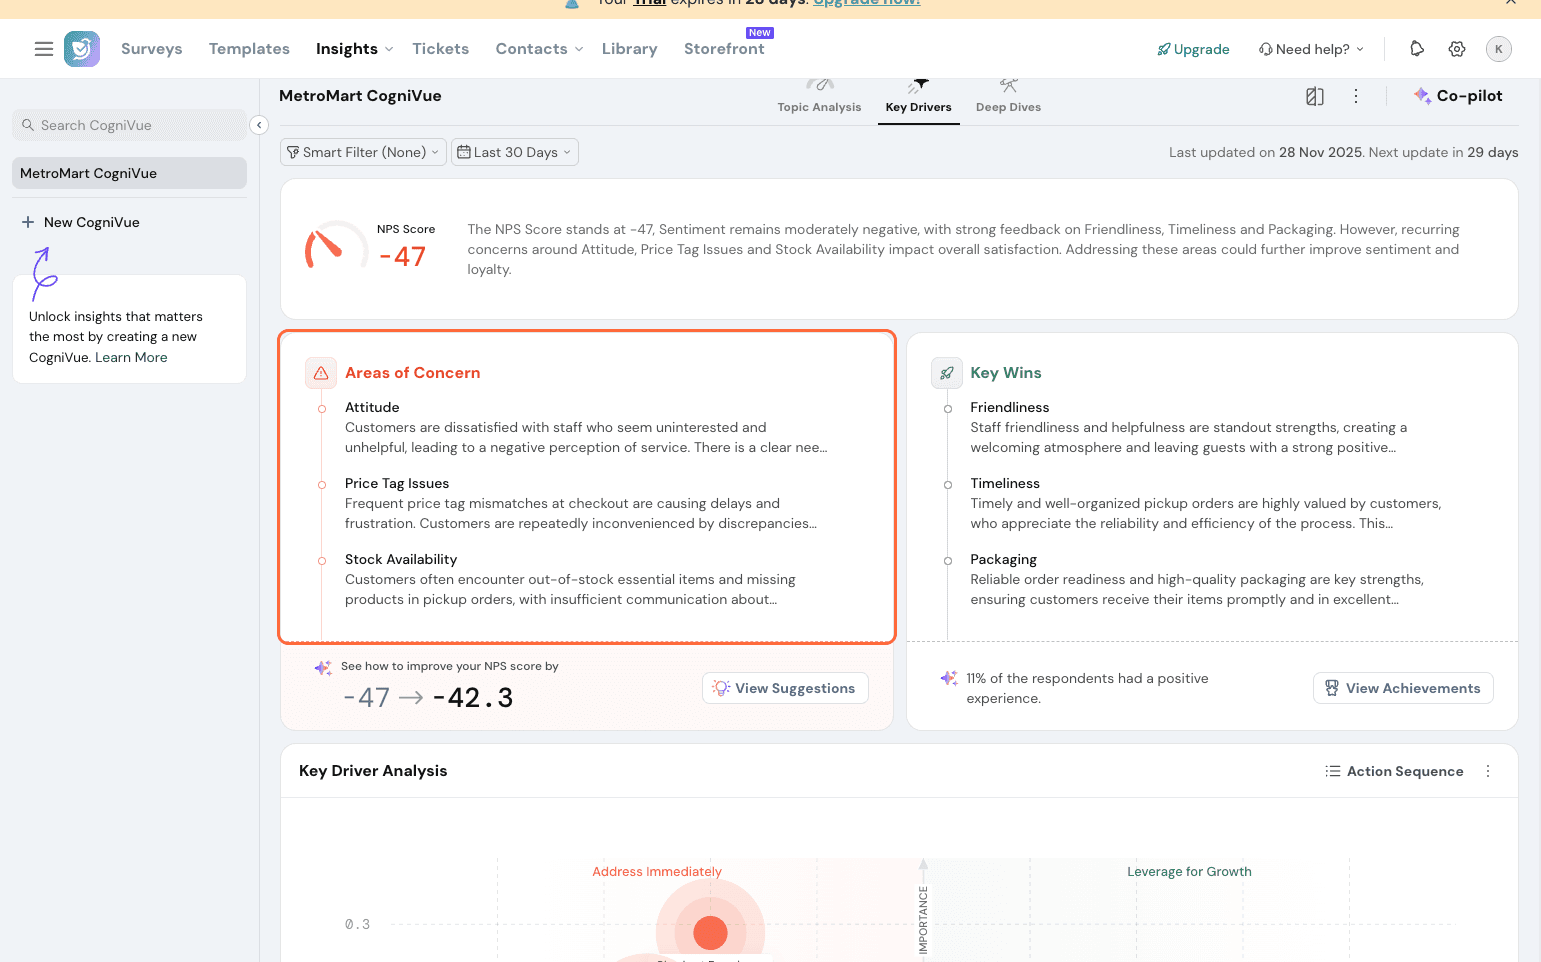
In case no sub-topic has a negative sentiment, it picks the sub-topic with the least positive sentiment.
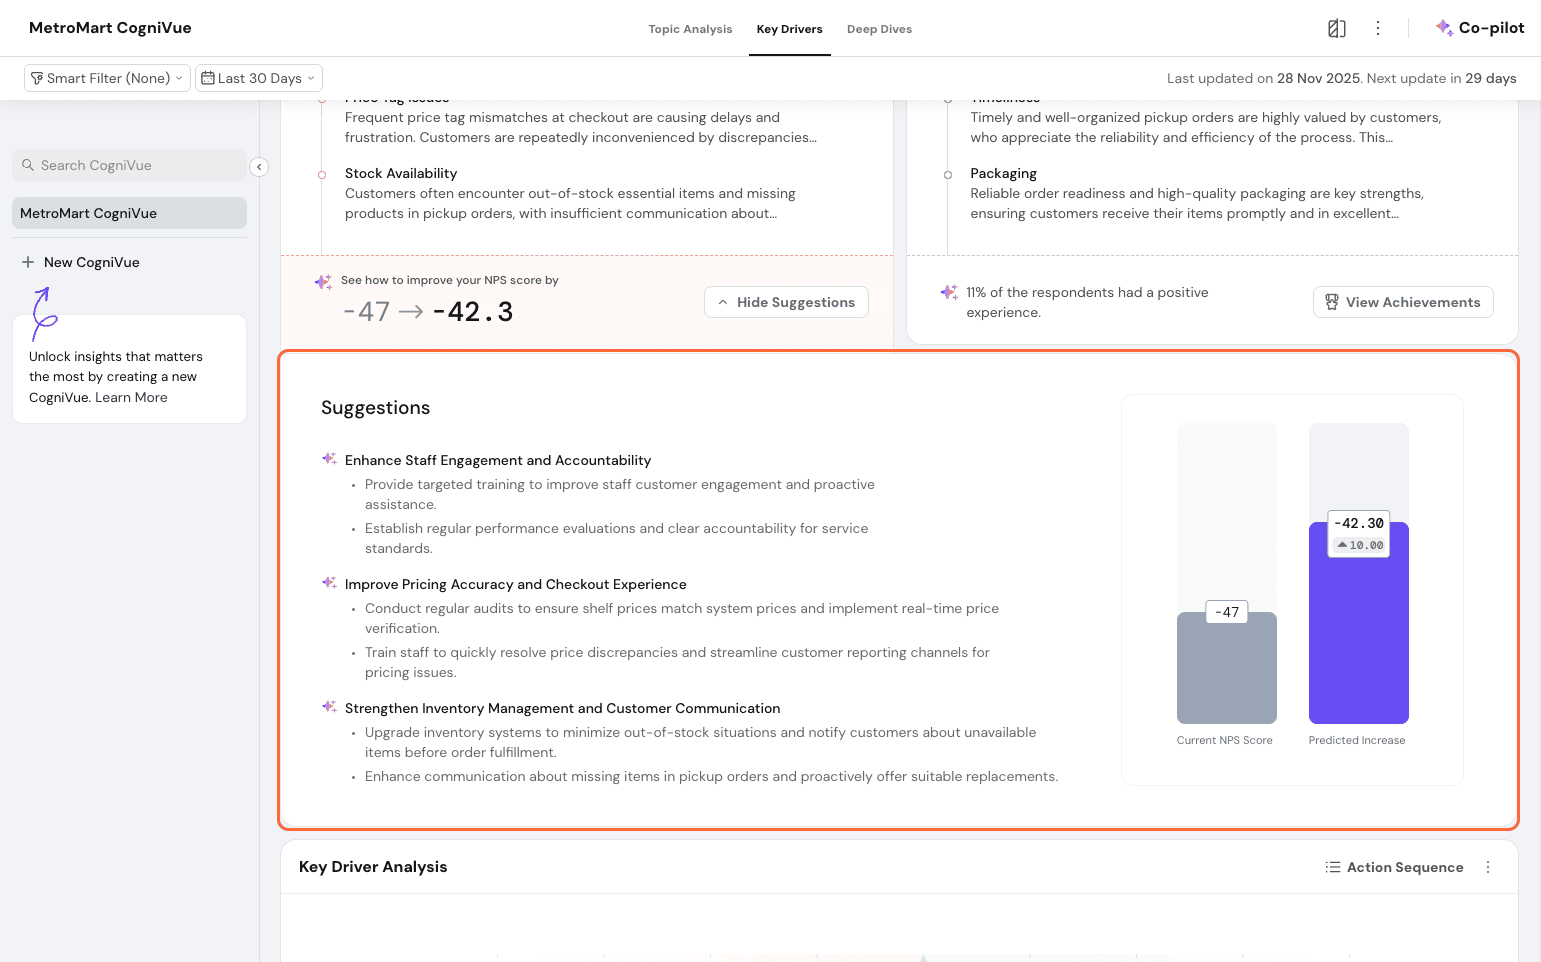
This also has the option to offer suggestions to improve your CX metric by a quantifiable %. Here, it is ready to suggest how to improve NPS by 5 points.
Click on View Suggestions. Note that this consumes AI credits.
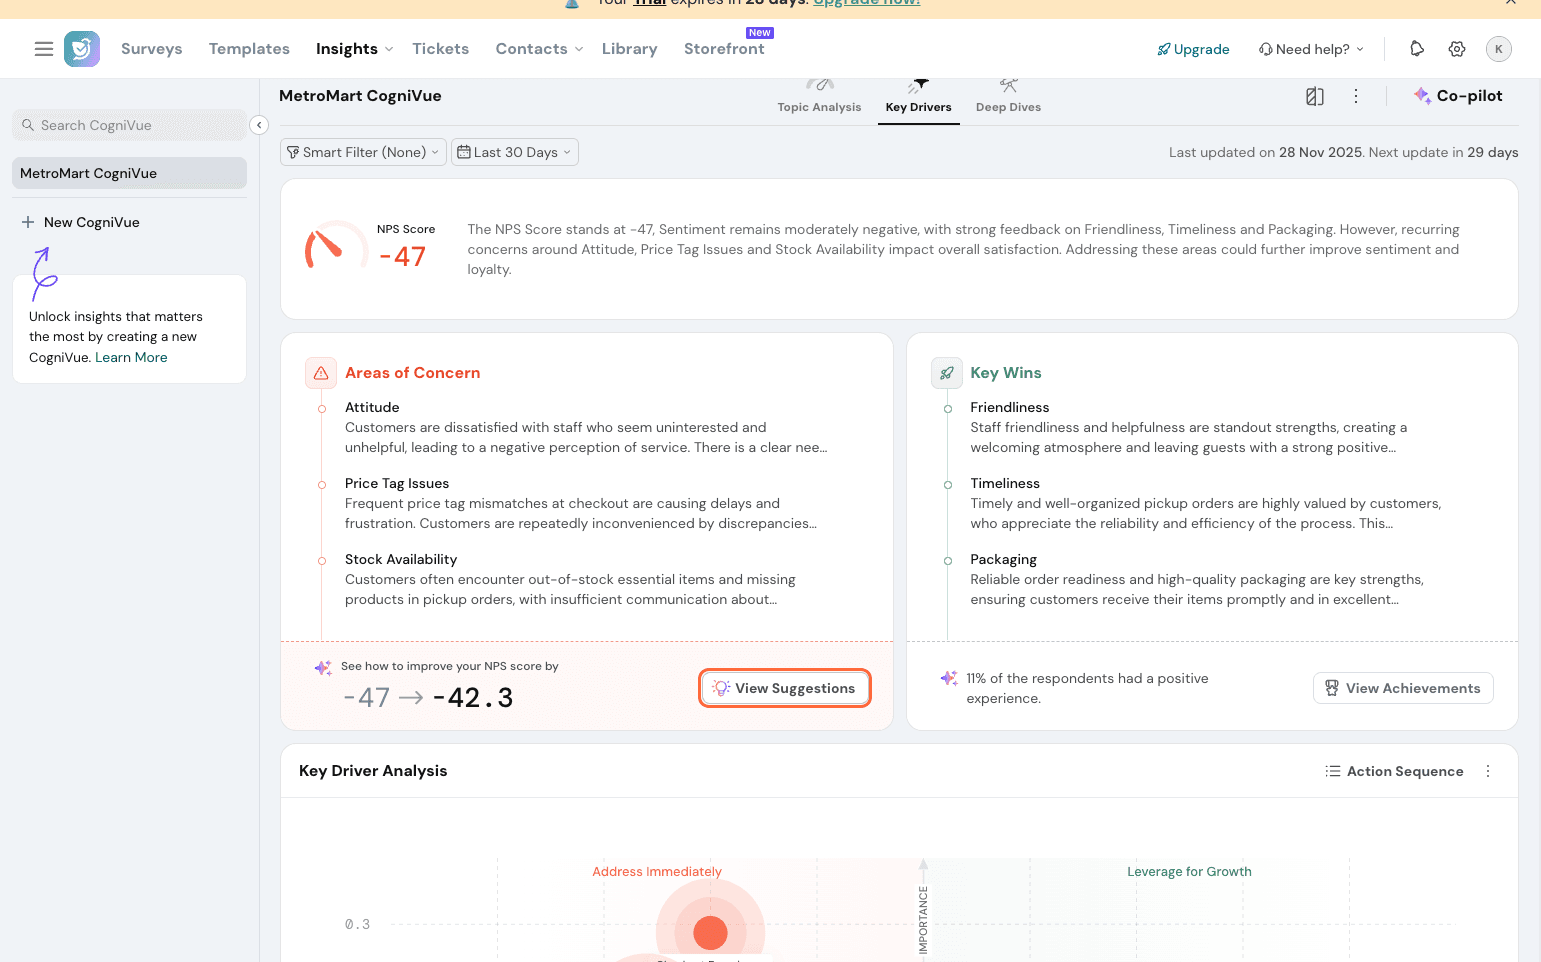
Once clicked, it gives actionable suggestions to implement and try out.
Key Wins
This shows the top 3 sub-topics that have high sentiment performance, along with a summary of the sub-topic.
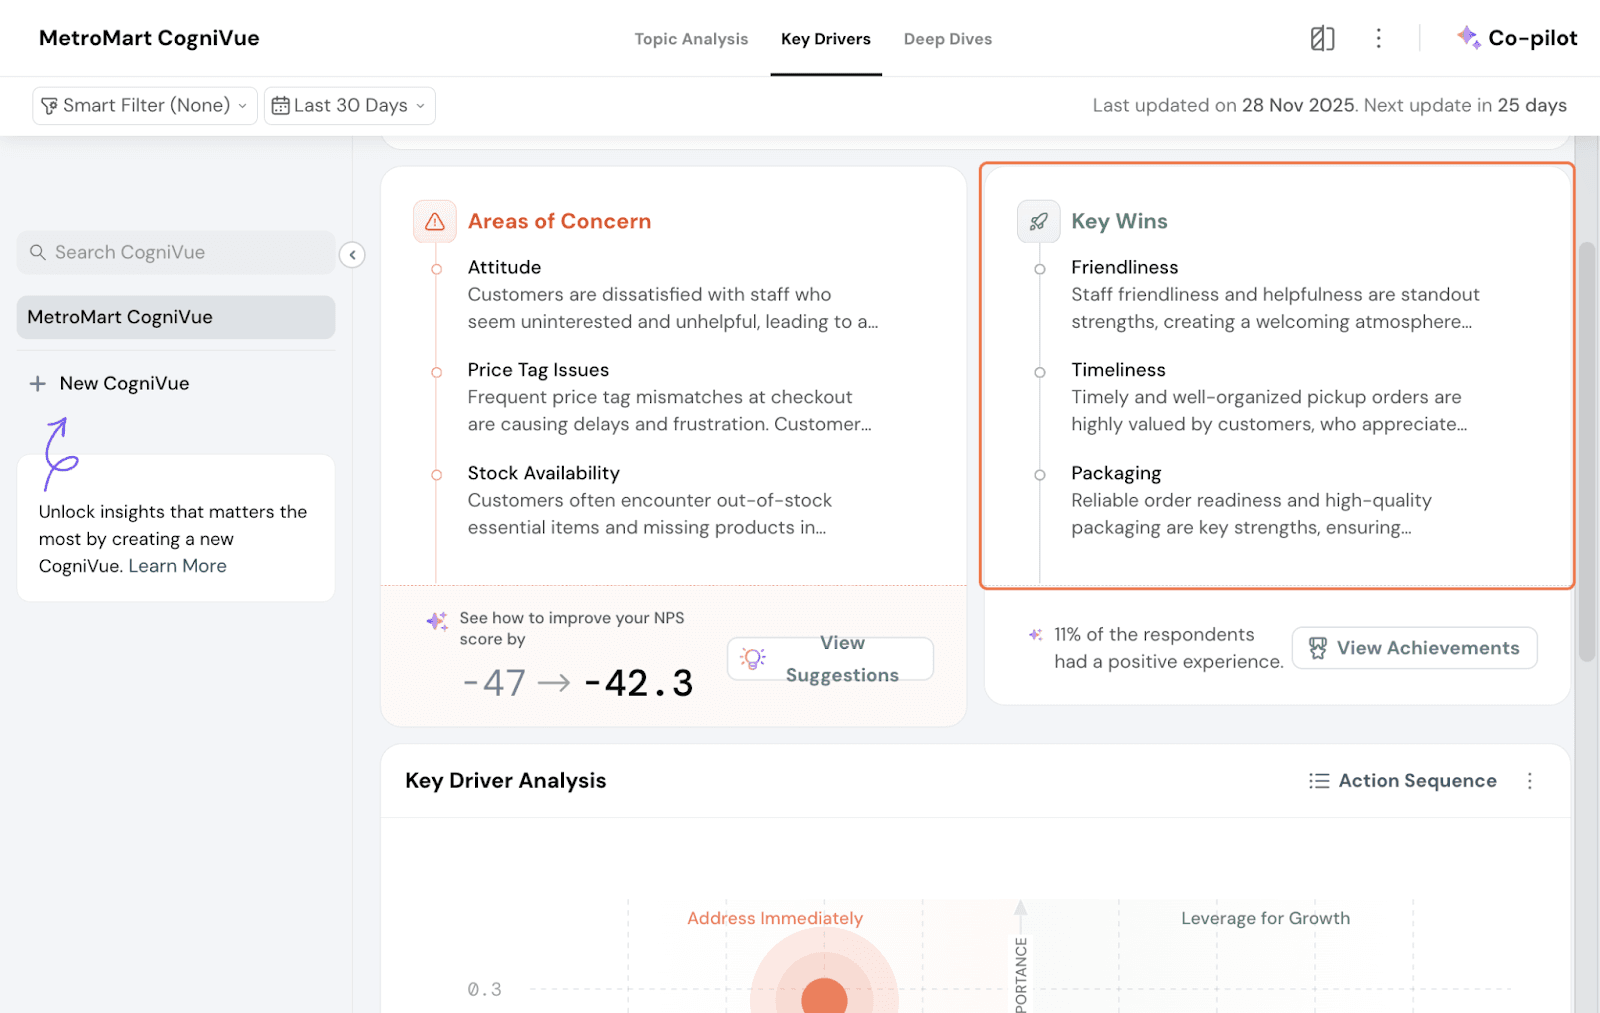
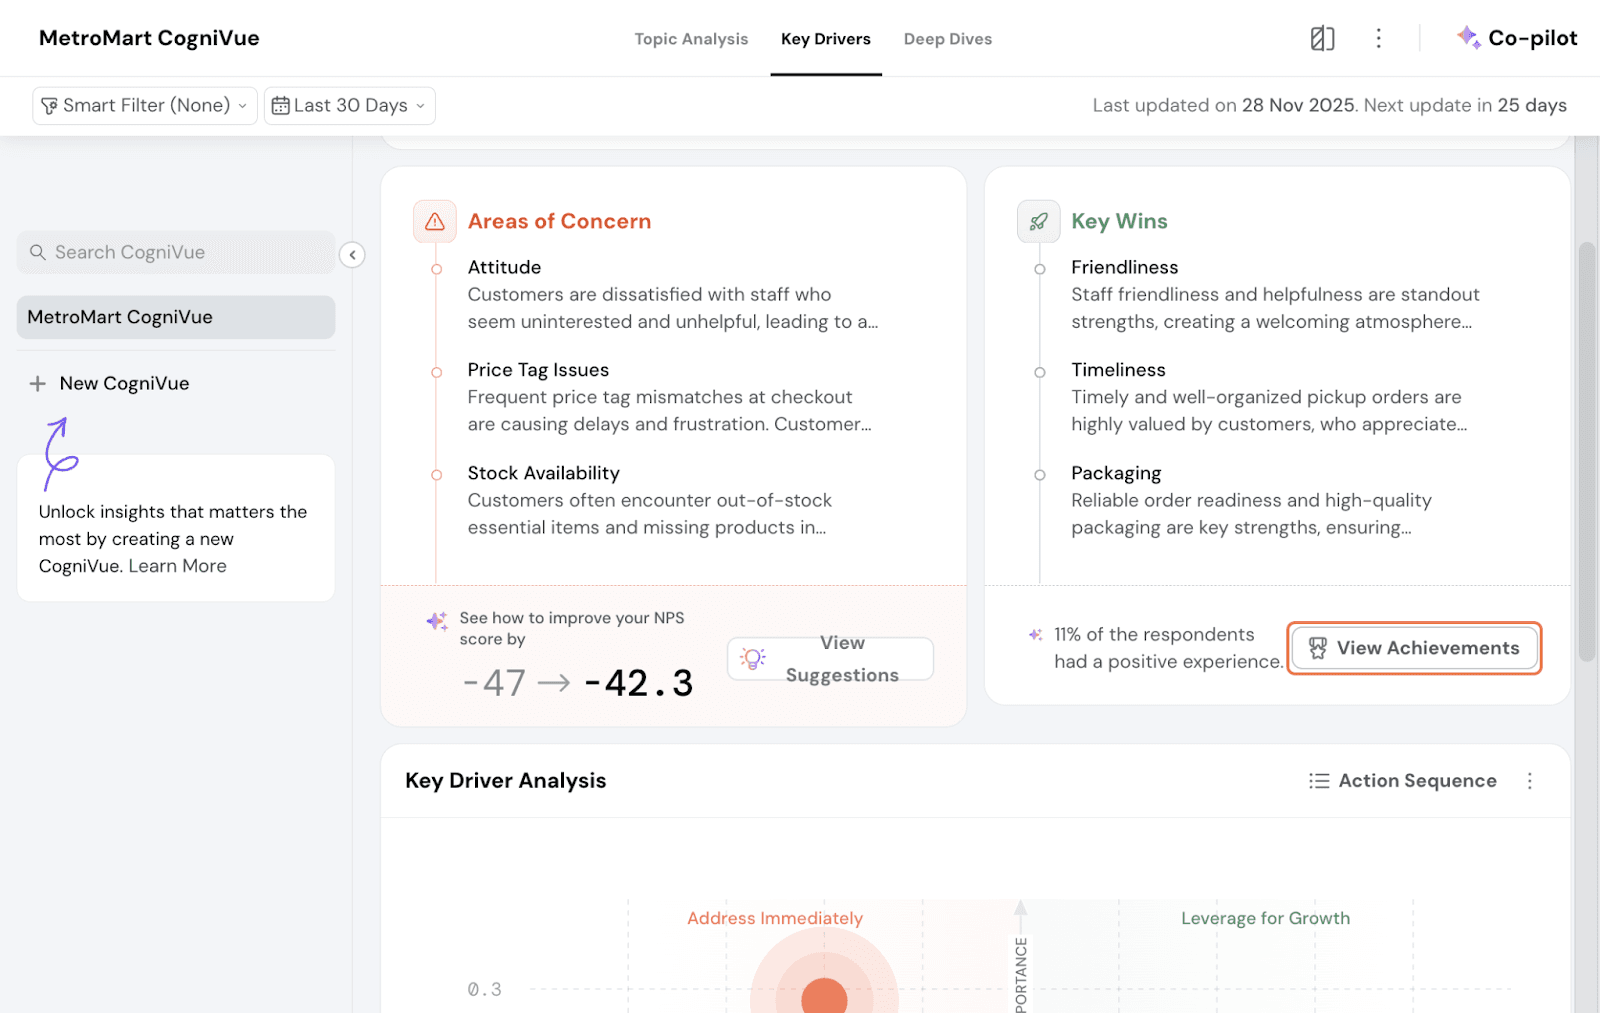
This has the option to view achievements. You have the % of happy customers shown numerically as well.
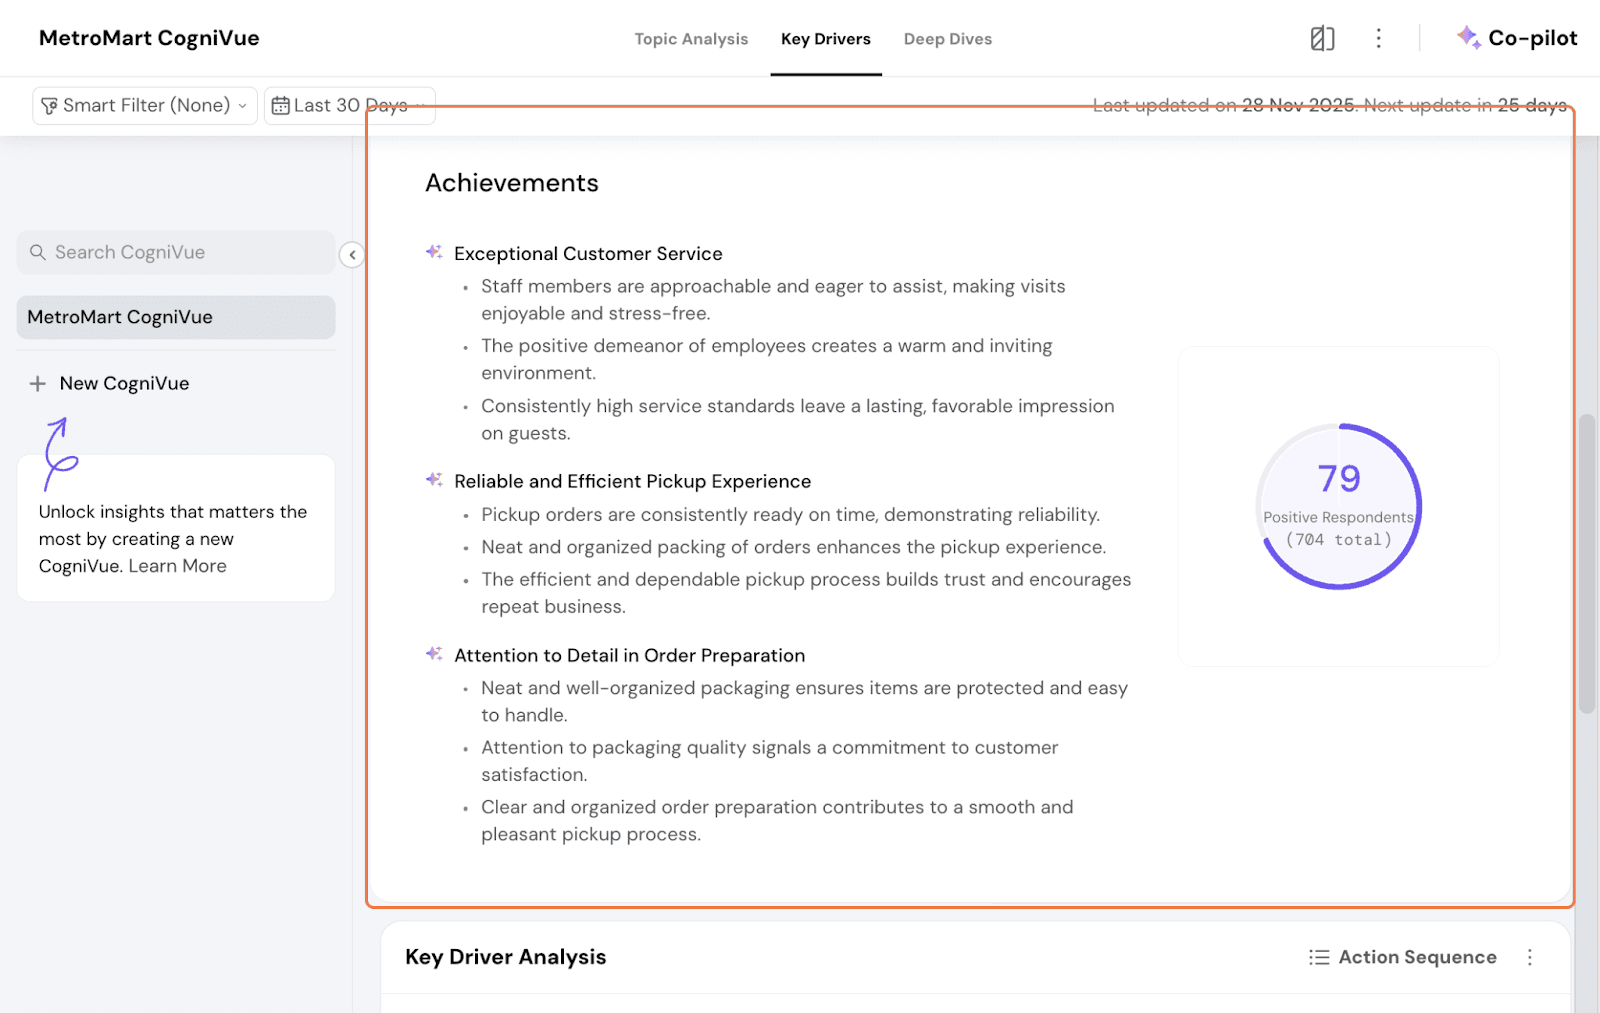
When clicked, it expands and elaborates on the specific achievements of the sub-topics.
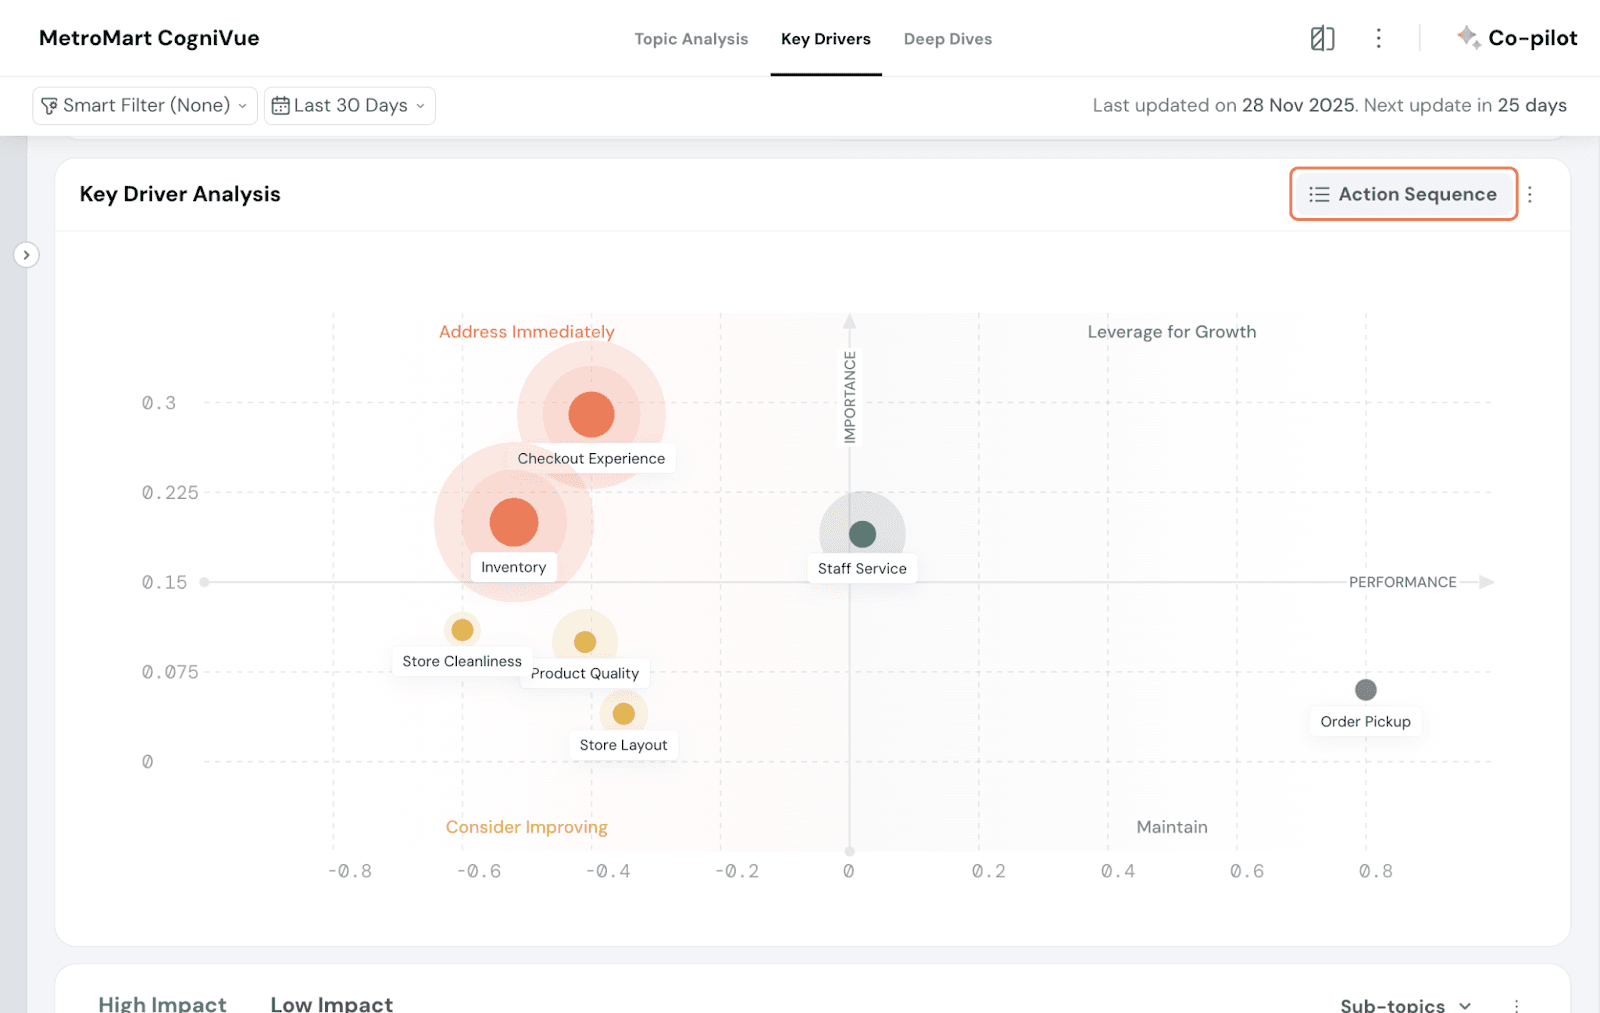
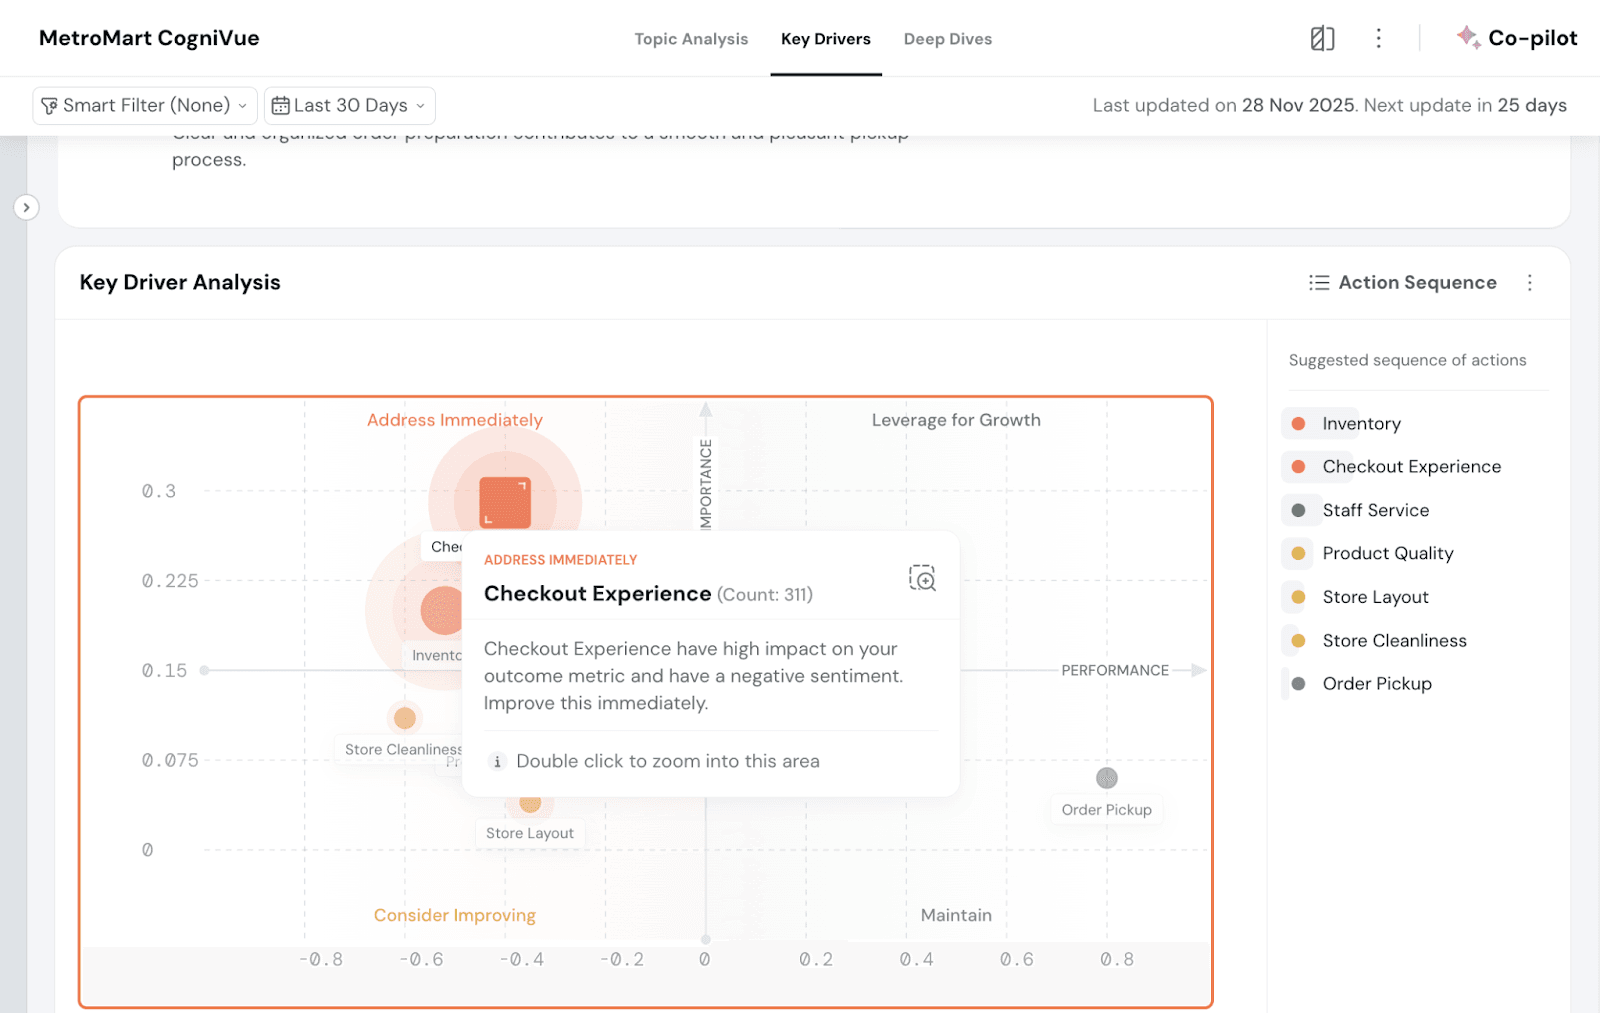
Key Driver Widget
This widget has four quadrants that convey how a particular topic ranks in terms of importance and performance. The axes are labeled Performance, which measures the sentiment, and Impact, which measures the importance.
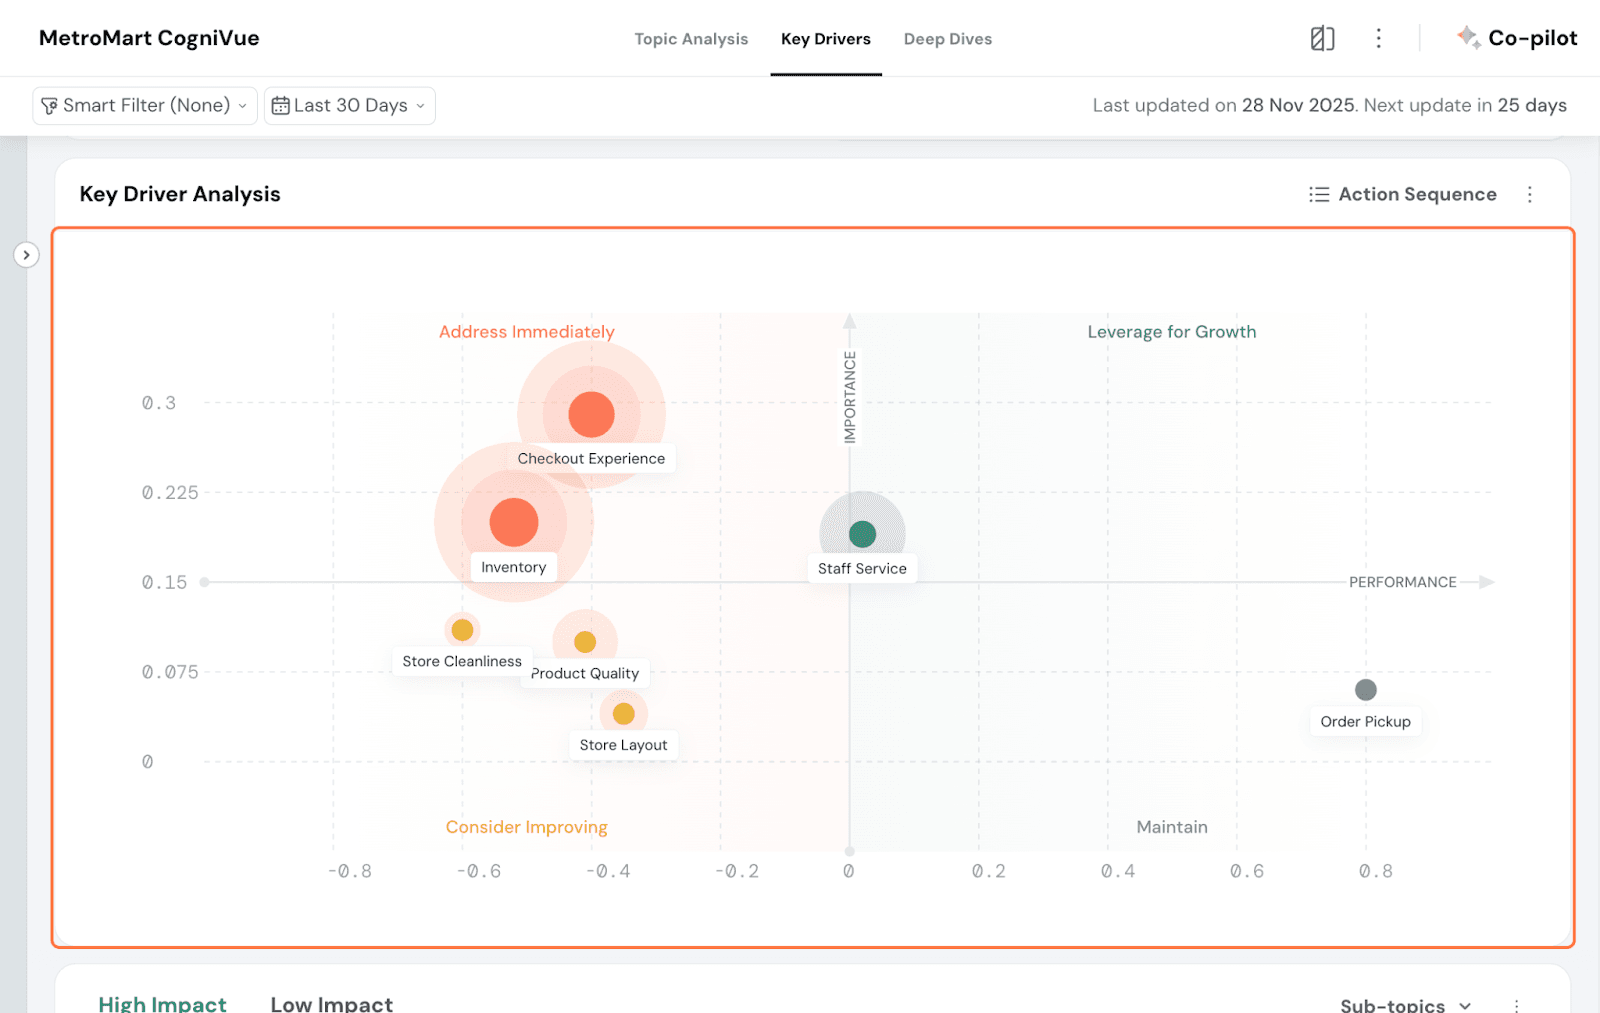
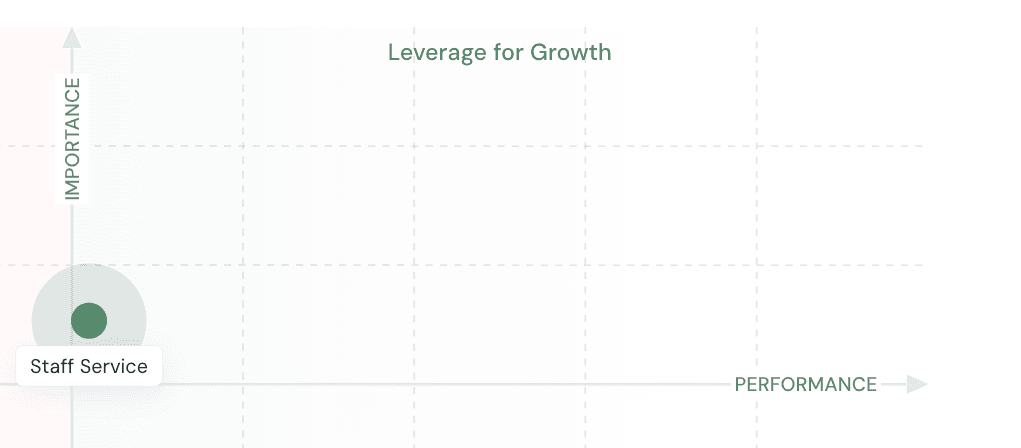
Leverage for Growth: This is the top quadrant, which pinpoints topics that have high performance as well as importance scores. That is to say, topics here are felt positively by customers, and they also have a significant impact on your NPS. Here, Staff Service is such a topic for MetroMart.
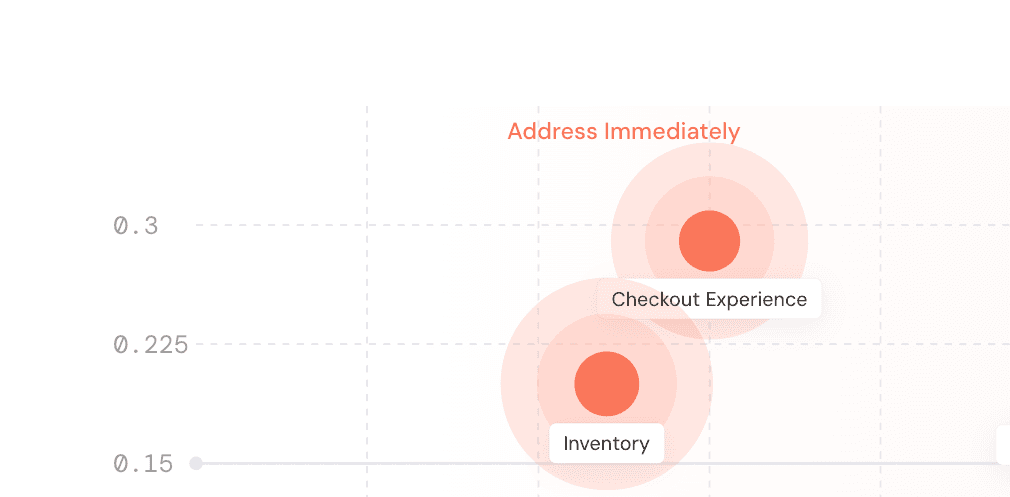
Address Immediately:
This is the top left quadrant that shows topics that have a high impact on the NPS and have a negative sentiment. These are areas for improvement that must be acted upon immediately. Getting these scores up will also raise your overall NPS.
Here, we can see that Checkout Experience and Inventory are topics that MetroMart needs to act on immediately.
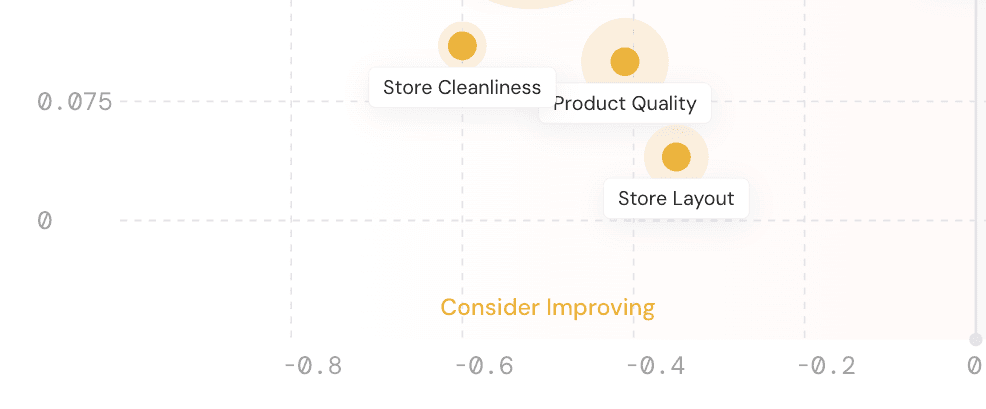
Consider Improving: This is the bottom left quadrant, which shows topics that have a negative sentiment but don’t have a significant impact on your NPS. These encompass areas to make a note of for improvement, but can be prioritized after sorting critical issues.
Maintain: This is the bottom right quadrant, which shows topics that have a positive sentiment and low impact on your NPS. Topic bubbles here are grey in color.
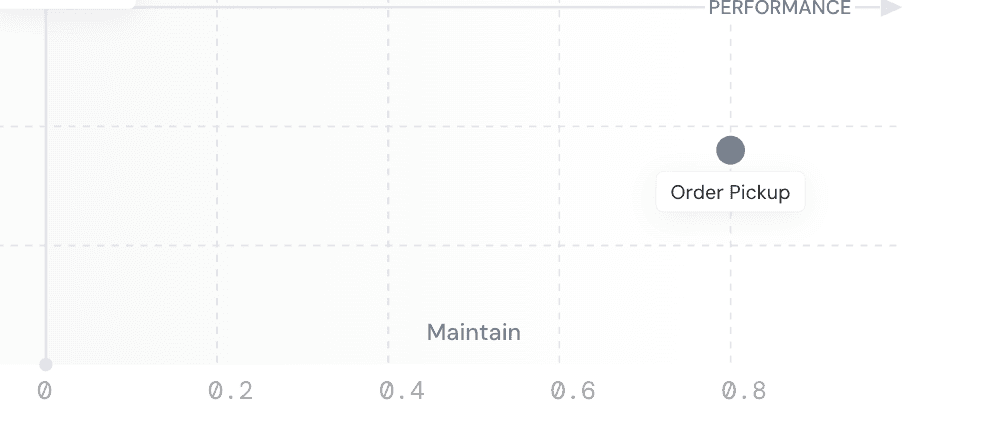
Result:
Each topic appears as a bubble on the chart. The size of the bubble reflects how often that topic was mentioned by customers.
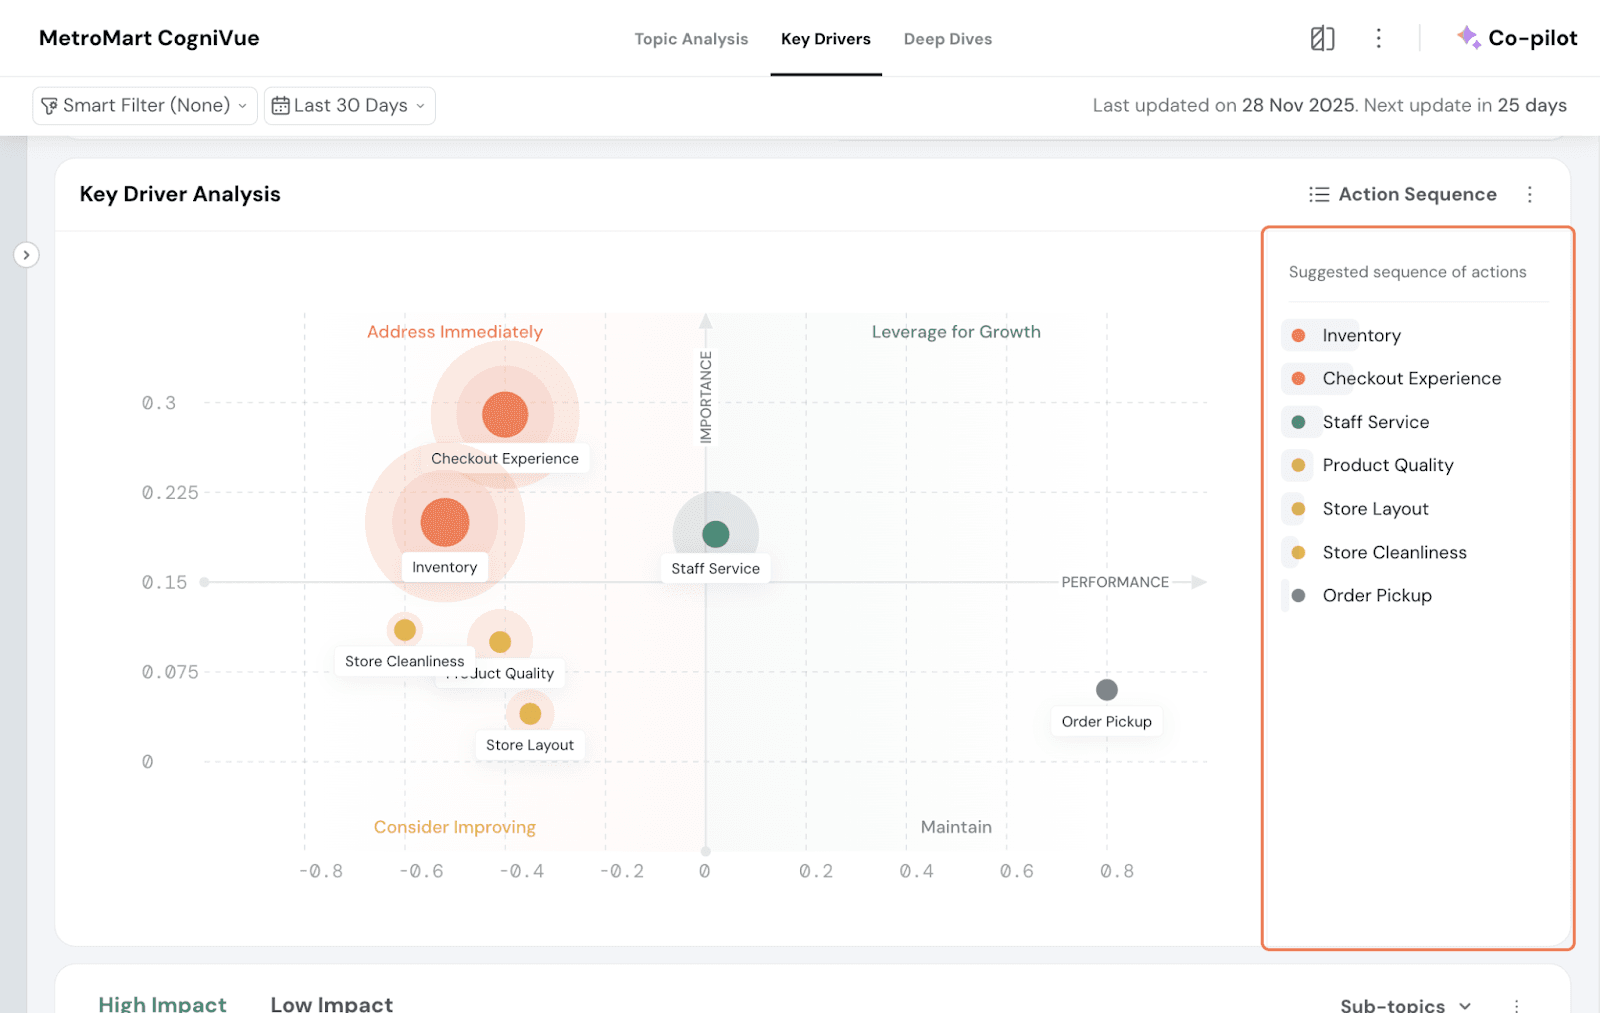
Action Sequence
In the Key Driver Analysis widget, you will find Action Sequence on the right side. Click on it.
Once you click on it, you get a list of the suggested order of action, pointing out what needs to be addressed first and prioritized. This plots and lists the sub-topics to focus on.
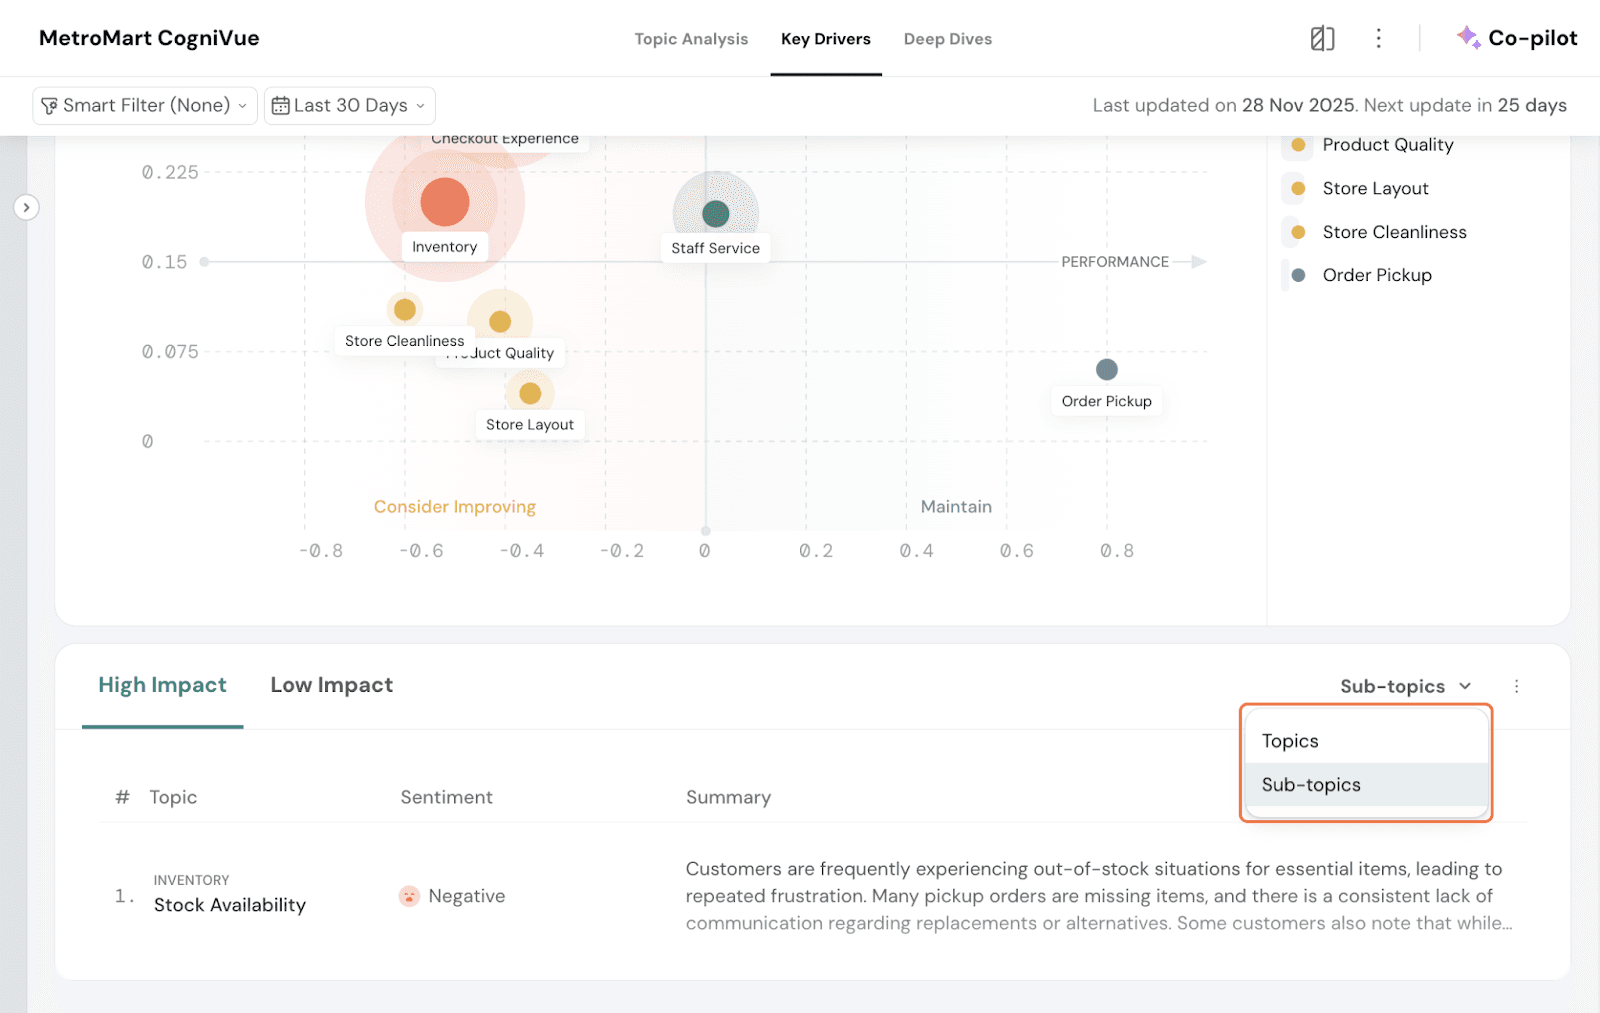
Summaries
This shows the summary of every sub-topic. They get grouped in terms of importance: you will find sub-topics of high importance under the “High Impact” tab. Simply put, the sub-topics on the top half of the quadrant get put under High Impact, and the ones in the bottom half get put under Low Impact.
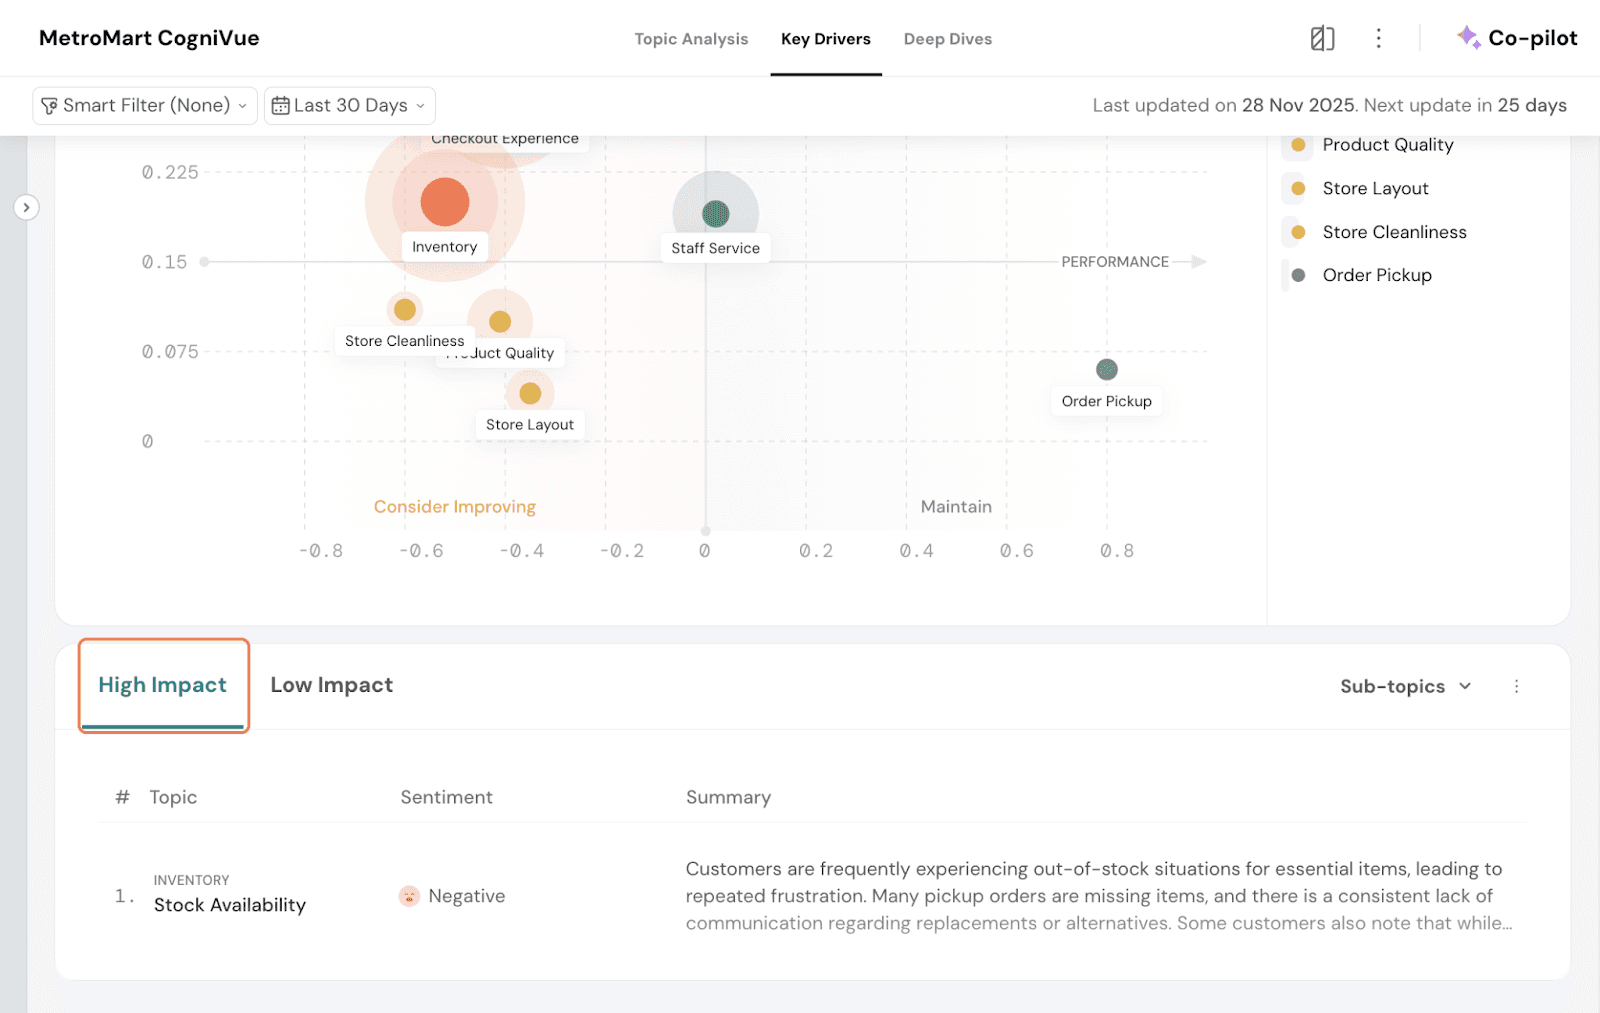
Sub-topics are chosen by default; you can choose to switch them to topics as well.
Topic Drill Down
You can do a deeper analysis of the feedback received right from your CogniVue. To understand the specific concerns of customers under each topic, you can drill down.
Simply click on each topic bubble. Let’s drill down further into the Checkout Experience topic here.
The Key Driver drills down a level further and shows the position of the subtopics along the quadrant.
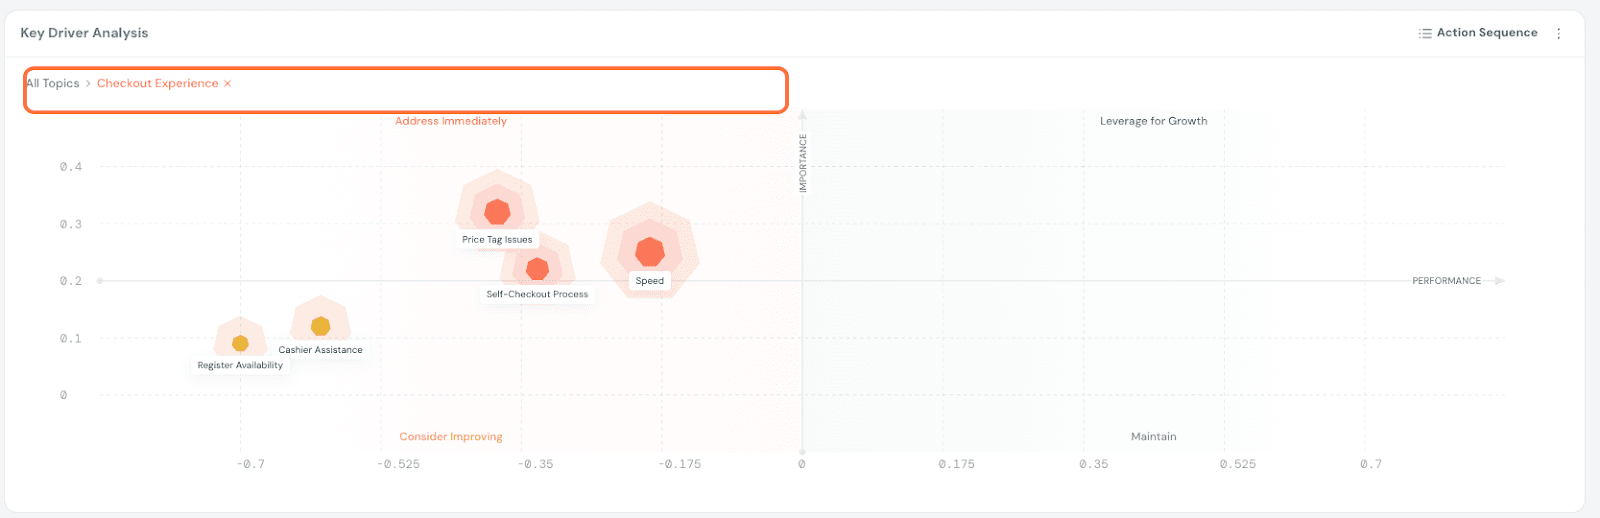
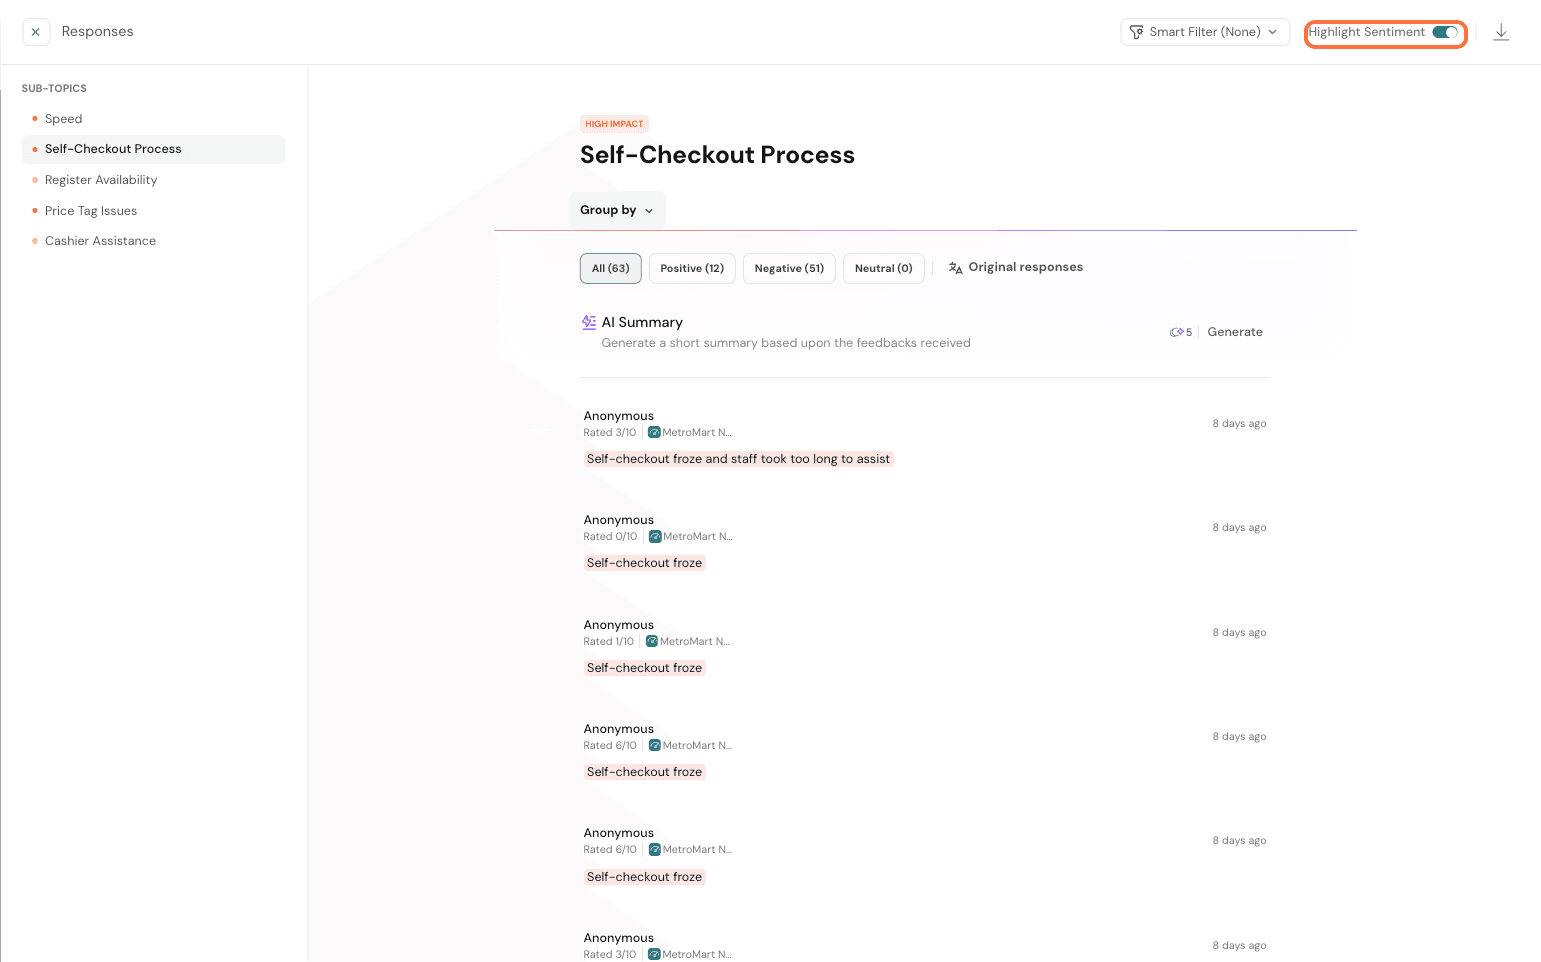
You can click on a topic bubble here to drill down to the individual responses. Let’s check out the Self-Checkout Process.
The window above lists the individual responses related to the topic. You can access other subtopics linked to the main topic by using the left navigation, which lists the other subtopics.
The individual responses can be further filtered in terms of sentiment. You can click on the top nav options within the window to see all feedback with only positive, negative, or neutral sentiments.
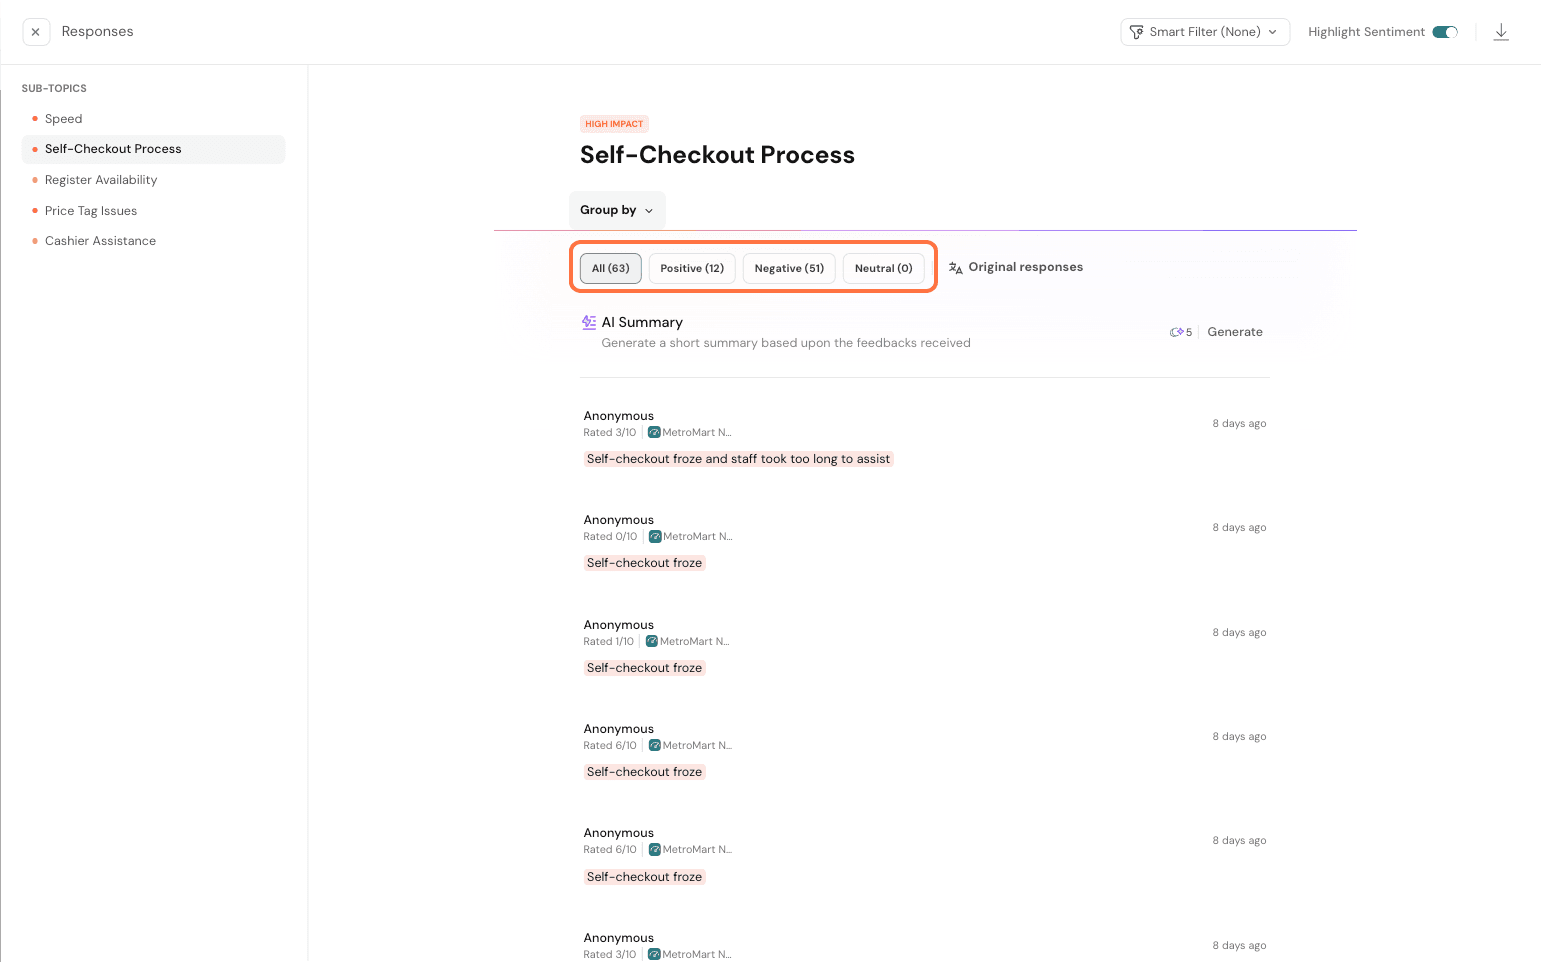
You also get your segment filters in here. If any filter is applied to the CogniVue, it gets reflected inside as well. Check it out under Smart Filters.
You can click on the toggle ‘Highlight Sentiment’ in the top right corner to have the sentiment highlighted in individual feedback. This makes it easy to track sentiments visually.
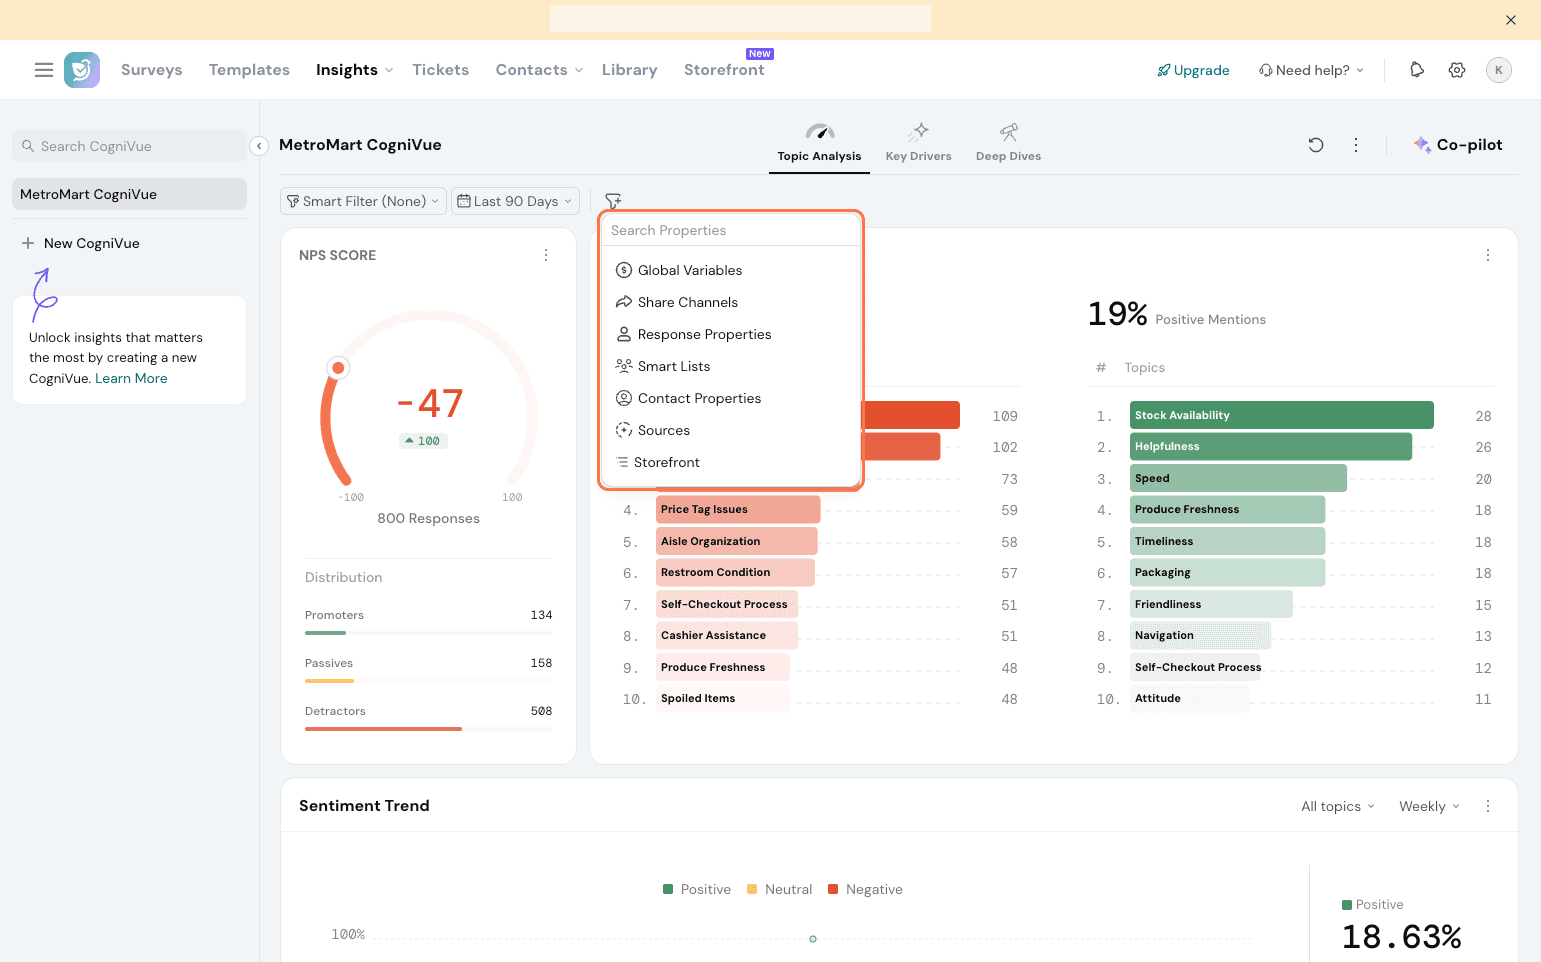
You can group your feedback by categories. Click on Group by
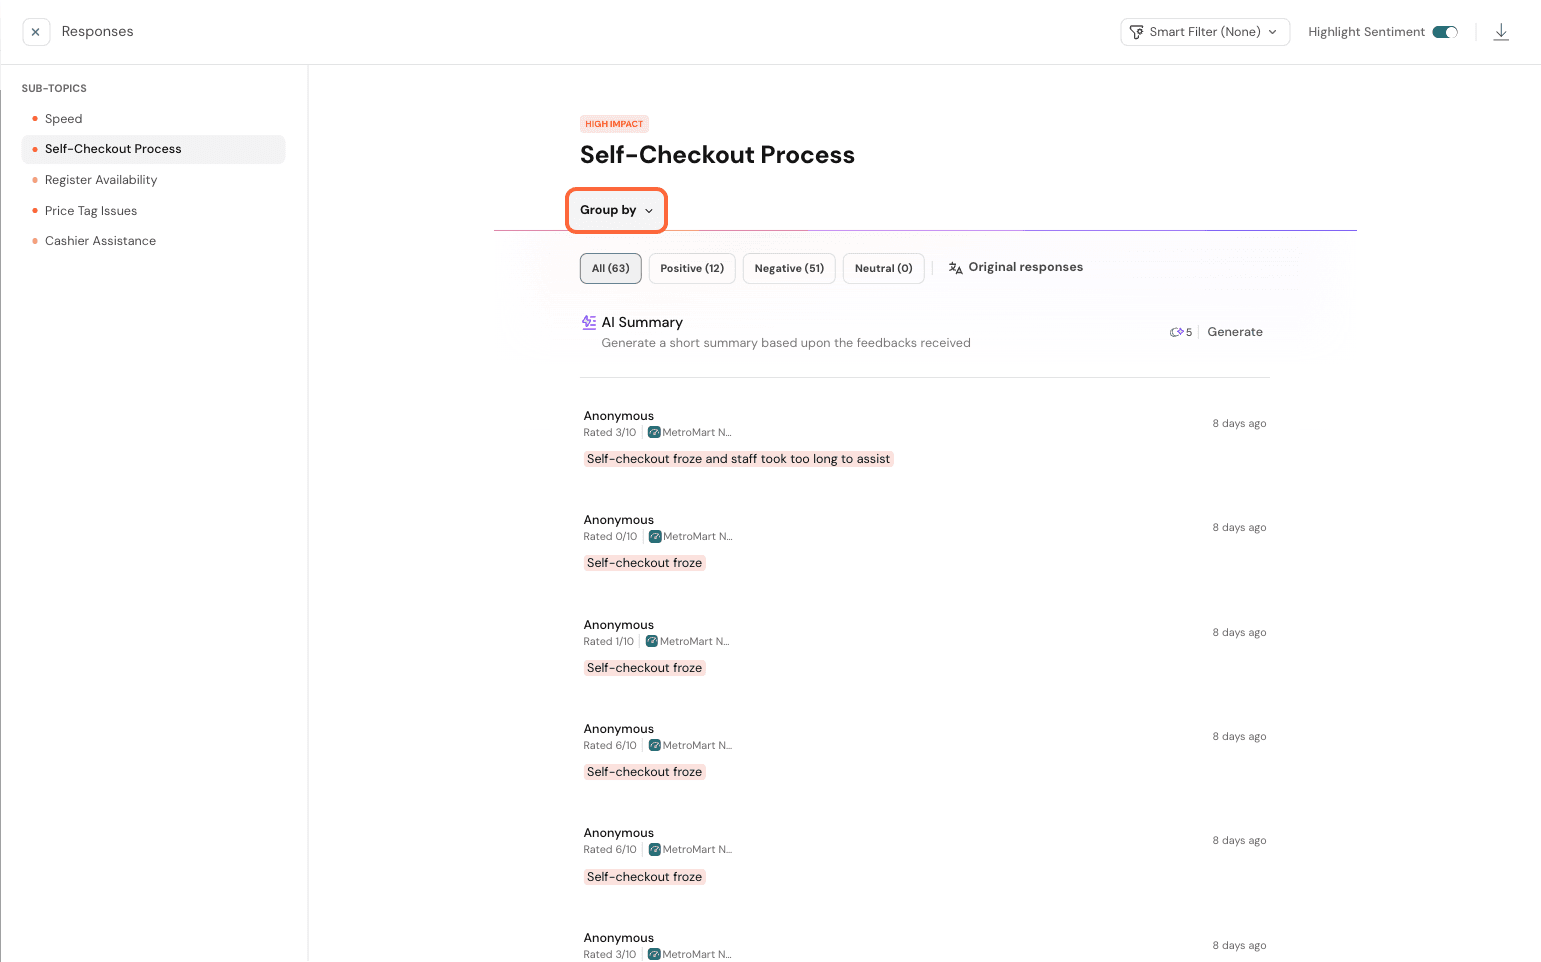
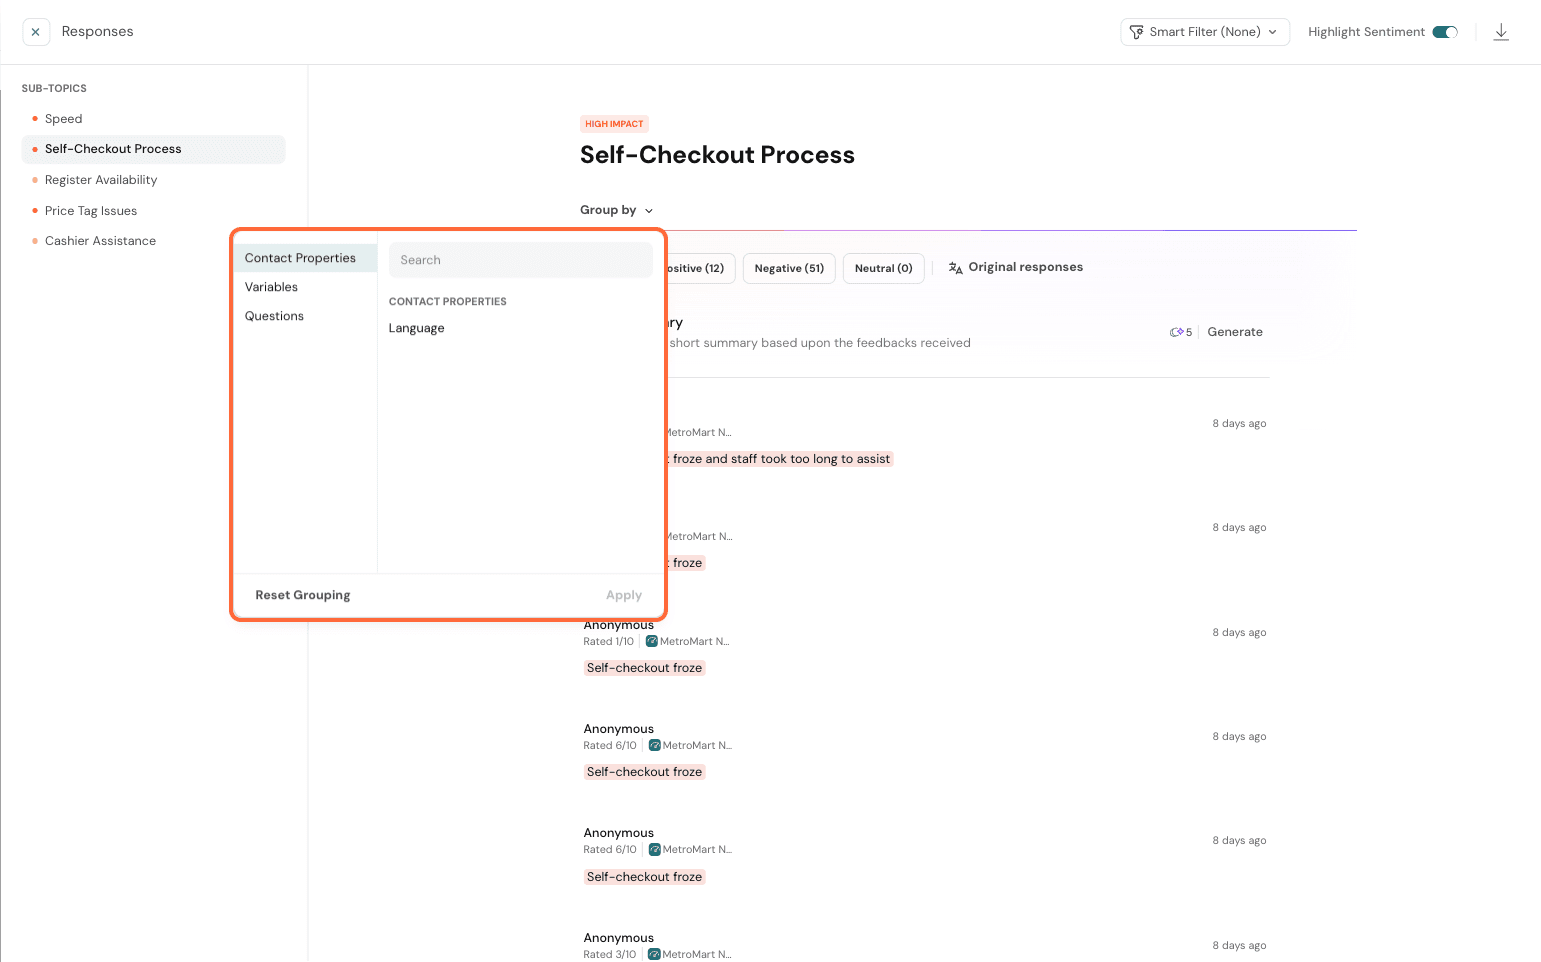
Now, select from any of the properties available:
- Variables
- Response Properties
- Share Channels
- Smart Lists
- Sources (if multi-source CogniVue)
- Question and Answer (if single source CogniVue)
- Platforms (Reviews)
- Locations (Reviews)
Here, only some properties get shown since a survey is chosen as the source.
Click on Translate responses to have your responses translated into your preferred language.
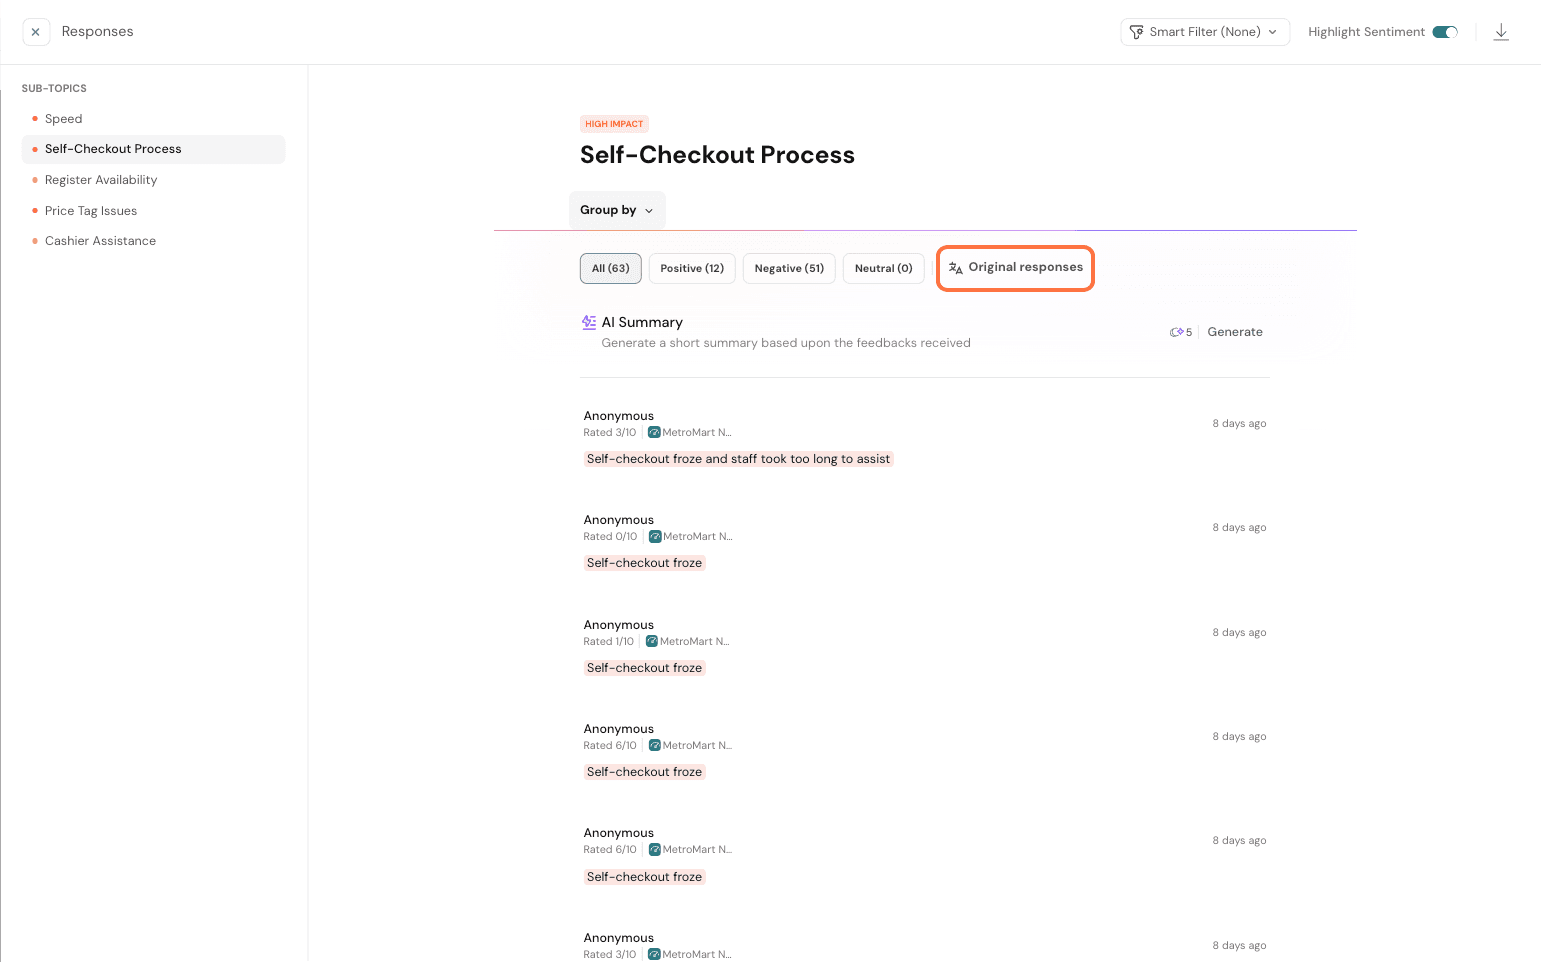
An AI Summary is available to be generated based on overall feedback or on the category. Click on Generate. Note that this will consume credits.
The topic drill-down can be accessed from the Topic Analysis section as well. Simply click on the subtopic name for this window to open and follow the same procedure explained above.
Note: When drilling down into a specific topic, the system analyzes all relevant feedback and highlights sentiment specifically for that topic. While the customer feedback might mention other topics like "Pricing," these won't be highlighted during the "Self-checkout Process" drill-down.
Key Driver-Specific Actions
Segment Creation
If you want Key Drivers generated for custom filters, you can choose to do so with the help of Segments.
Go to Settings and click on Key Driver Filters.
Here, you get to factor a combination of date range and Smart Filters saved to create a new custom combination to generate a Key Driver for. (Smart Filters explained in detail in a later section)
Let’s say you want a Key Driver applied only for your data in the past 90 days for your Detractors Filter already saved.
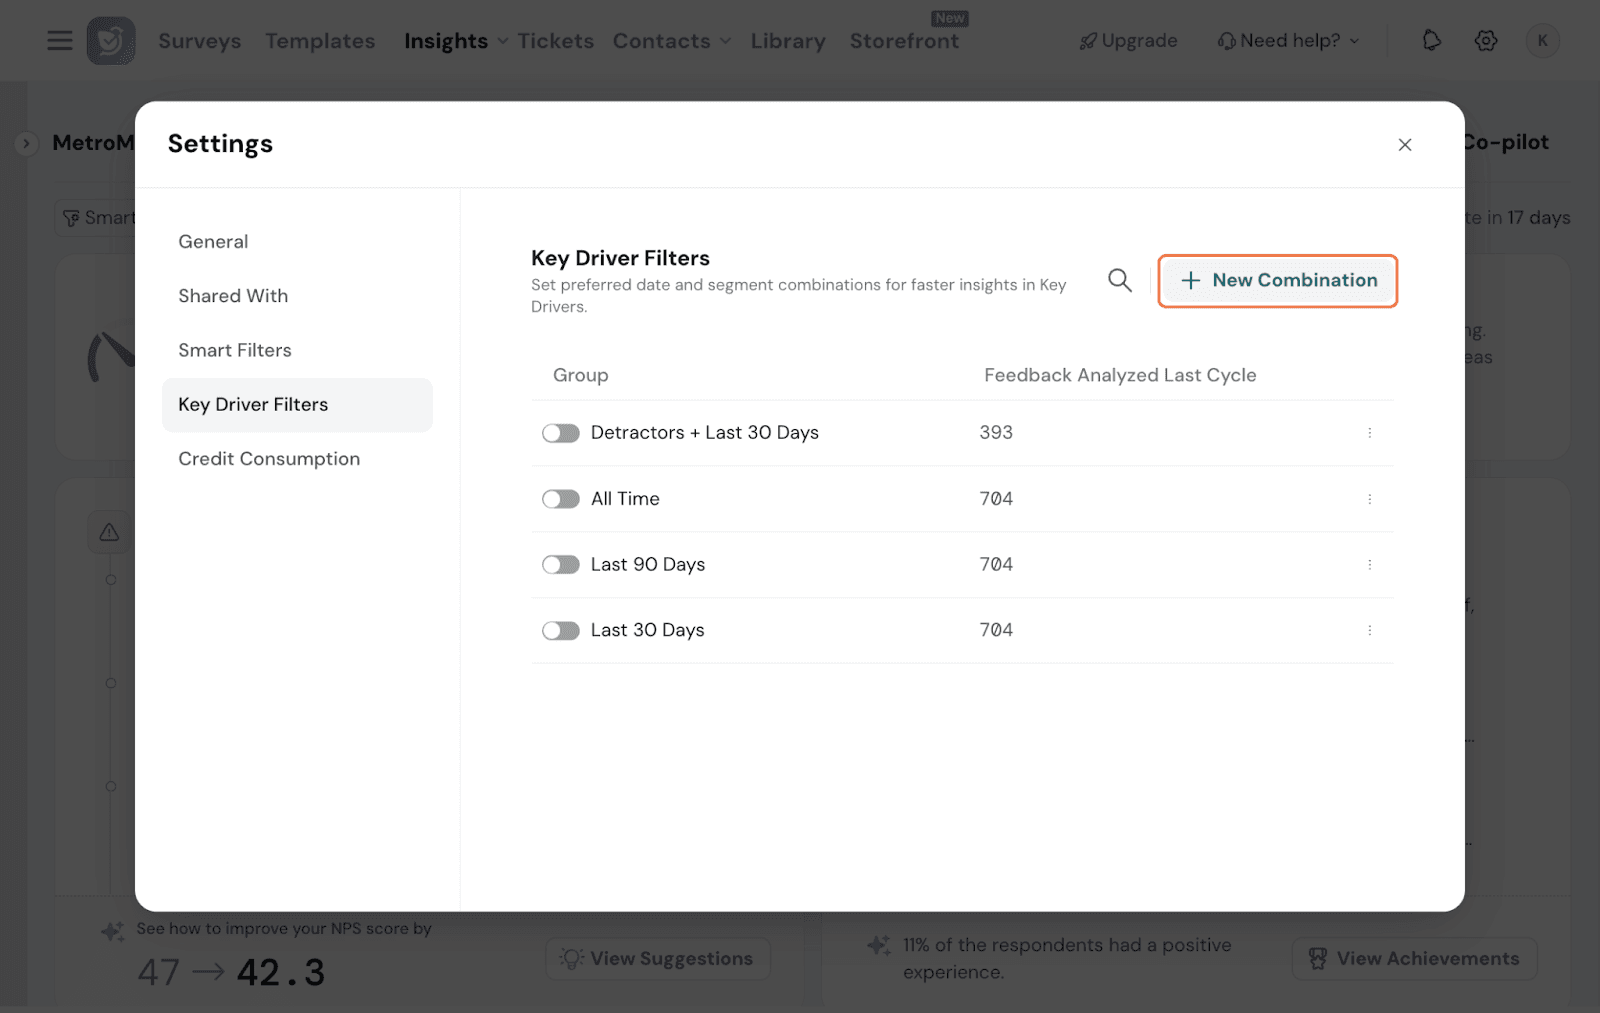
You can click “Past 90 Days” under Date Range and Detractors under Smart Filter and save this segment.
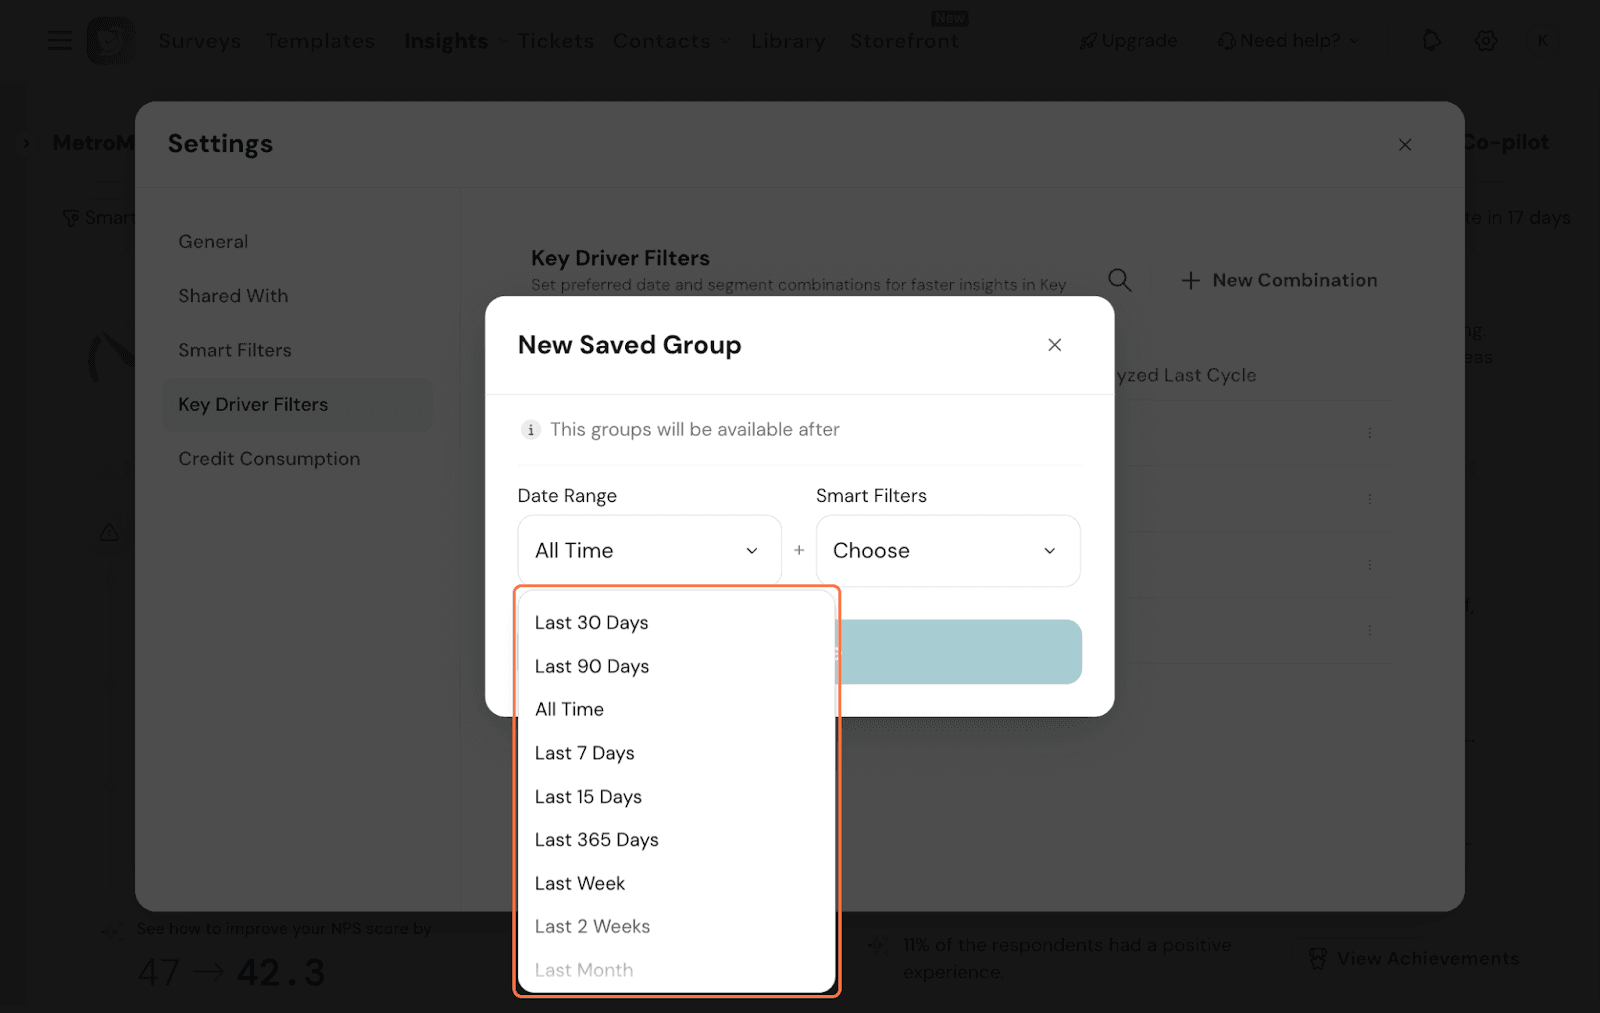
This automatically gets generated every 30 days when the Key Driver gets refreshed.
You get a maximum of 10 segments to create. If you do not want a segment to be generated, you can toggle it off or delete it as well.
Comparison
Click on the icon next to the 3 dots. This lets you compare versions of CogniVues.
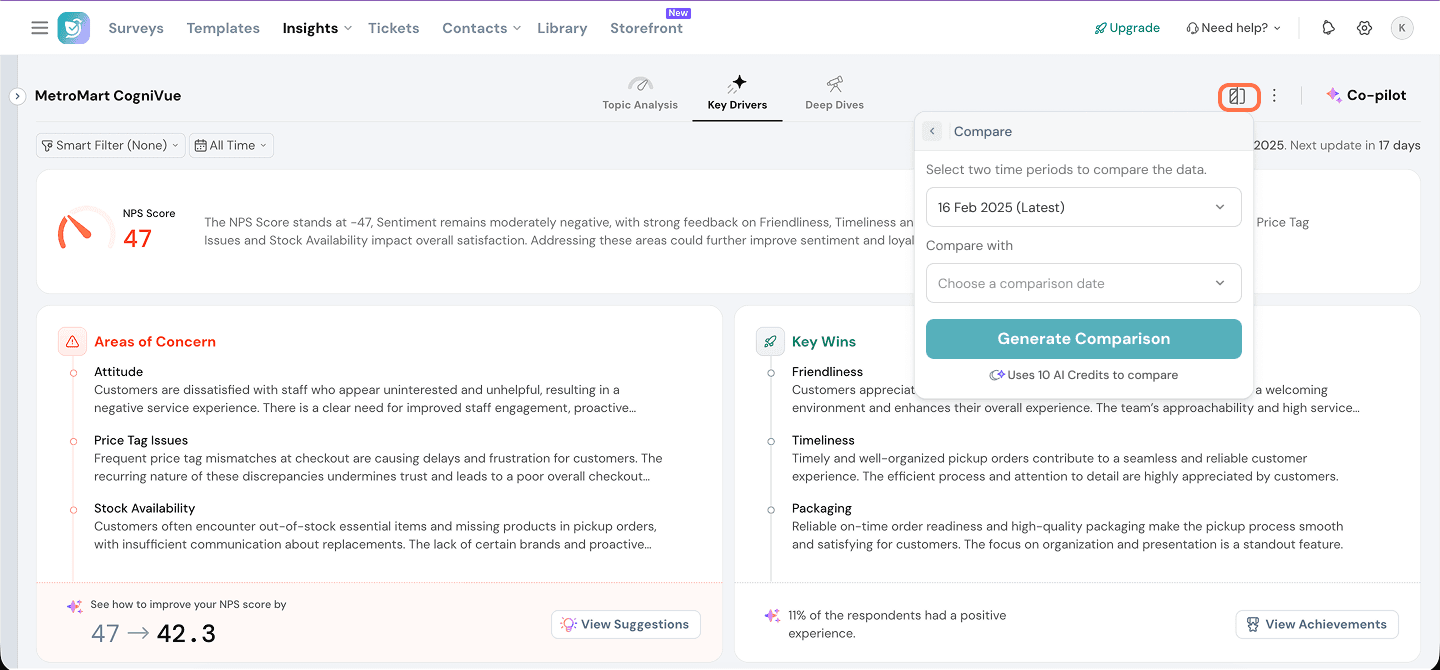
This could be the simple month-on-month CogniVues or comparing segments against each other. Let’s do a Quarterly Comparison here.
Let’s compare 2 segments. Input the desired Key Drivers and hit Generate. Note that this consumes AI Credits.
The comparison widget will have 3 sections
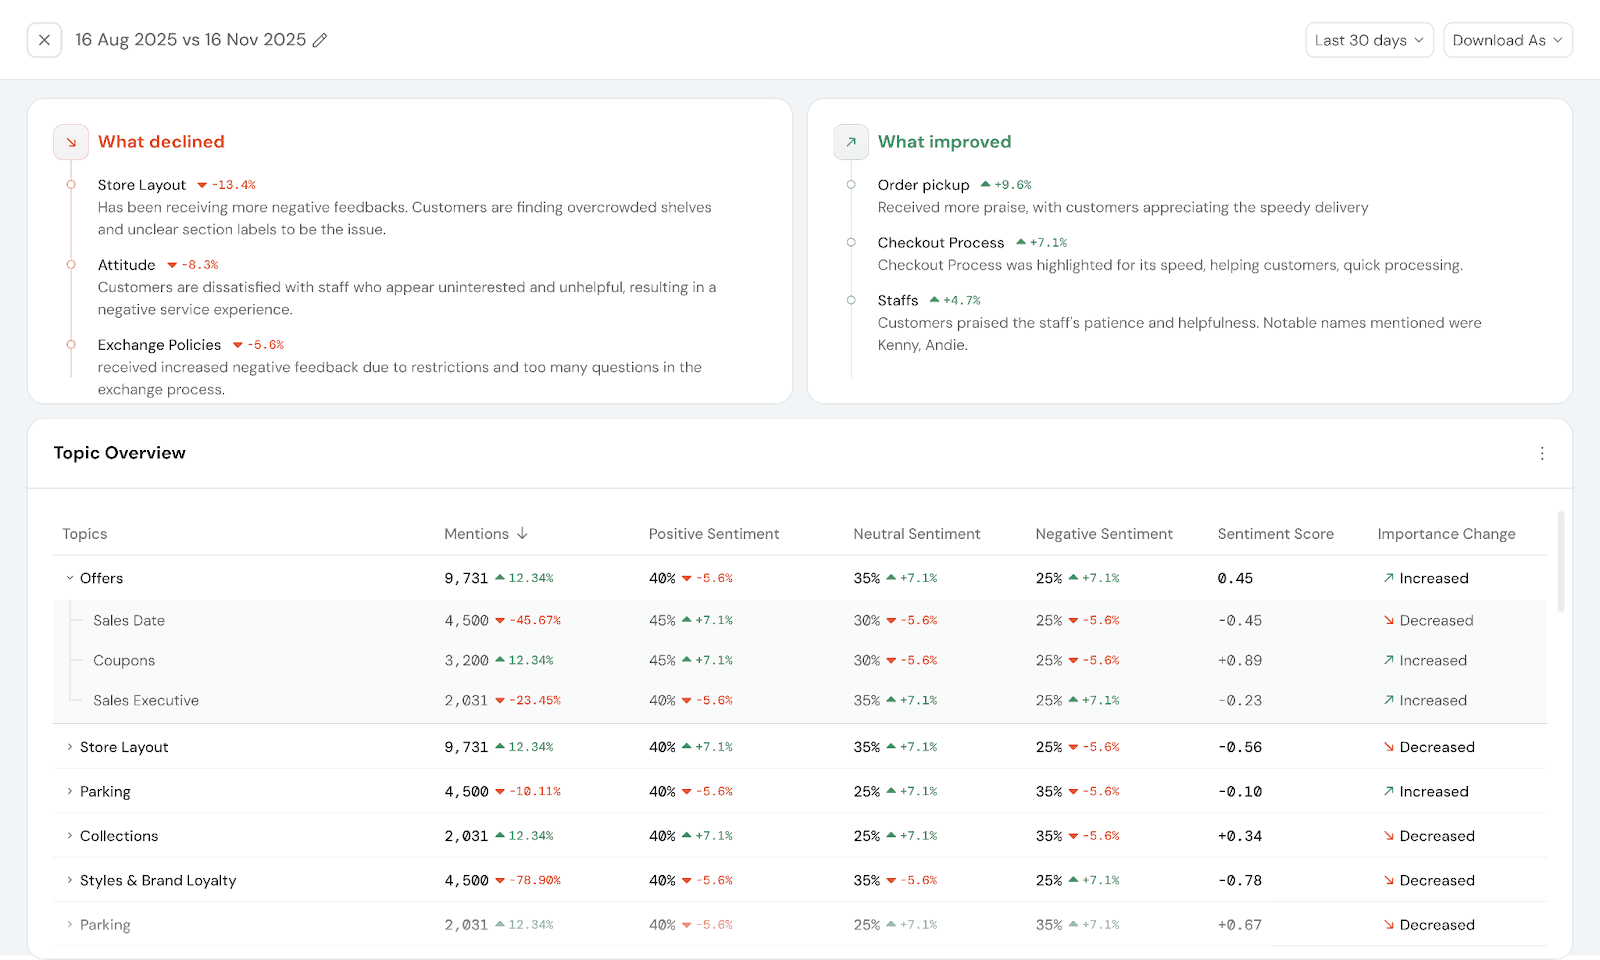
- What declined - Shows the top 3 sub-topics with the most decrease in sentiment score (This does not have to be negative sentiment)
- What improved - Shows the top 3 sub-topics with the most increase in sentiment score (This does not have to be positive sentiment)
- Topic Overview - shows a detailed breakdown of changes in
- Mentions
- Changes in % of positive, negative, and neutral sentiment
- Changes in the score of sentiment
- Changes in Impact - Increased, Decreased, Unchanged
You can toggle between the available 4 date ranges. This comparison can be saved for later reference as well.
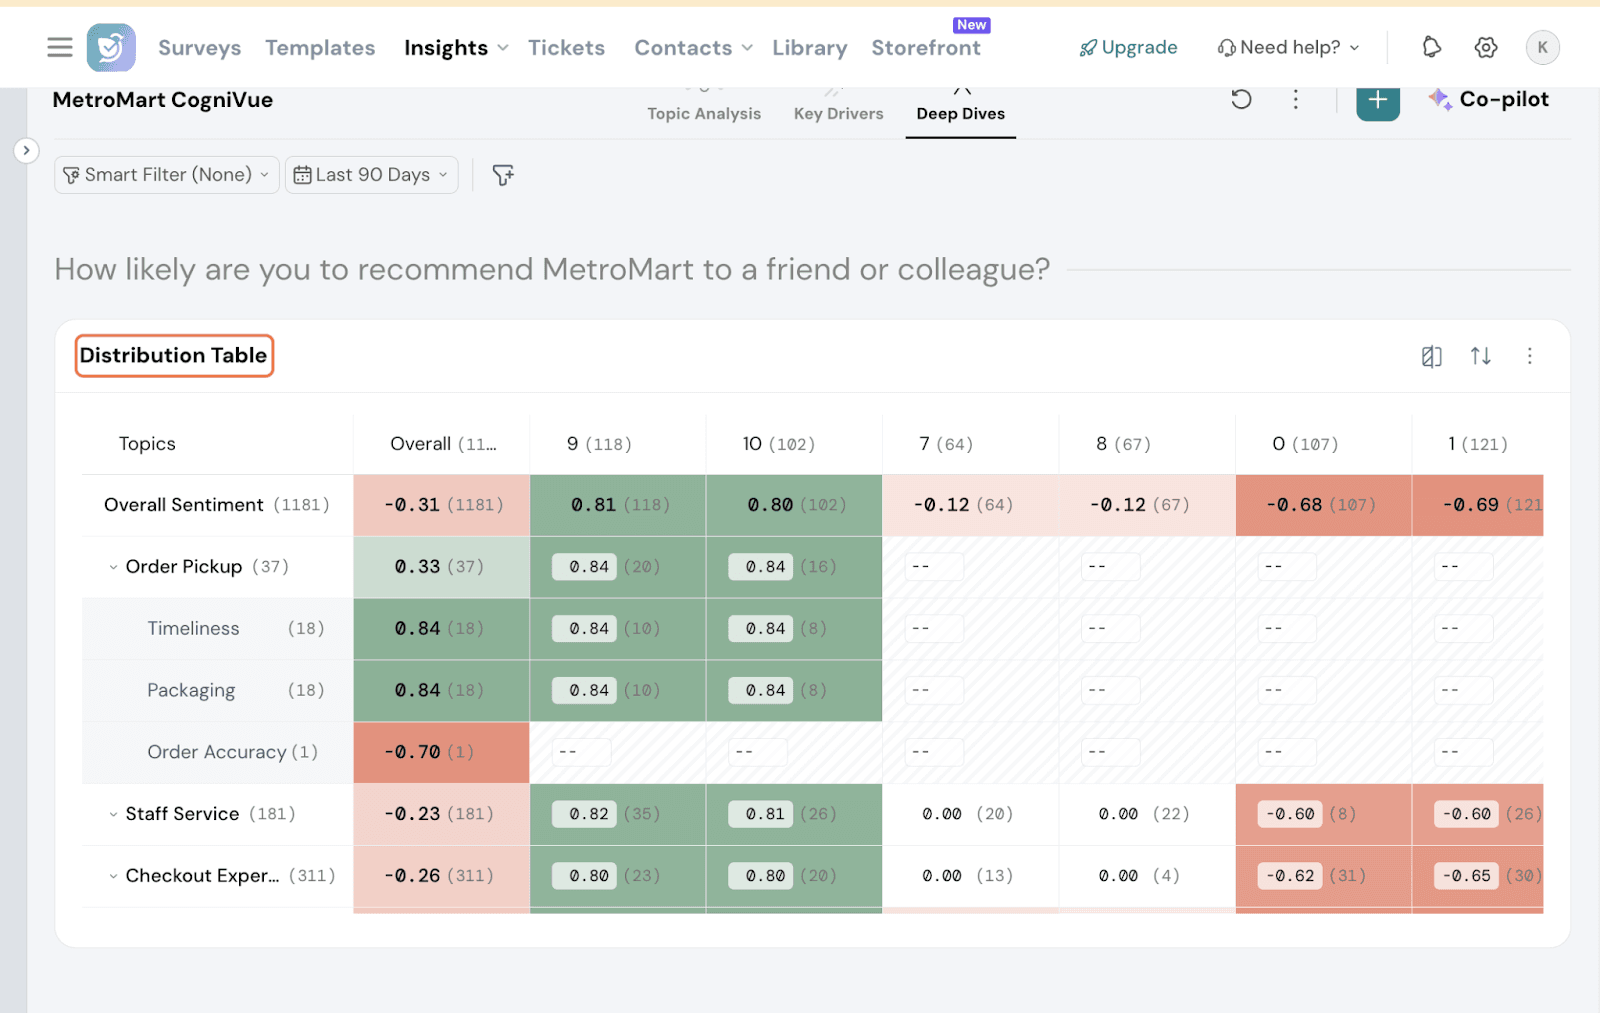
Deep Dives
This section does a detailed sentiment breakdown across special segments with advanced heatmaps.
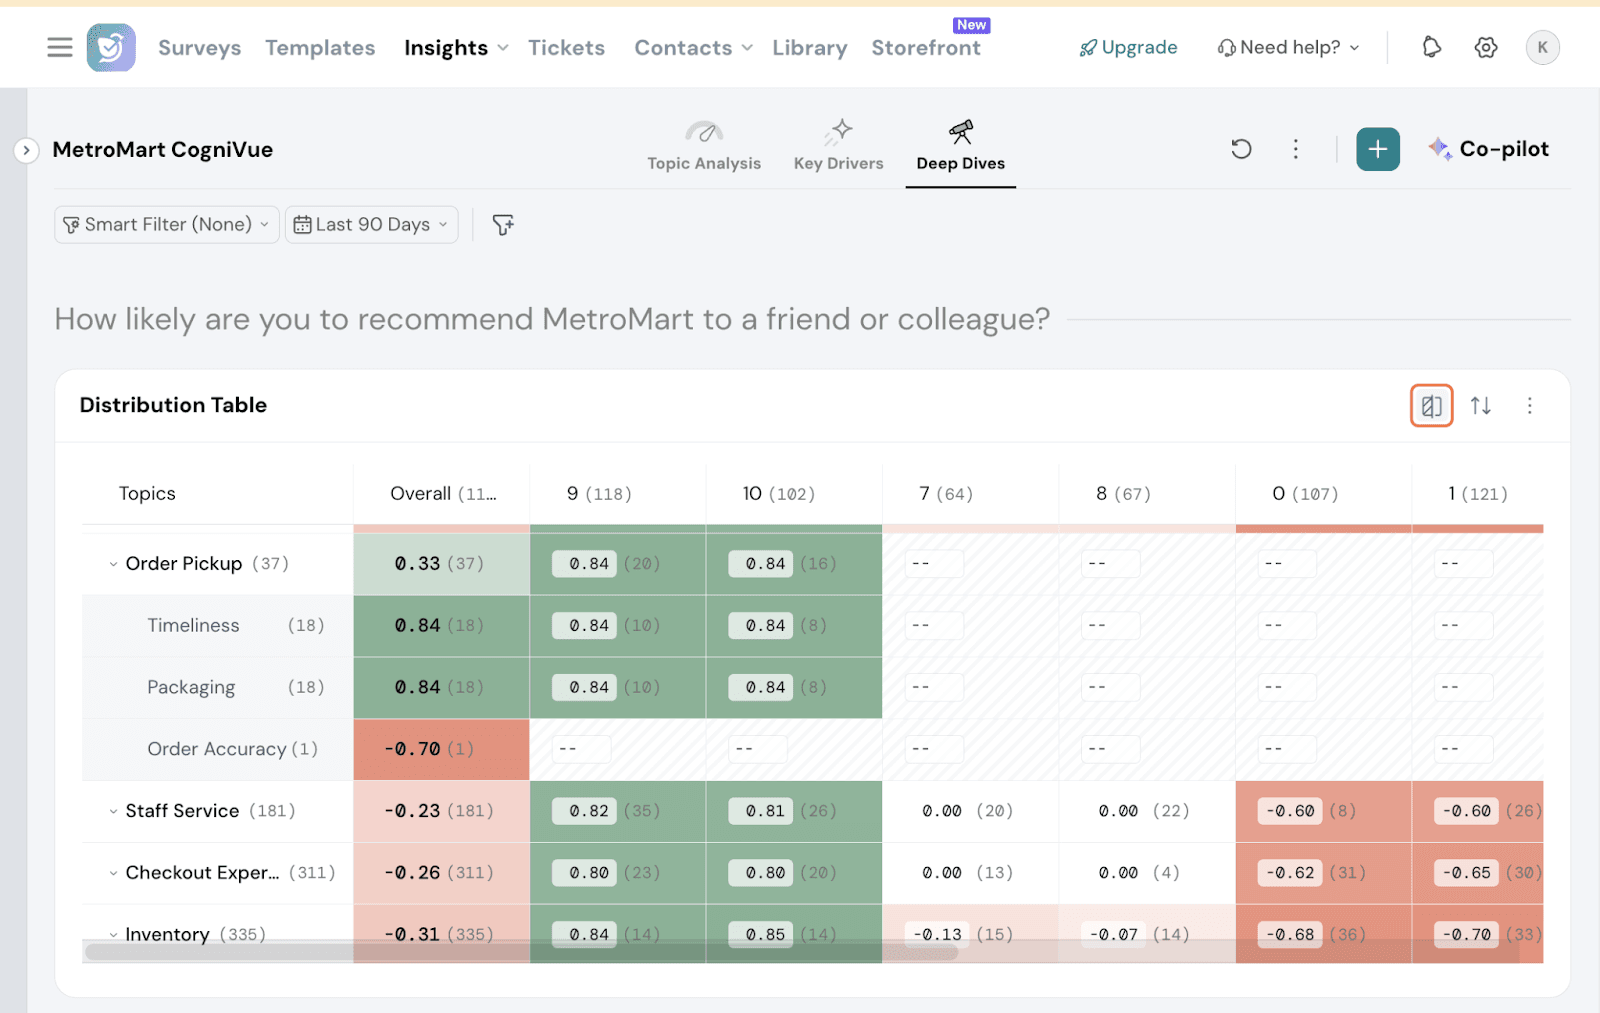
The heatmap widget shows the grouping of sentiment by Topics and sub-topics as rows, and a category for columns.
Categories available:
- For Surveys
- Location/Product variable, if any
- Any other variable
- Any MCQ, Drop-down question
- Any Response Property
- Any drop-down type contact property
- Any single-line text property
- For Reviews
- It will be grouped by locations by default
You can create additional heatmap widgets based on the above.
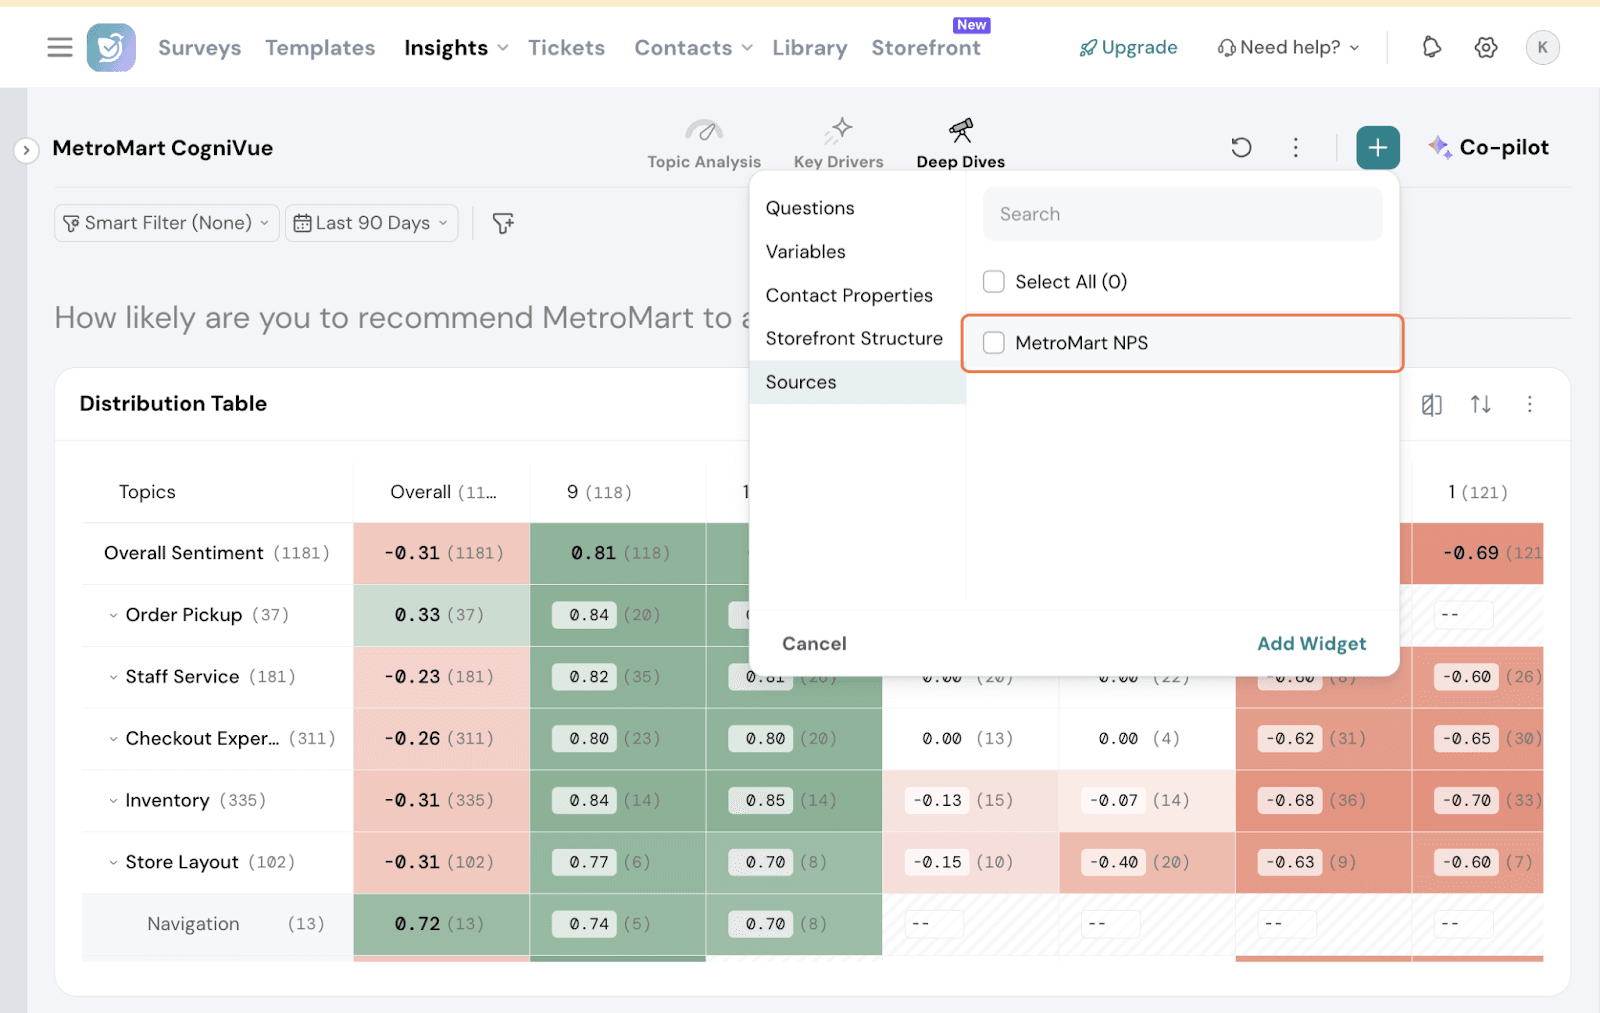
Click on the + icon.
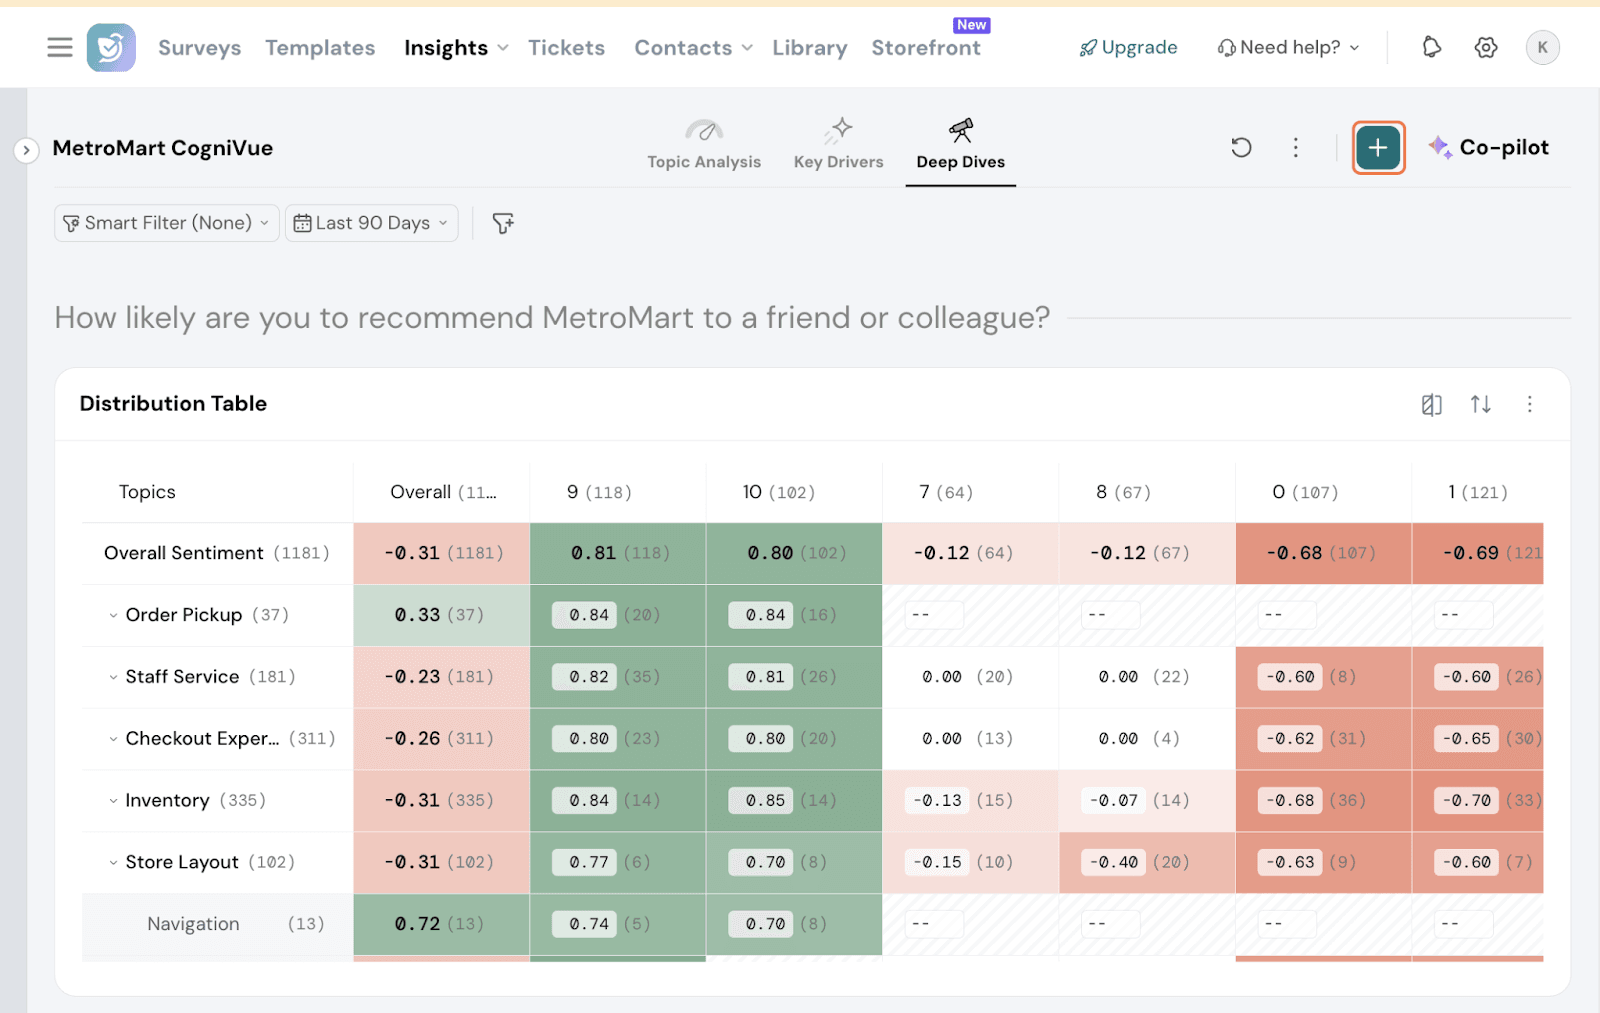
You will get the categories to choose from.
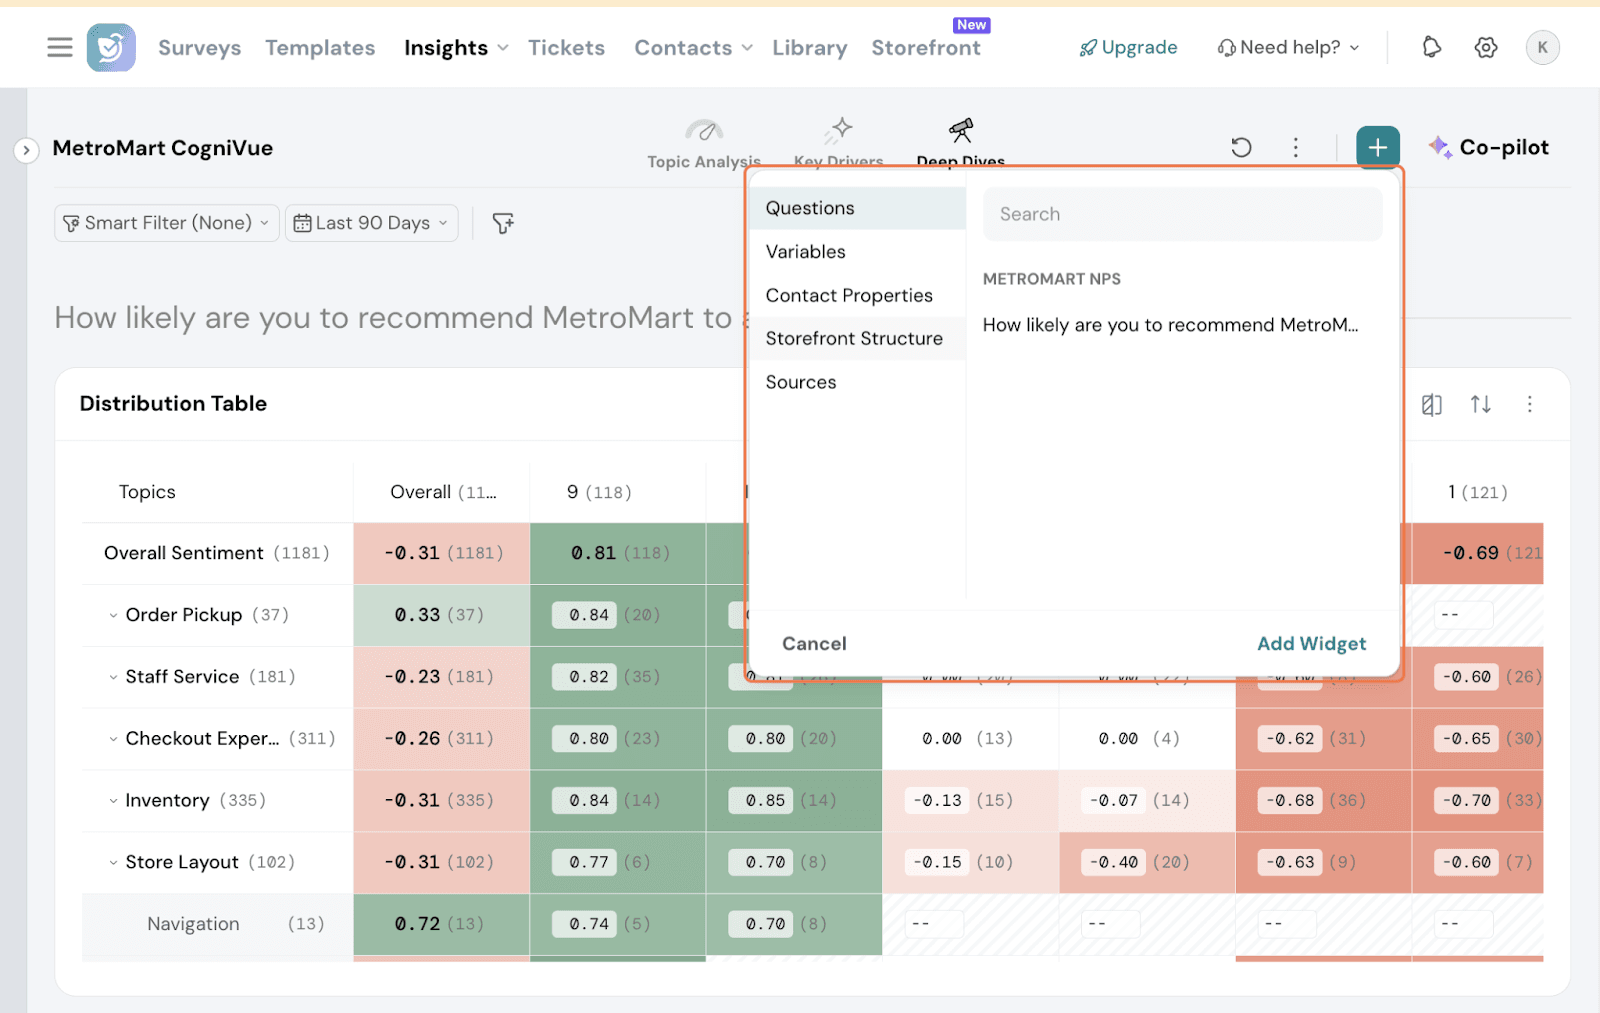
Pick the criteria and add widget.
If you wish to compare groups, that is possible as well. This is useful when you want to compare the sentiment of a particular store to its area or a particular product to its category.
Click on this icon to compare.
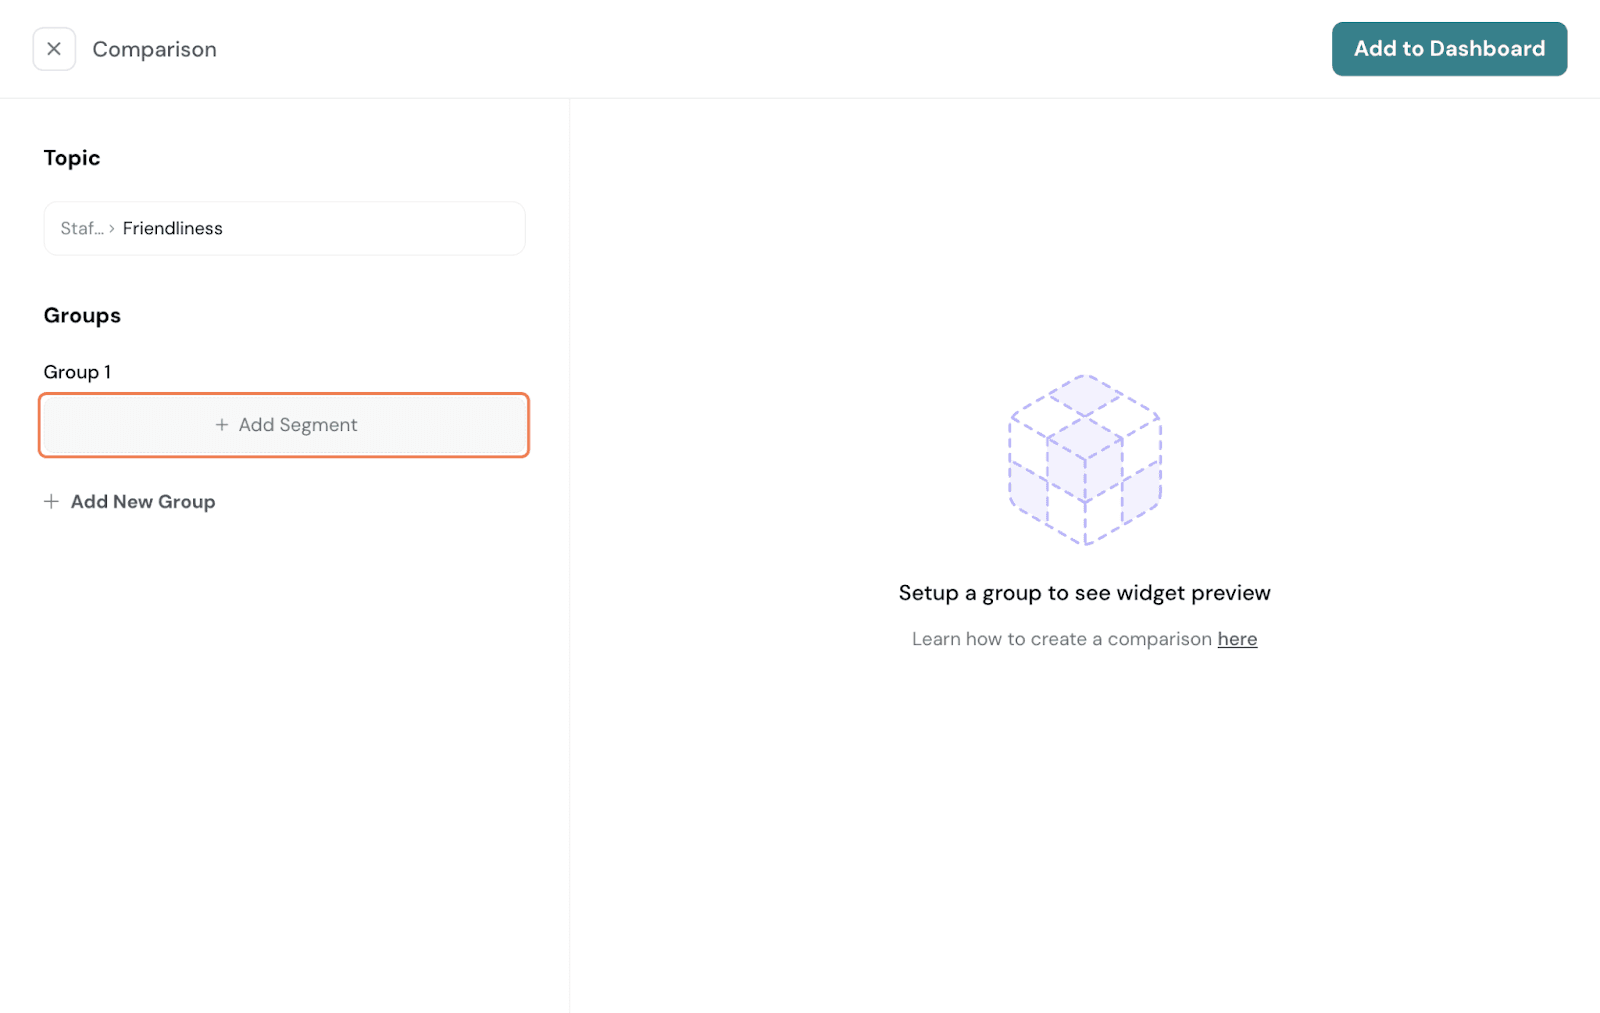
Here, you can set up whether you want all topics to be compared or a specific topic.
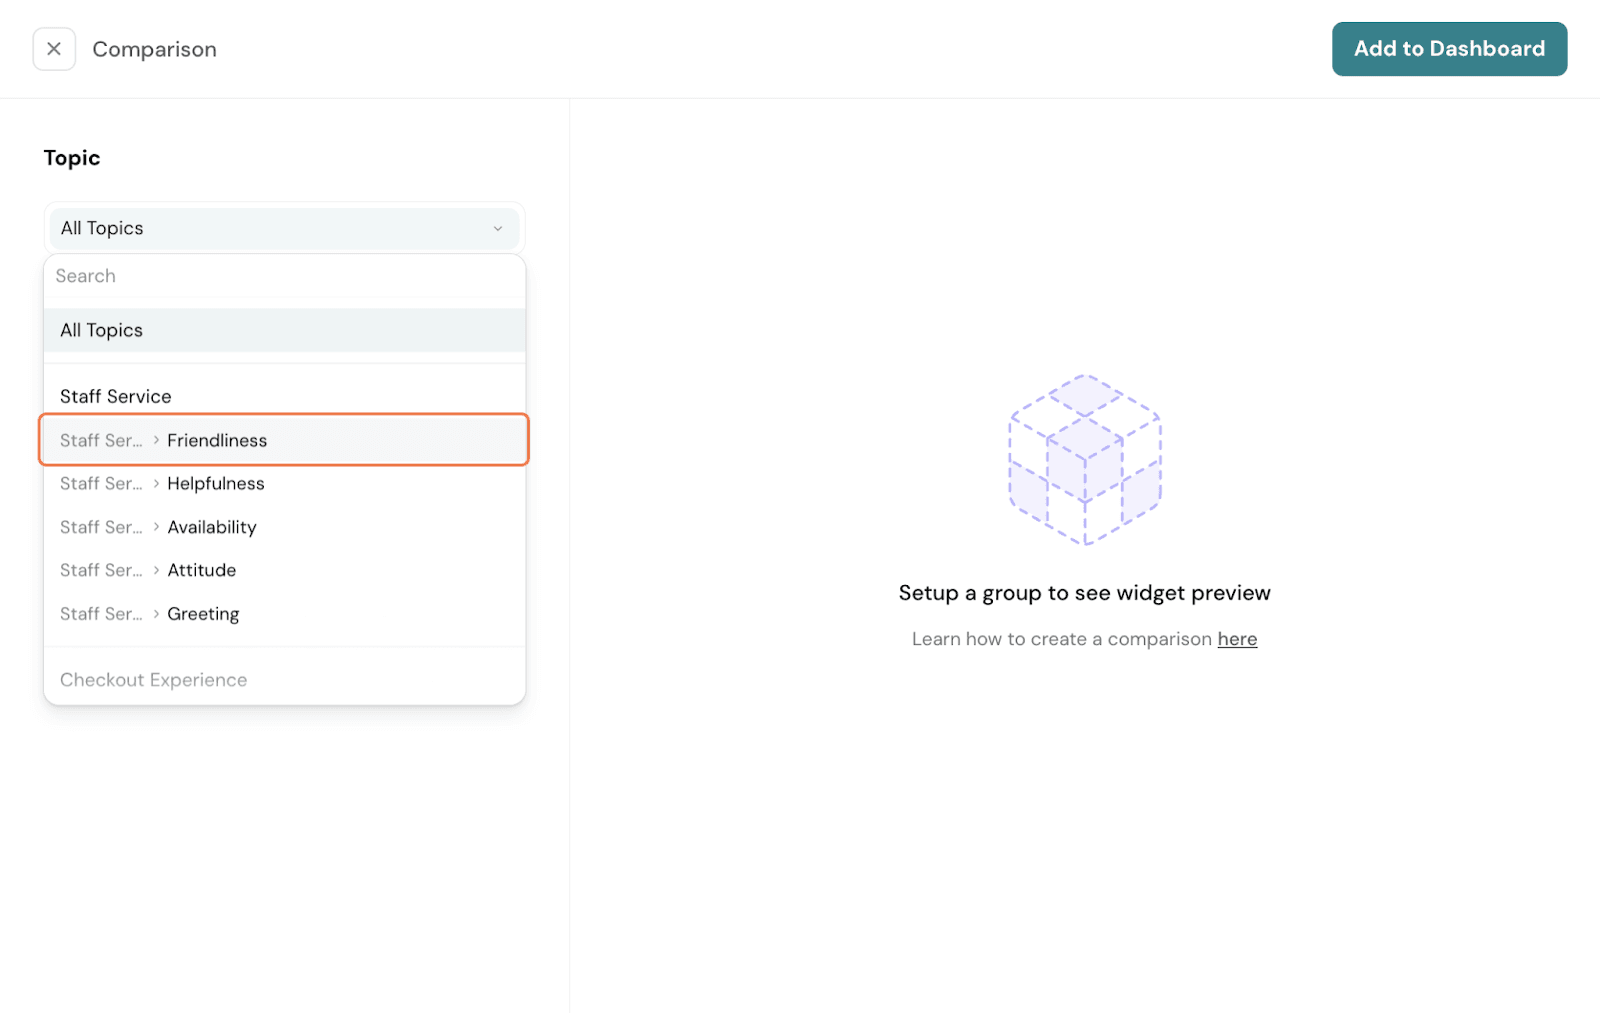
Then form your groups. Click on Add Segment to add variables within a group.
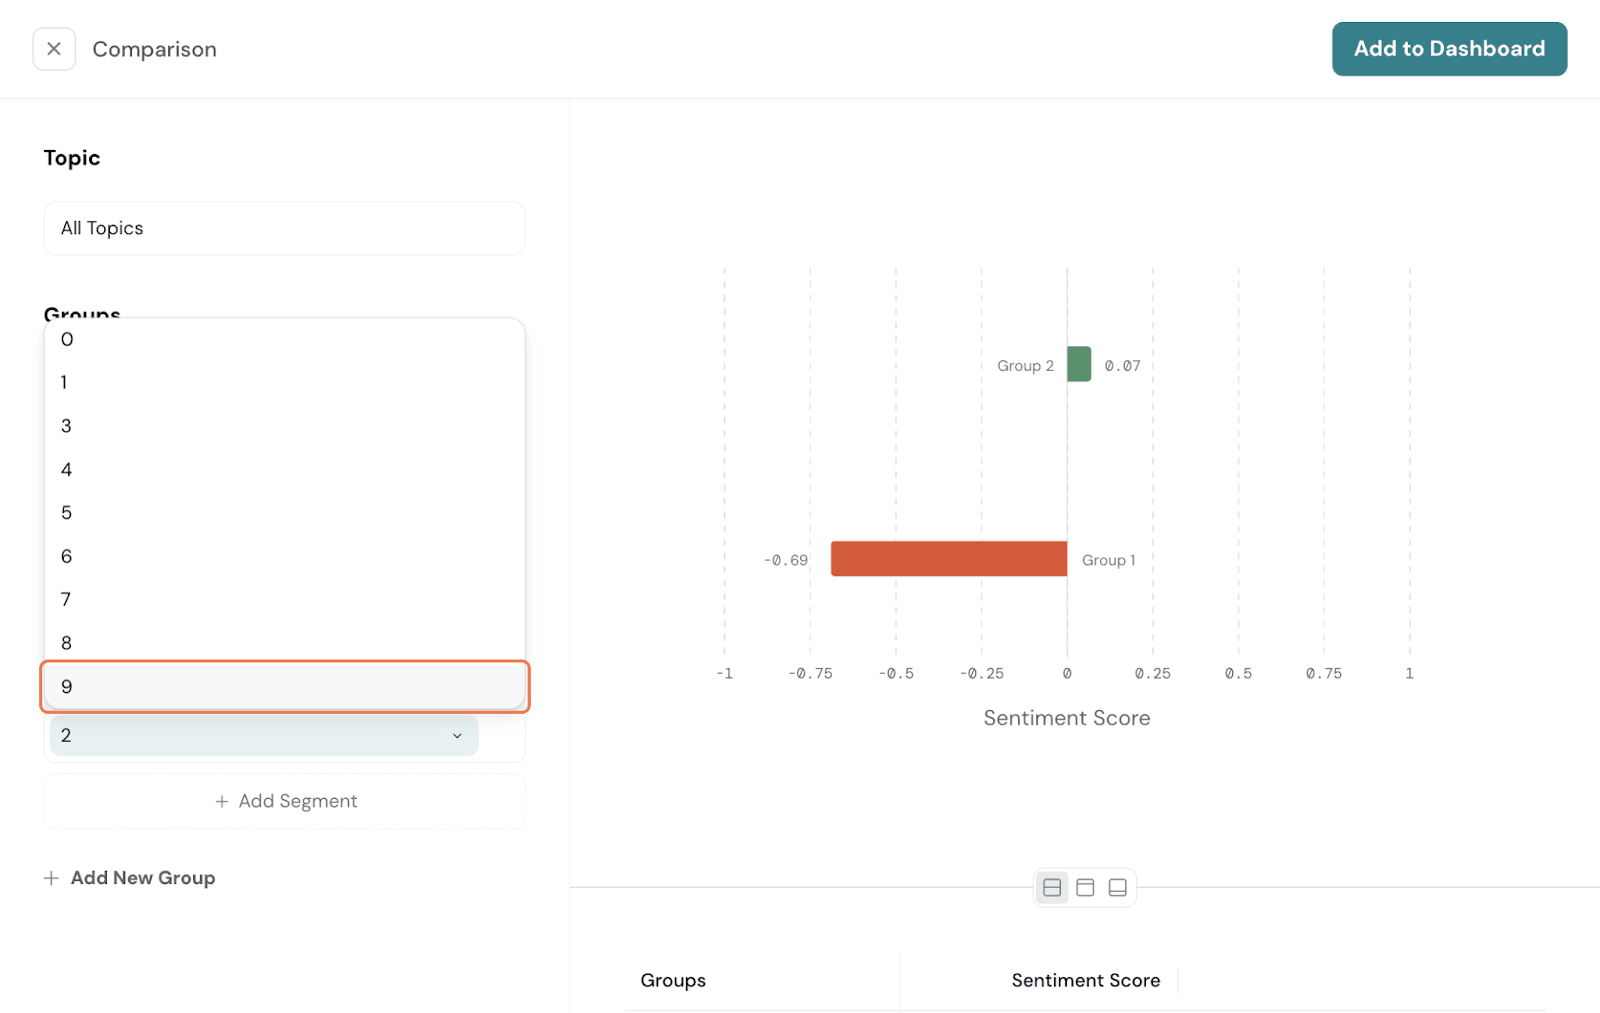
Pick options from the dropdown. You can add as many options as you choose. Here, let’s compare Detractors and Promoters.

Then, click on Add group and repeat the steps above to form your other groups. Let us create the Promoters group now.
Once done, you can see the comparison clearly plotted.
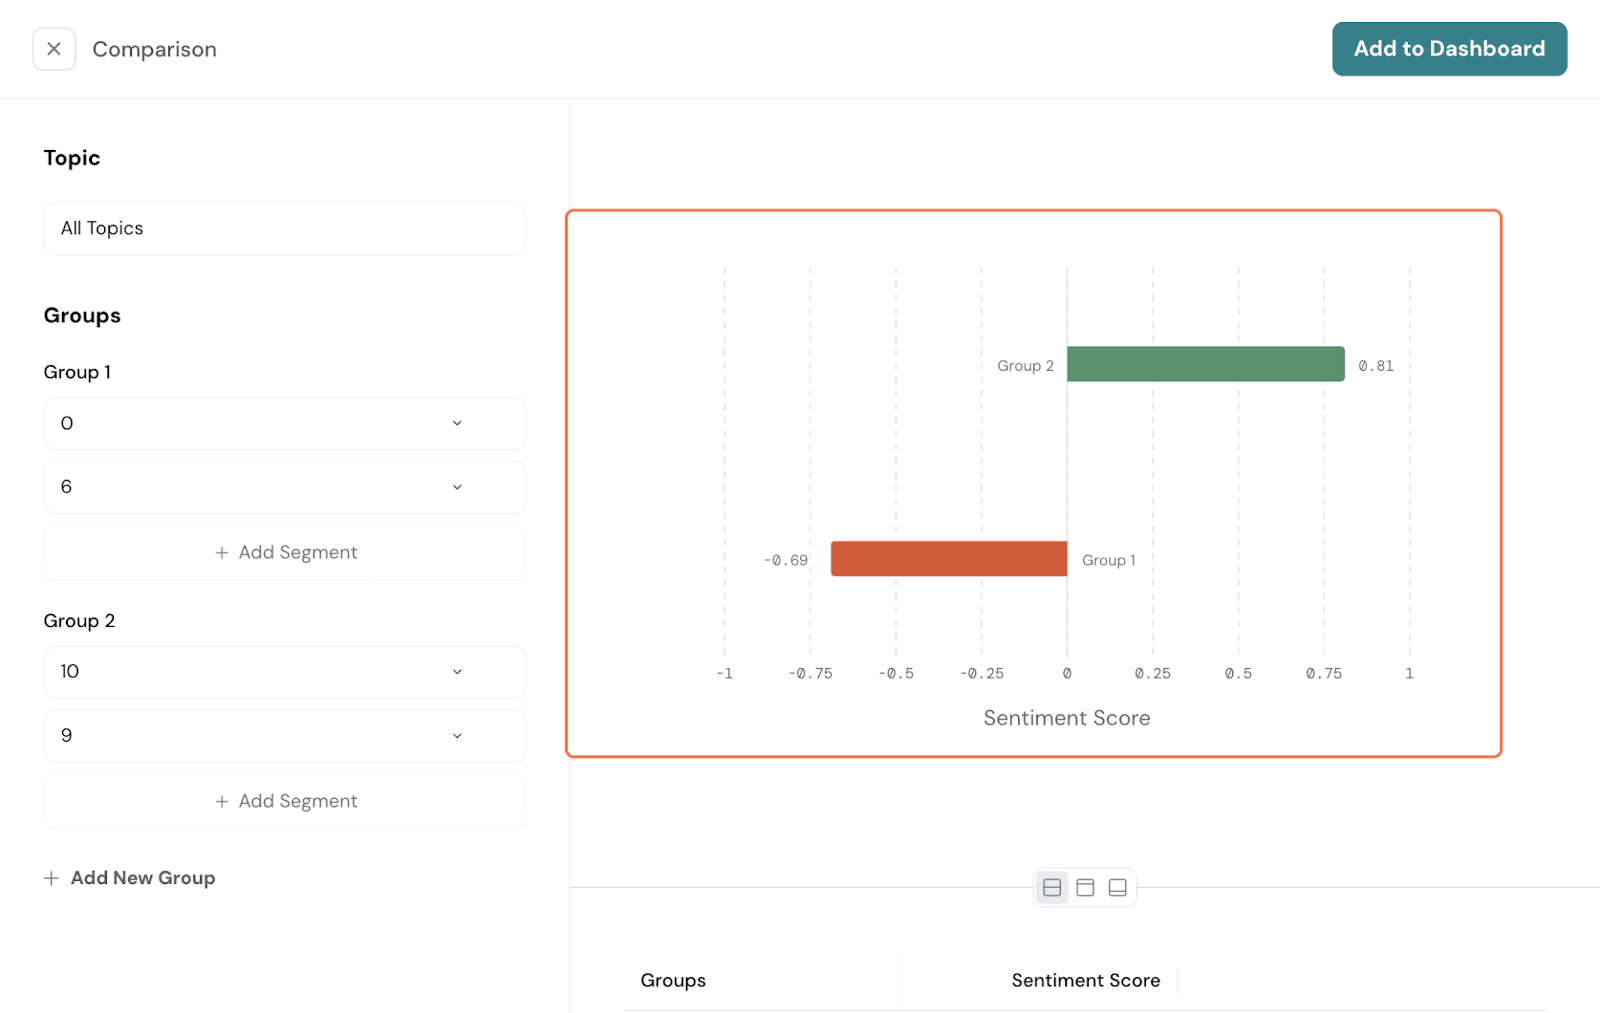
Click on Add to Dashboard to have it added to the CogniVue.
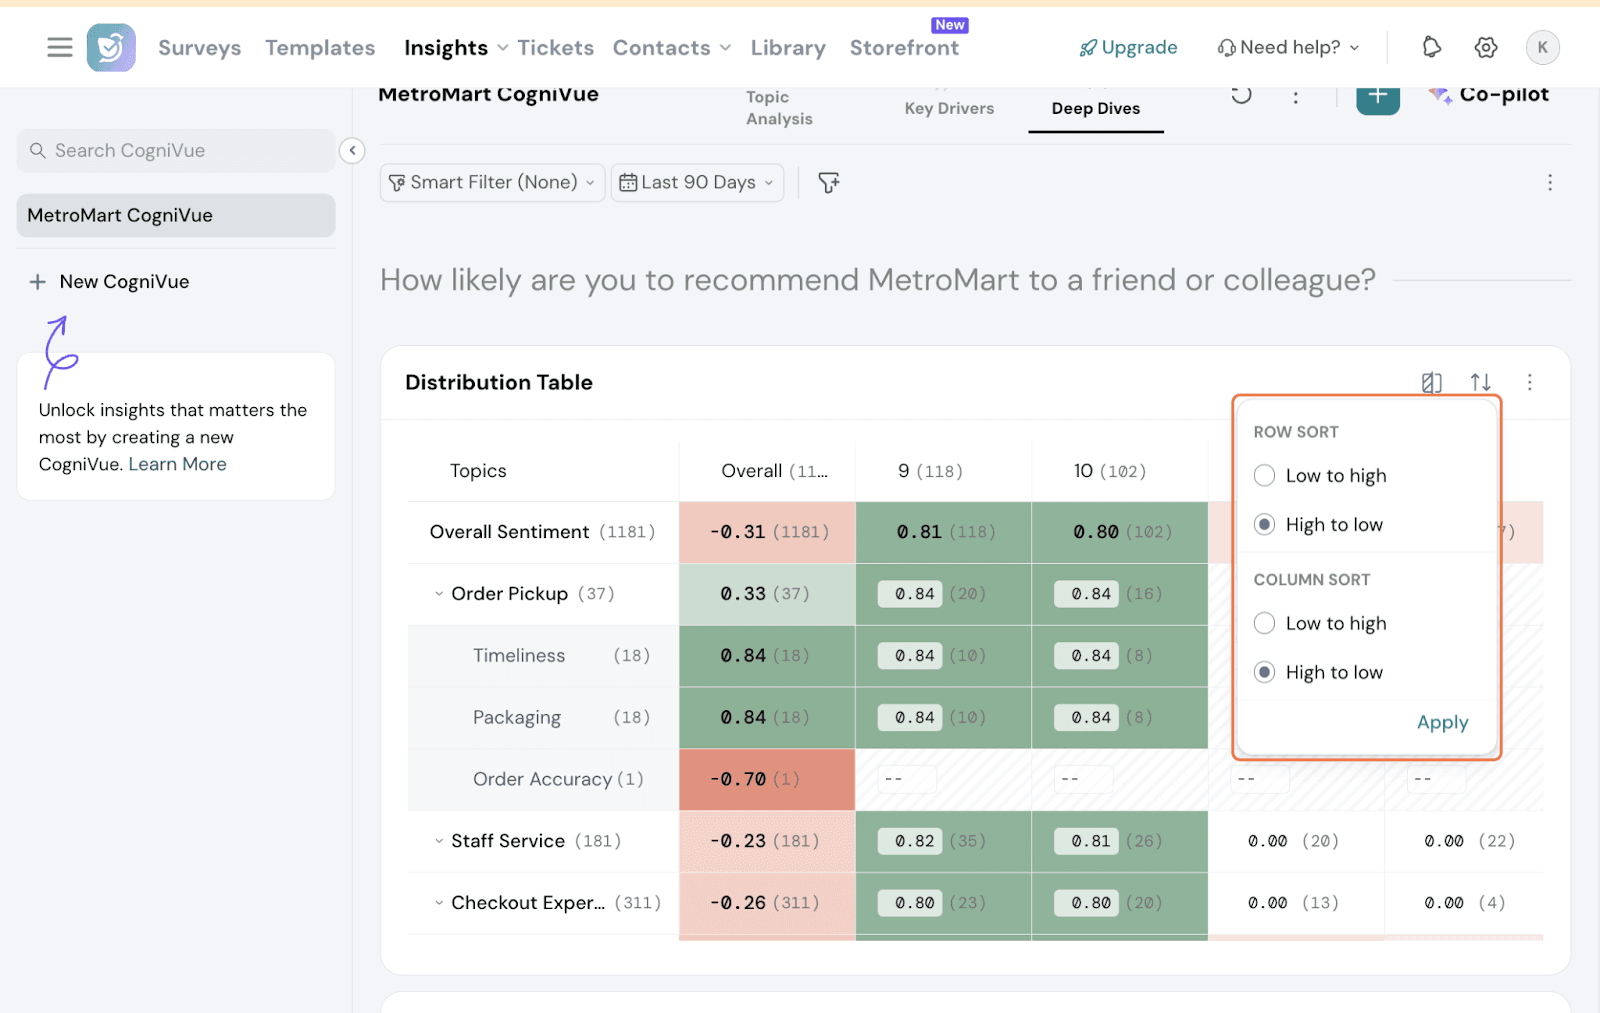
Click on the arrows icon for sorting either by row or column. 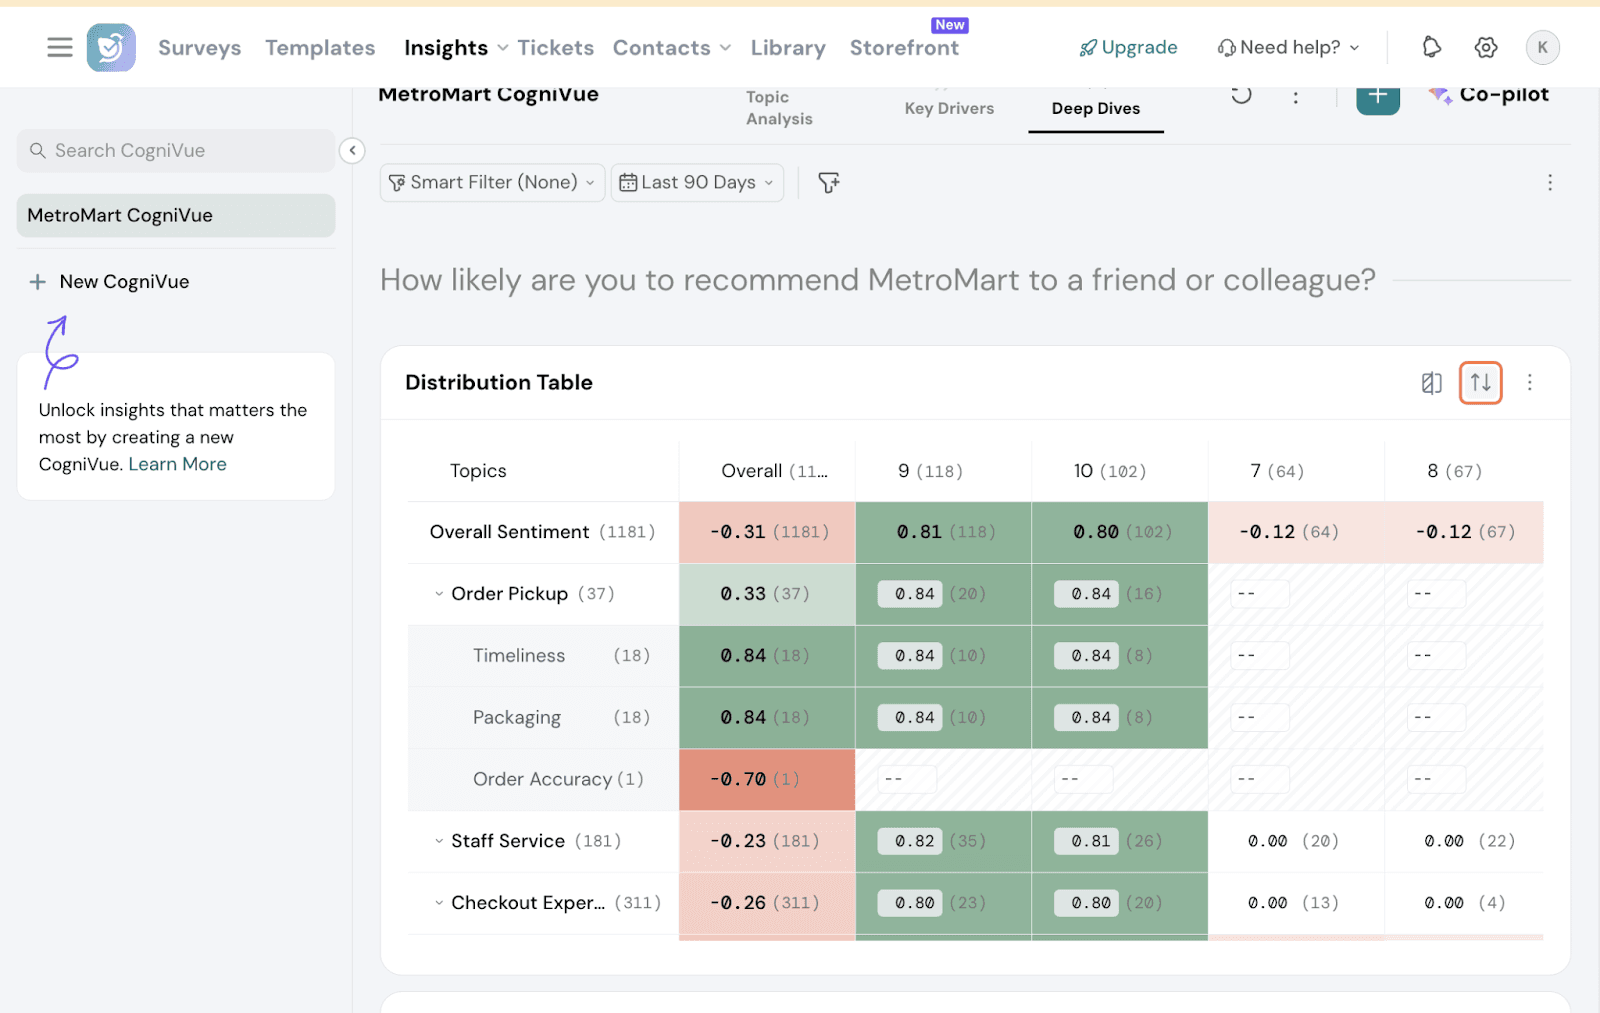
You can sort either low to high or high to low by row or column. This is for your preferred data sorting within the widget.
The filtering available is applicable for Deep Dives. (See next section)
All widgets here can be added to the Executive Dashboard. If preferred, they can also be exported as JPG, PNG, CSV, and XLSX files.
Note that even the XLSX gets exported as color-coded cells.
CogniVue Actions
Smart Filters
If you have a specific set of filters you would apply every time to see your data, you can set the set of rules as a Smart Filter.
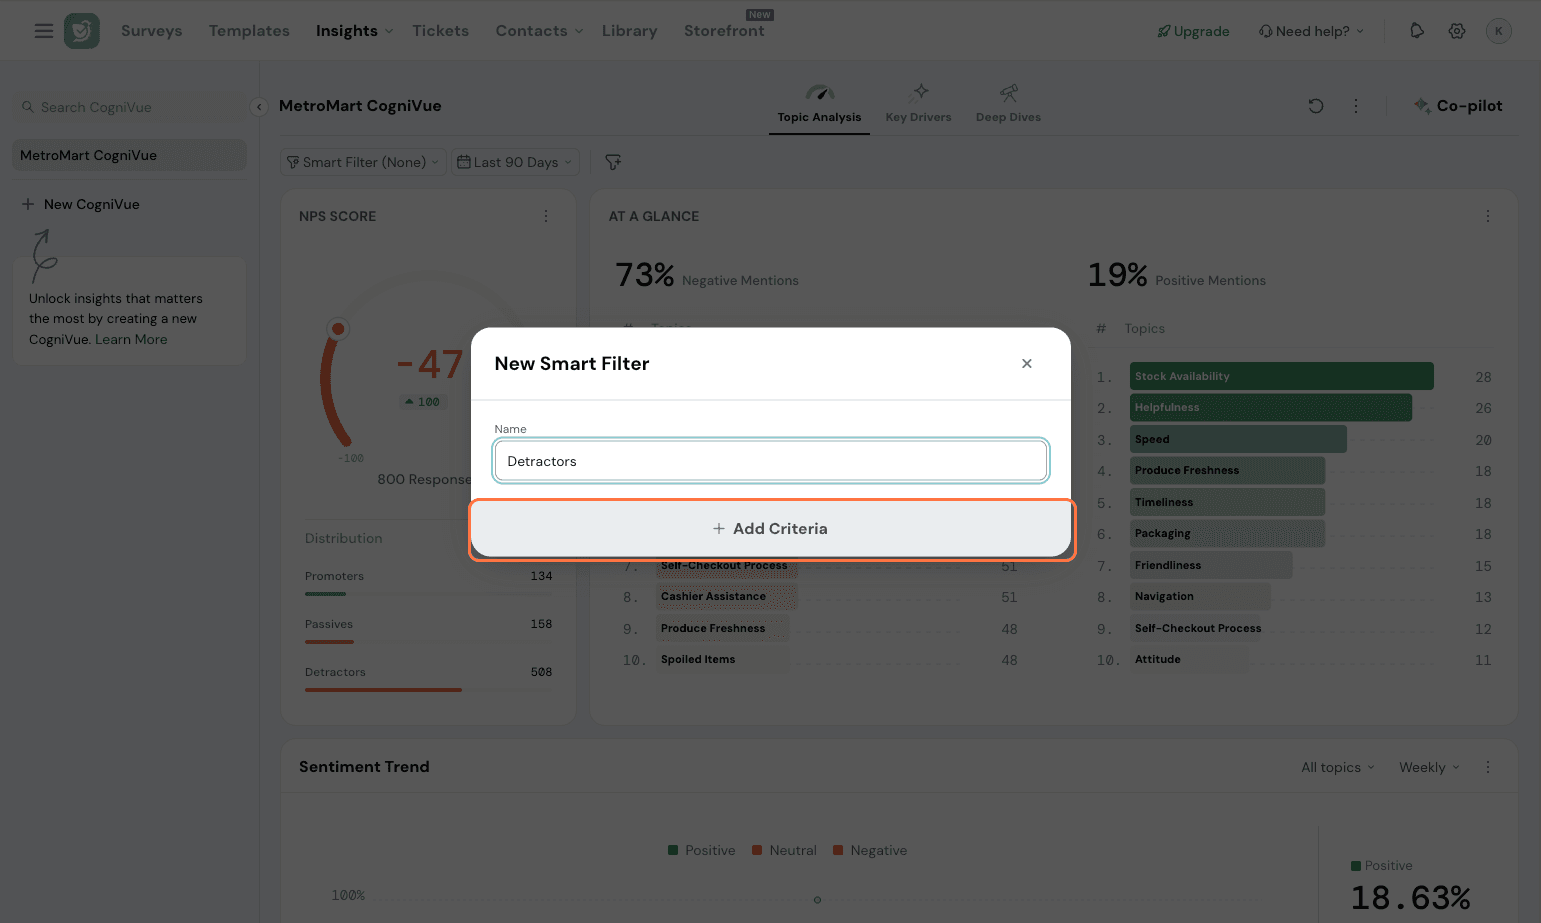
Click on Smart Filter and select Create a new smart filter.
Name your filter and click Add Criteria.
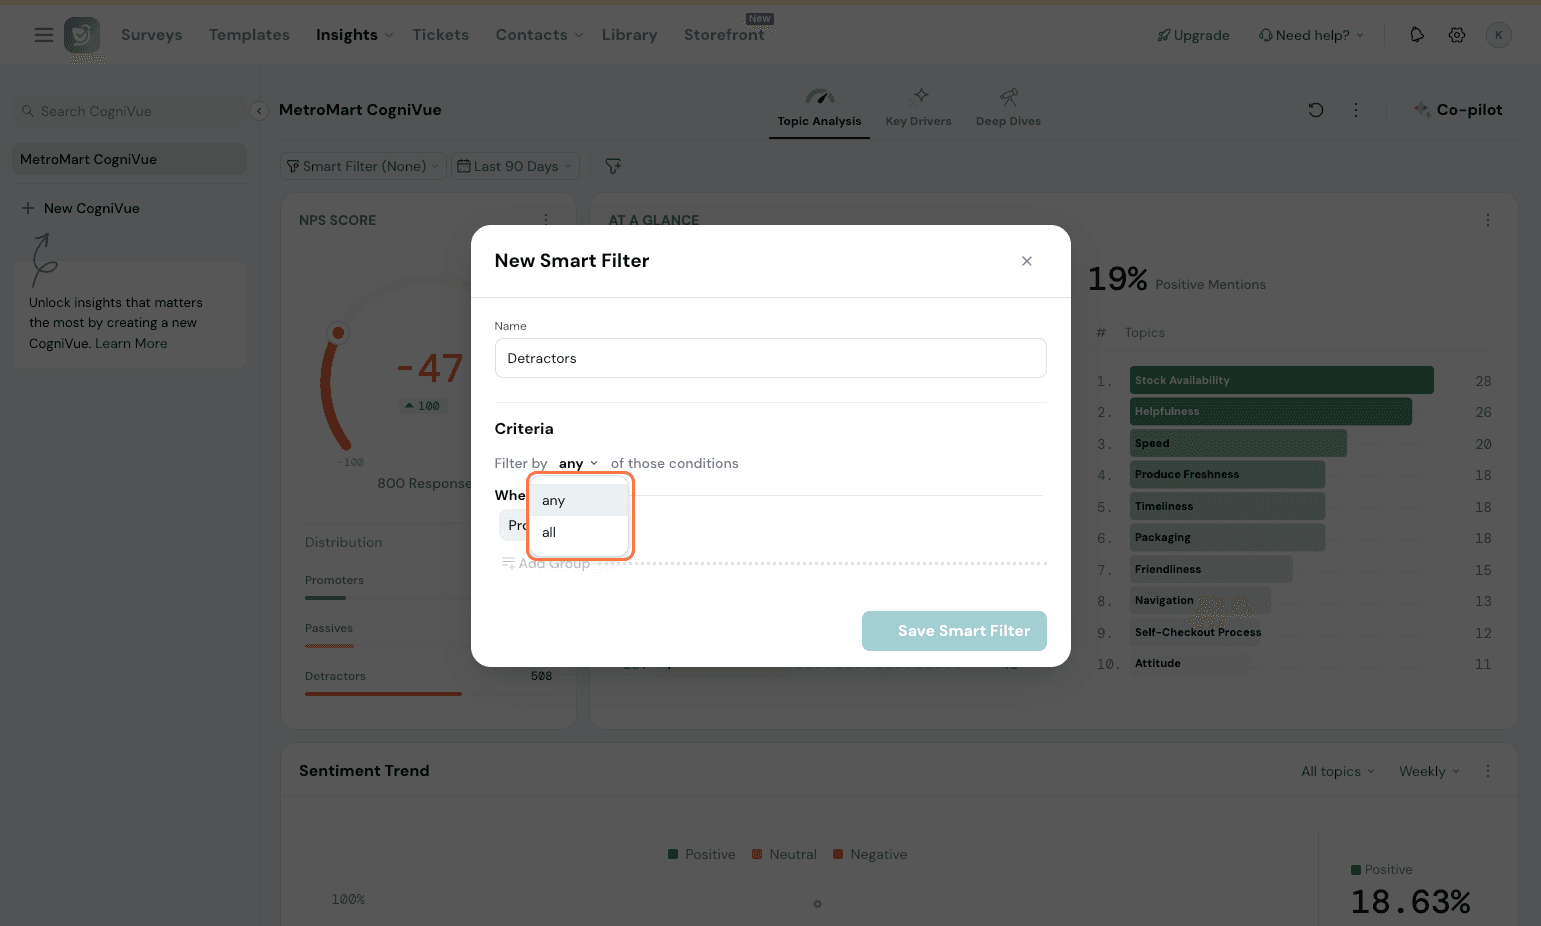
You can choose if you want it to be filtered by any or if all of the criteria must be met.
You can choose to filter with any of these properties:
- Question and answer
- Share
- Response Property
- Respondents Details
- Custom Properties
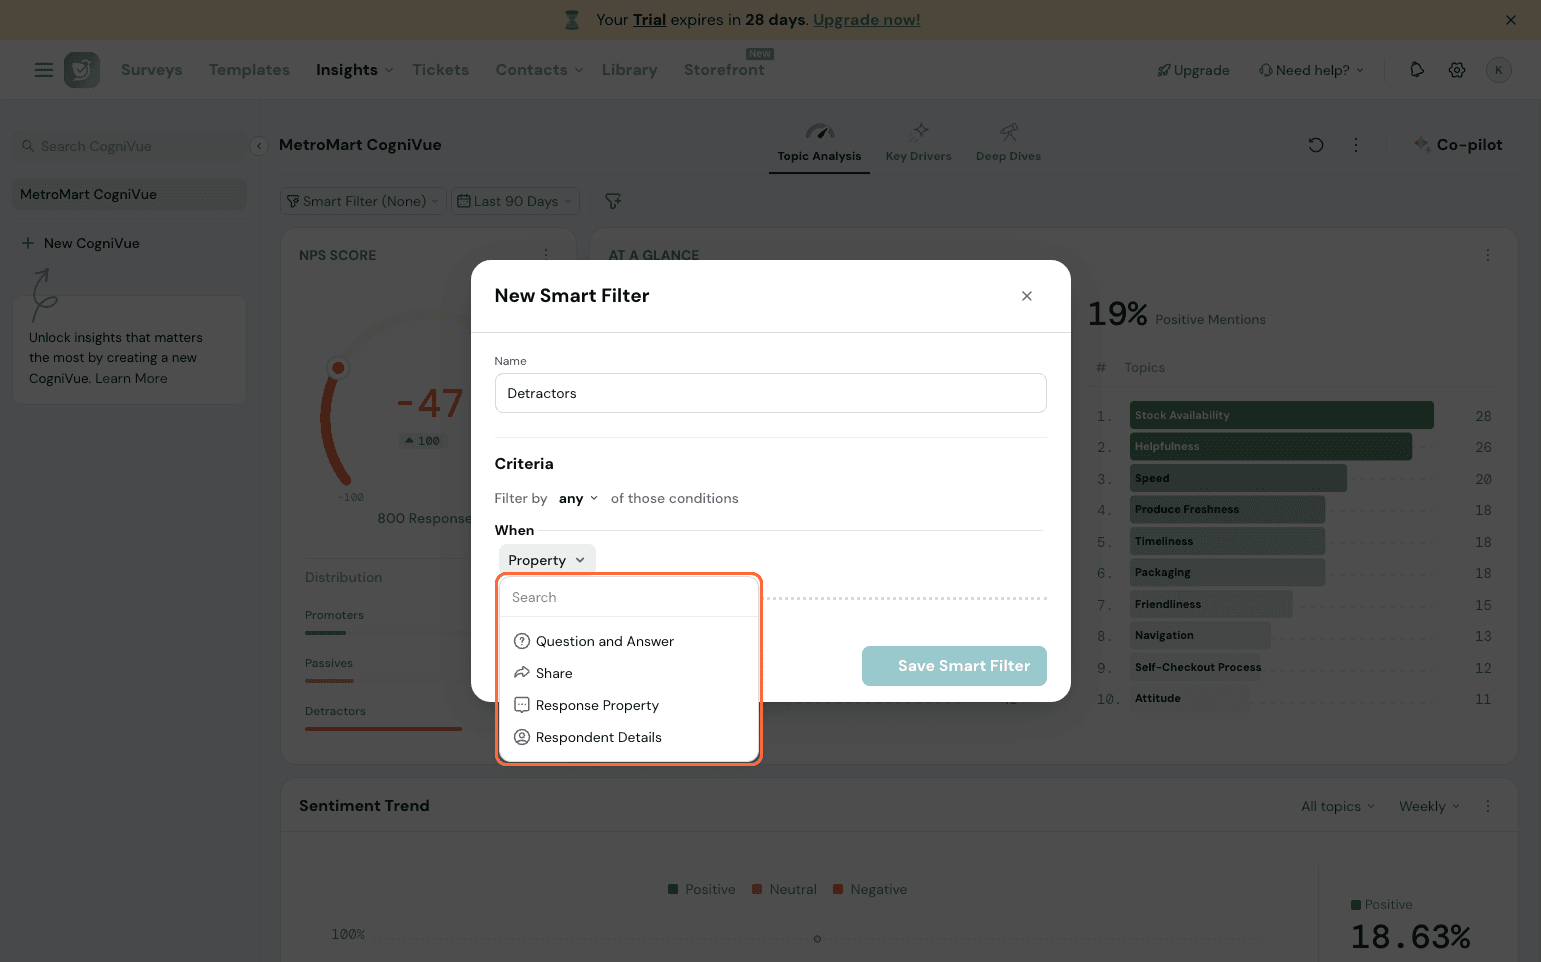
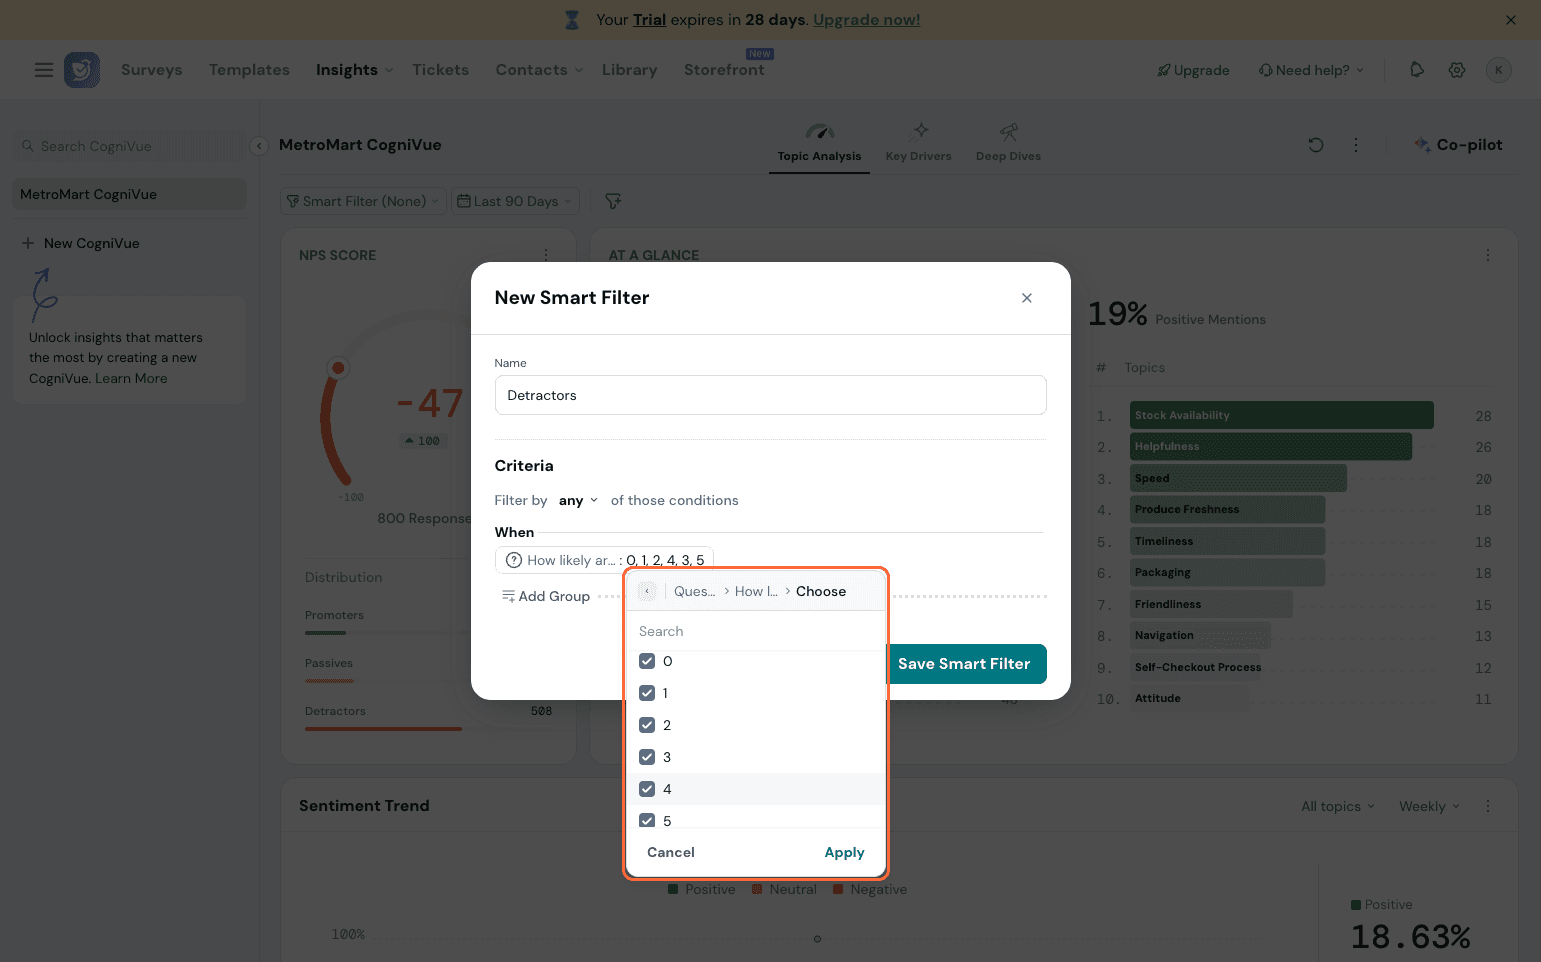
Choose the particular property in question, and set it up to be precise. Here, we’ve picked the question and selected the Detractors to monitor the data accordingly. Hit Apply once done.
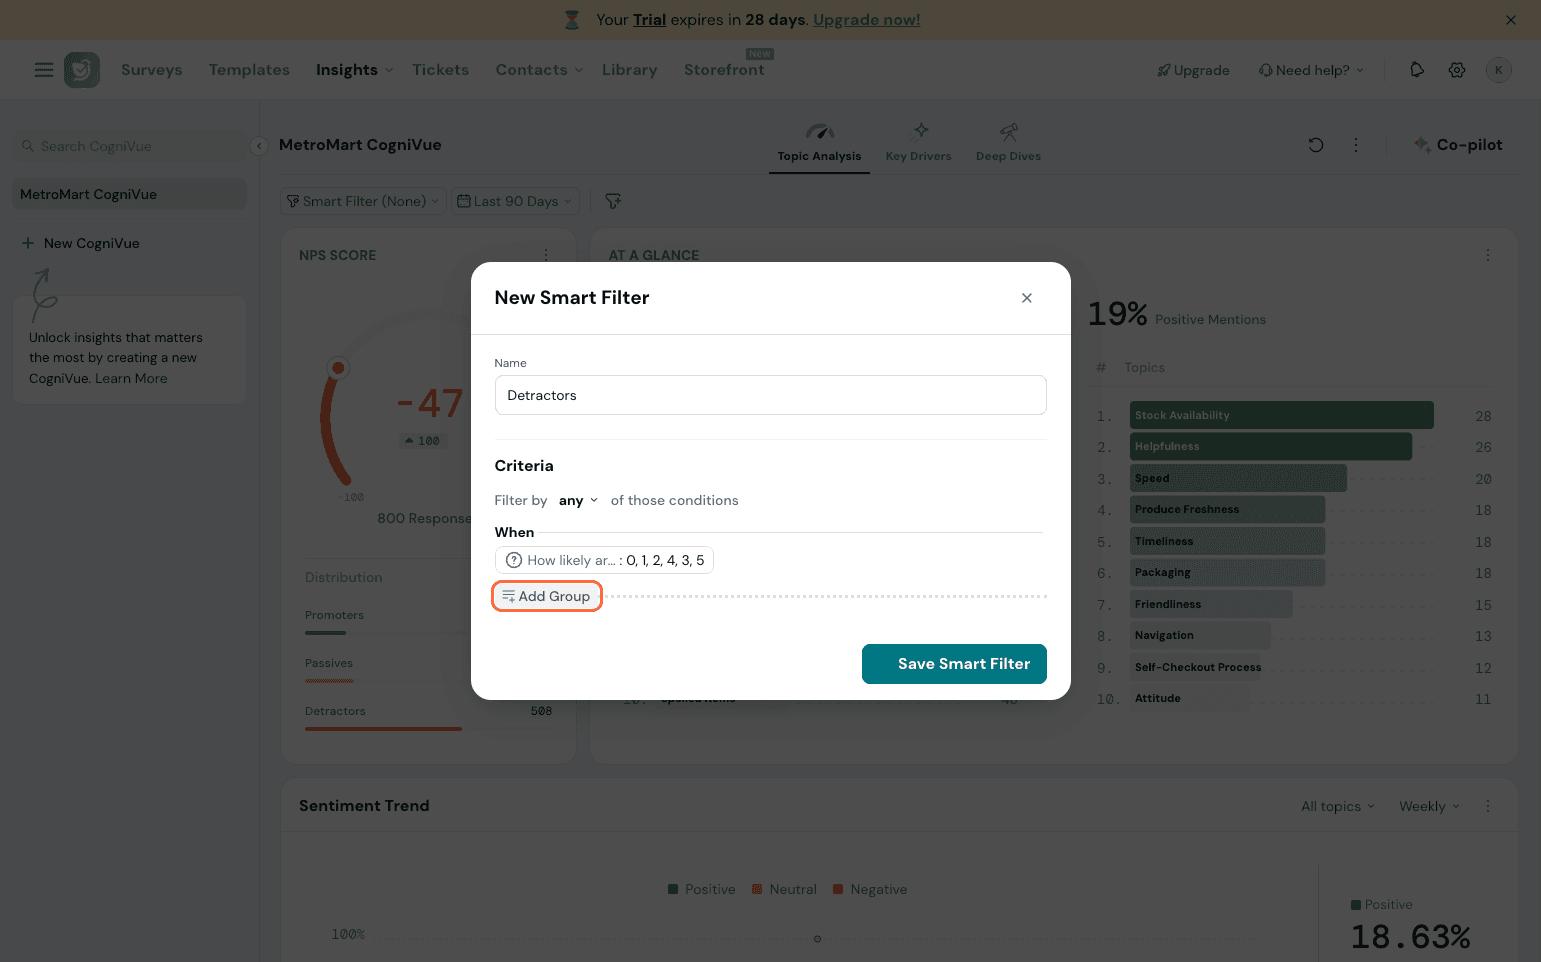
If you have more than one criterion in mind, click Add Group to add further conditions.
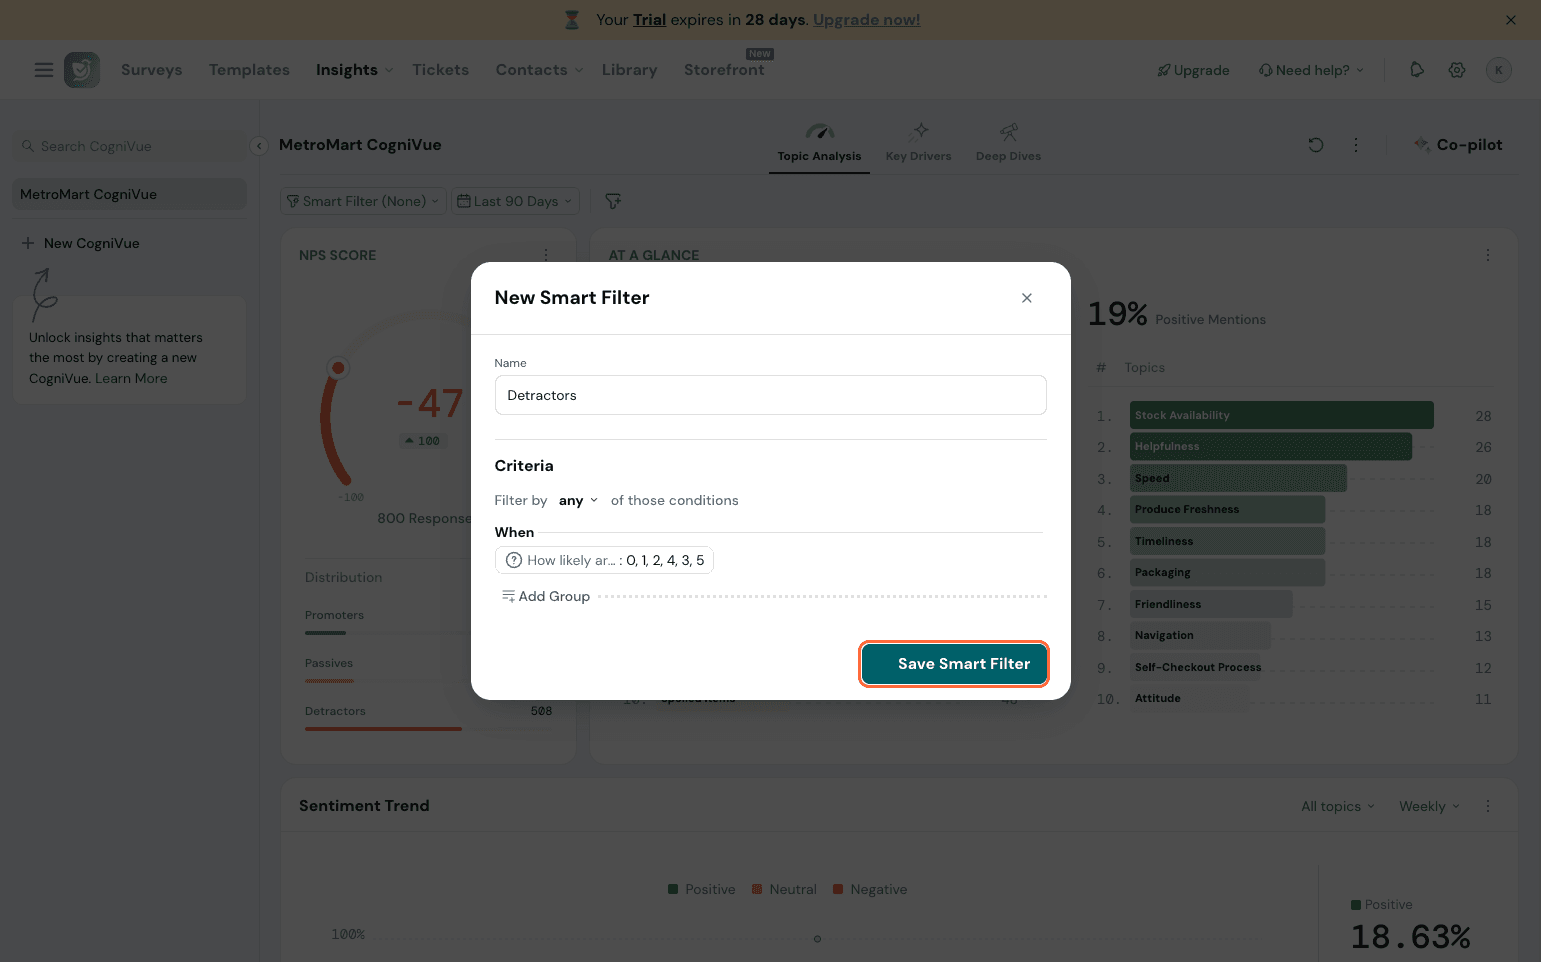
Once you have added all the particular filters you have in mind, hit Save to have the Smart Filter re-usable within the specific CogniVue.
Filtering
You can choose to filter into your CogniVue sections further with filters available independent of Smart Filters. Click on the filter icon, and you’ll see the following options:
If the source is a survey, the following Filters will be available at the topics tab level:
- Variables
- Share Channels
- Response Properties
- Smart Lists
- Sources (if it is a multi-source CogniVue)
- Question and Answer (if only a single source is used)
- Storefront (Hierarchy)
- If the user has created a location, then they can use the location filter in the dashboard
- This filter will change based on access - If someone only has level 1 access, other levels would be hidden
If the source is online review platforms, these would be the options available for filtering:
- Platforms
- Locations (this is indicative of the store location chosen as the source and not the internal storefront built)
Comparison Date Range
The next filtering option available is Time. You can choose to filter it to reflect only daily (Today), weekly, and more from pre-set filter options.
Along with filtering by Time period, such as last 7 days, last 30 days, this month, or a custom range, CogniVue lets you add a Comparison range. This helps you understand how your current period has changed when compared to another period, making it easier to spot improvements, declines, and shifts in customer sentiment and performance.
Now, you have extended customisability in the form of Comparison Range. With this, you can easily compare and see the data change over a time period. It can be fixed ranges or custom date ranges as well. You can read more about it in this article.
Actions
Click on the 3 dots on the side of any of the CogniVue tabs.
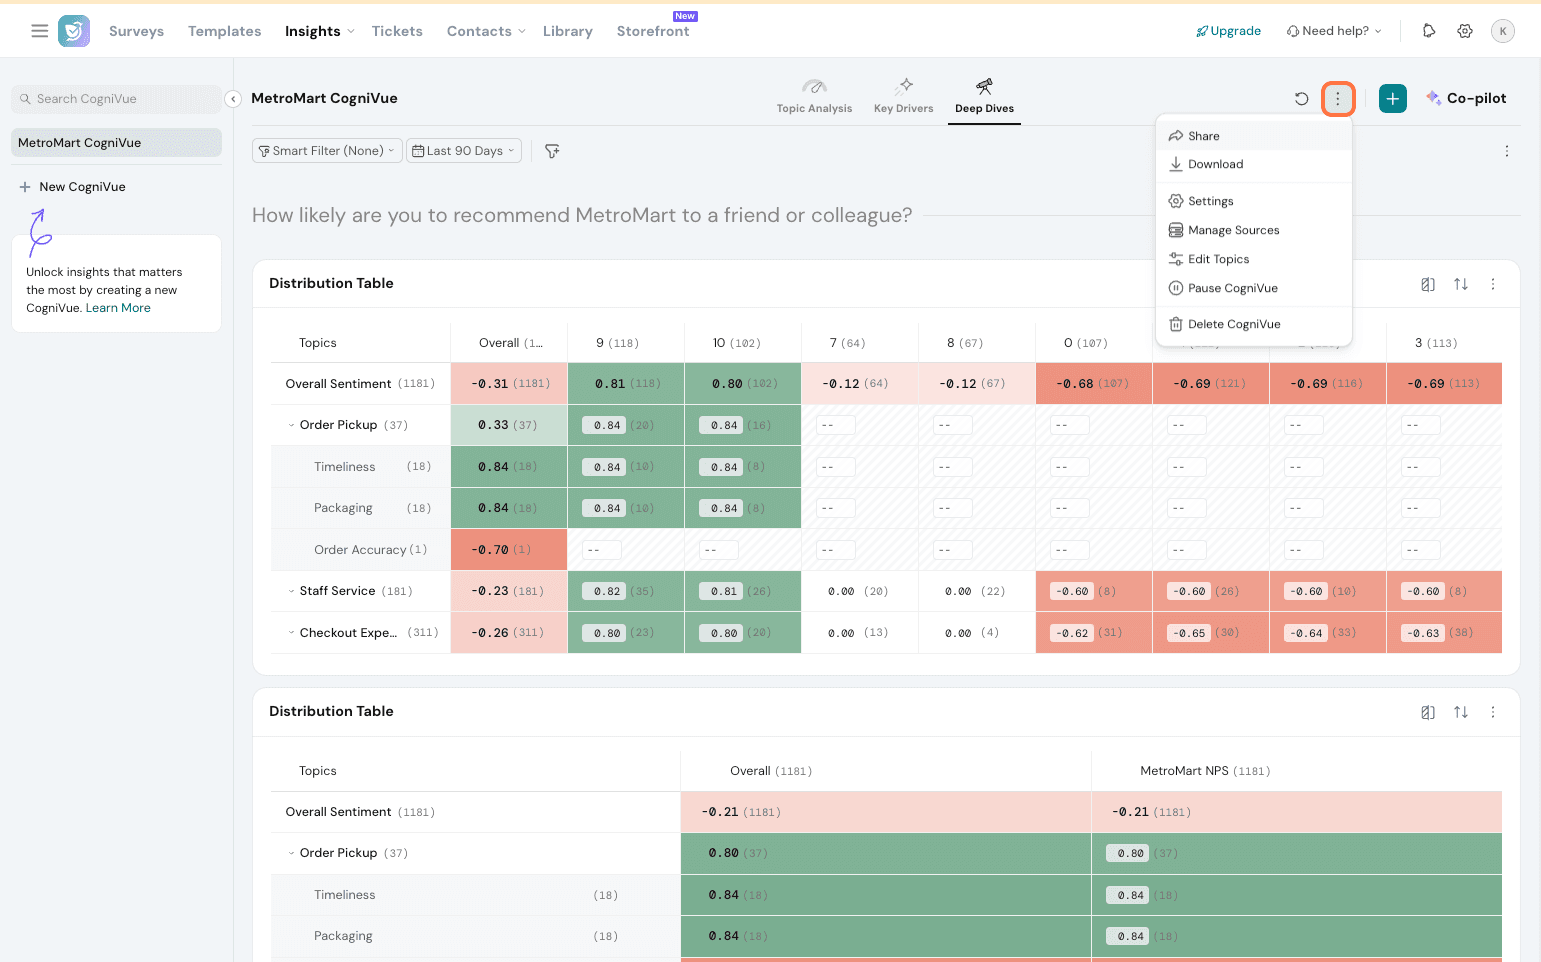
From here, you can perform any of the following actions.
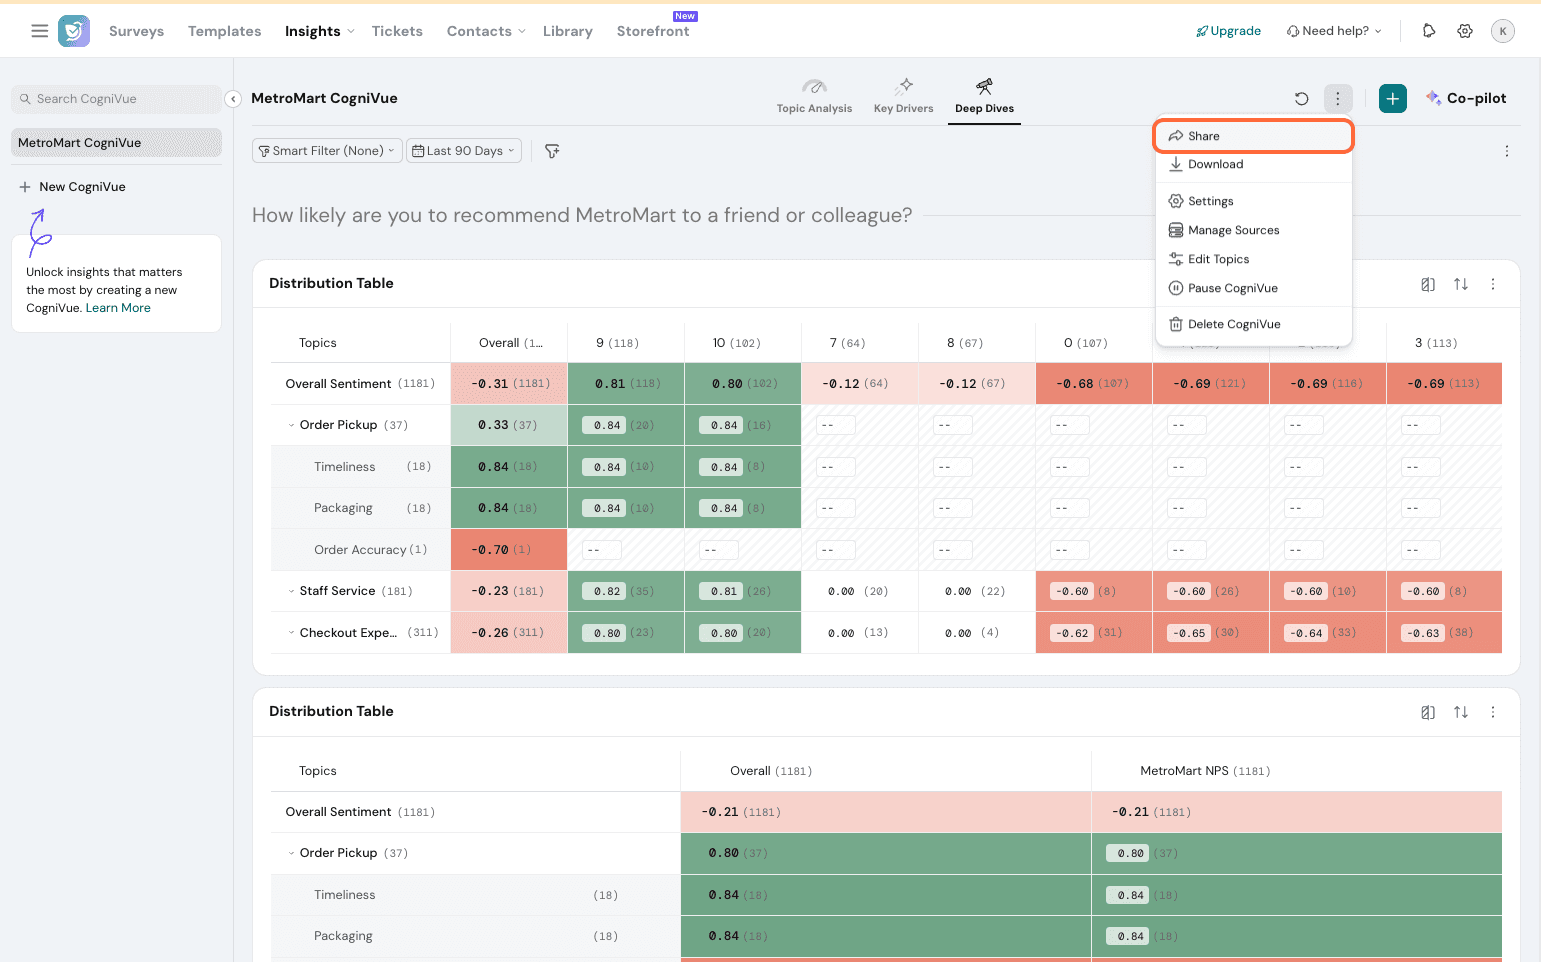
Sharing
You can share CogniVues and give specific access to people. Click on Share.
In Custom, you have more control over the exact actions the user can perform. Click on Custom.
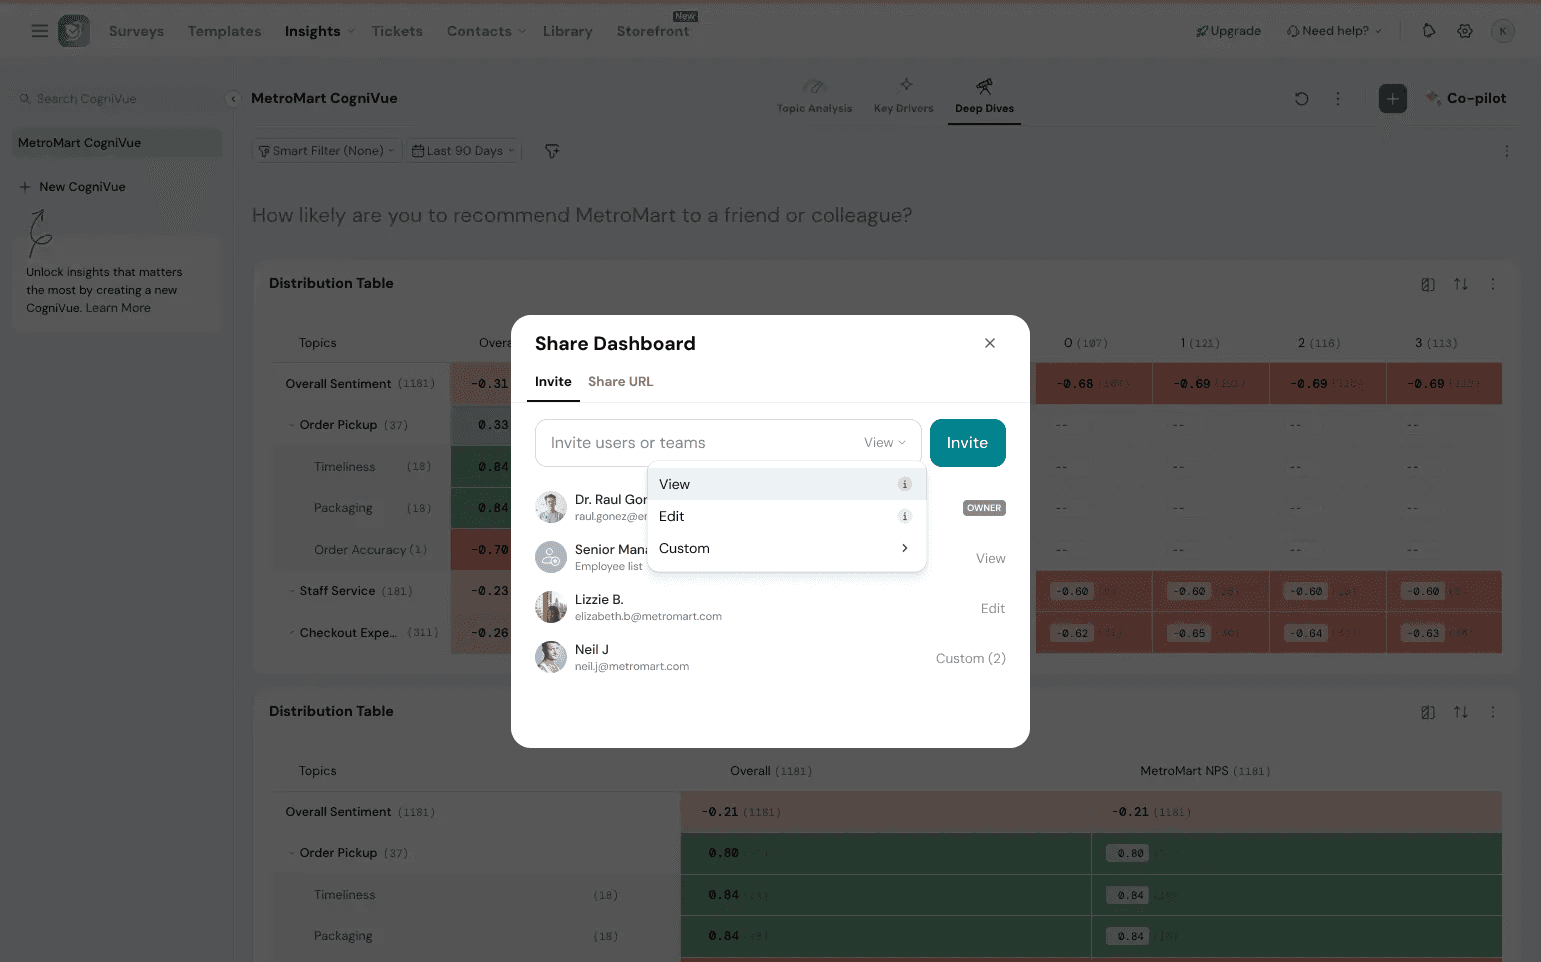
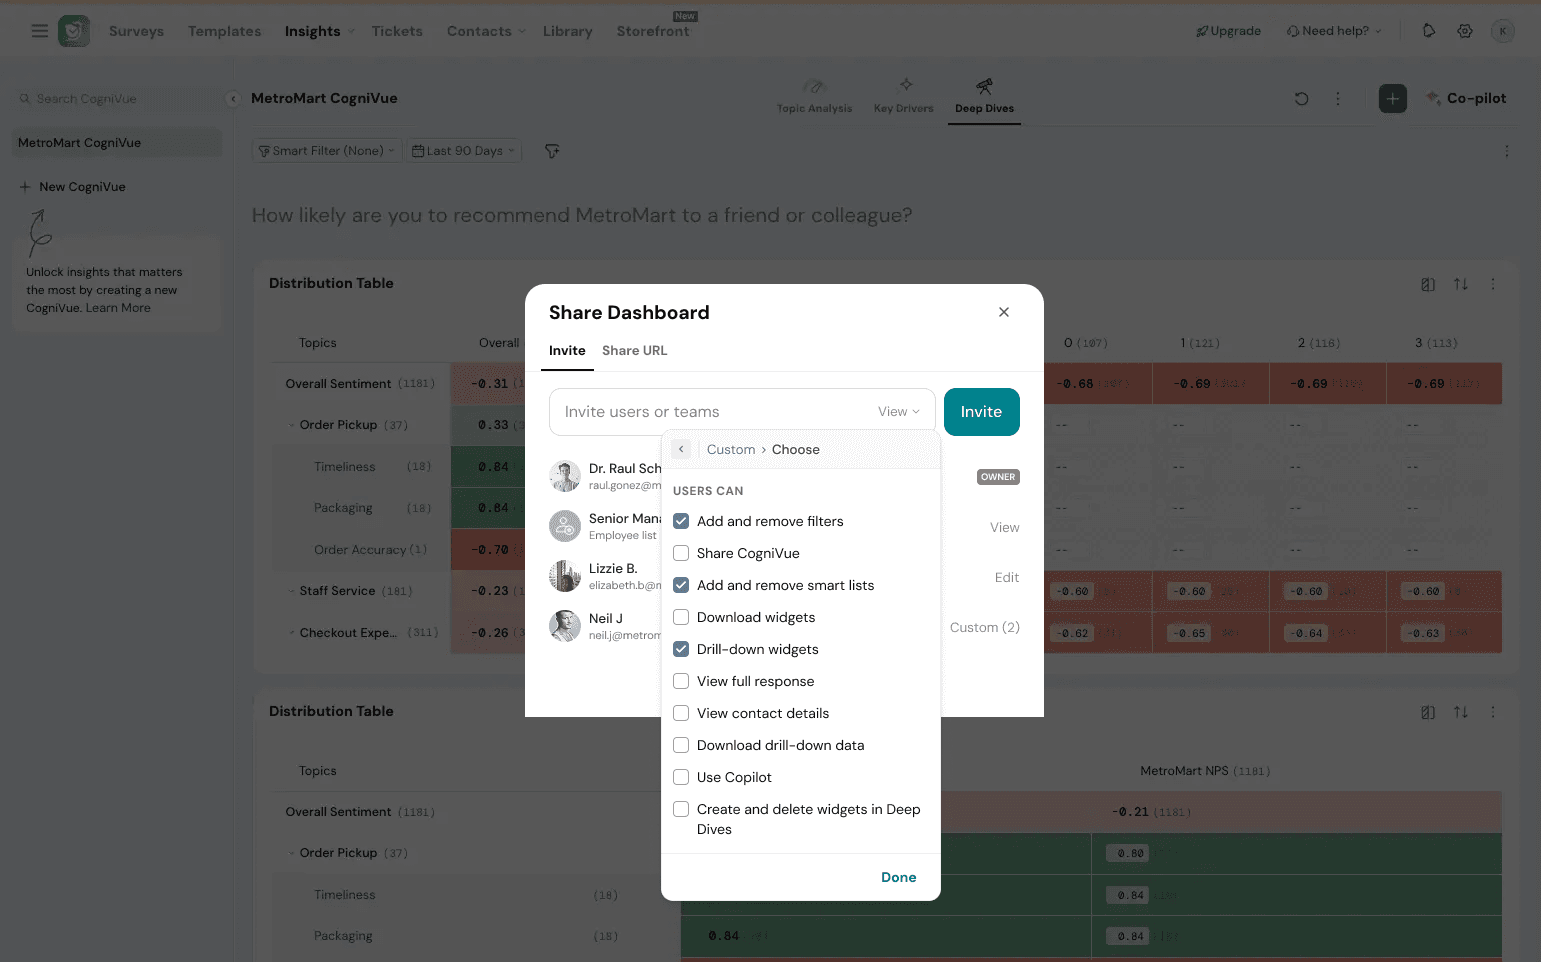
Then send an invite.
Note: The person needs to be added as a user to your account to be available in the dropdown.
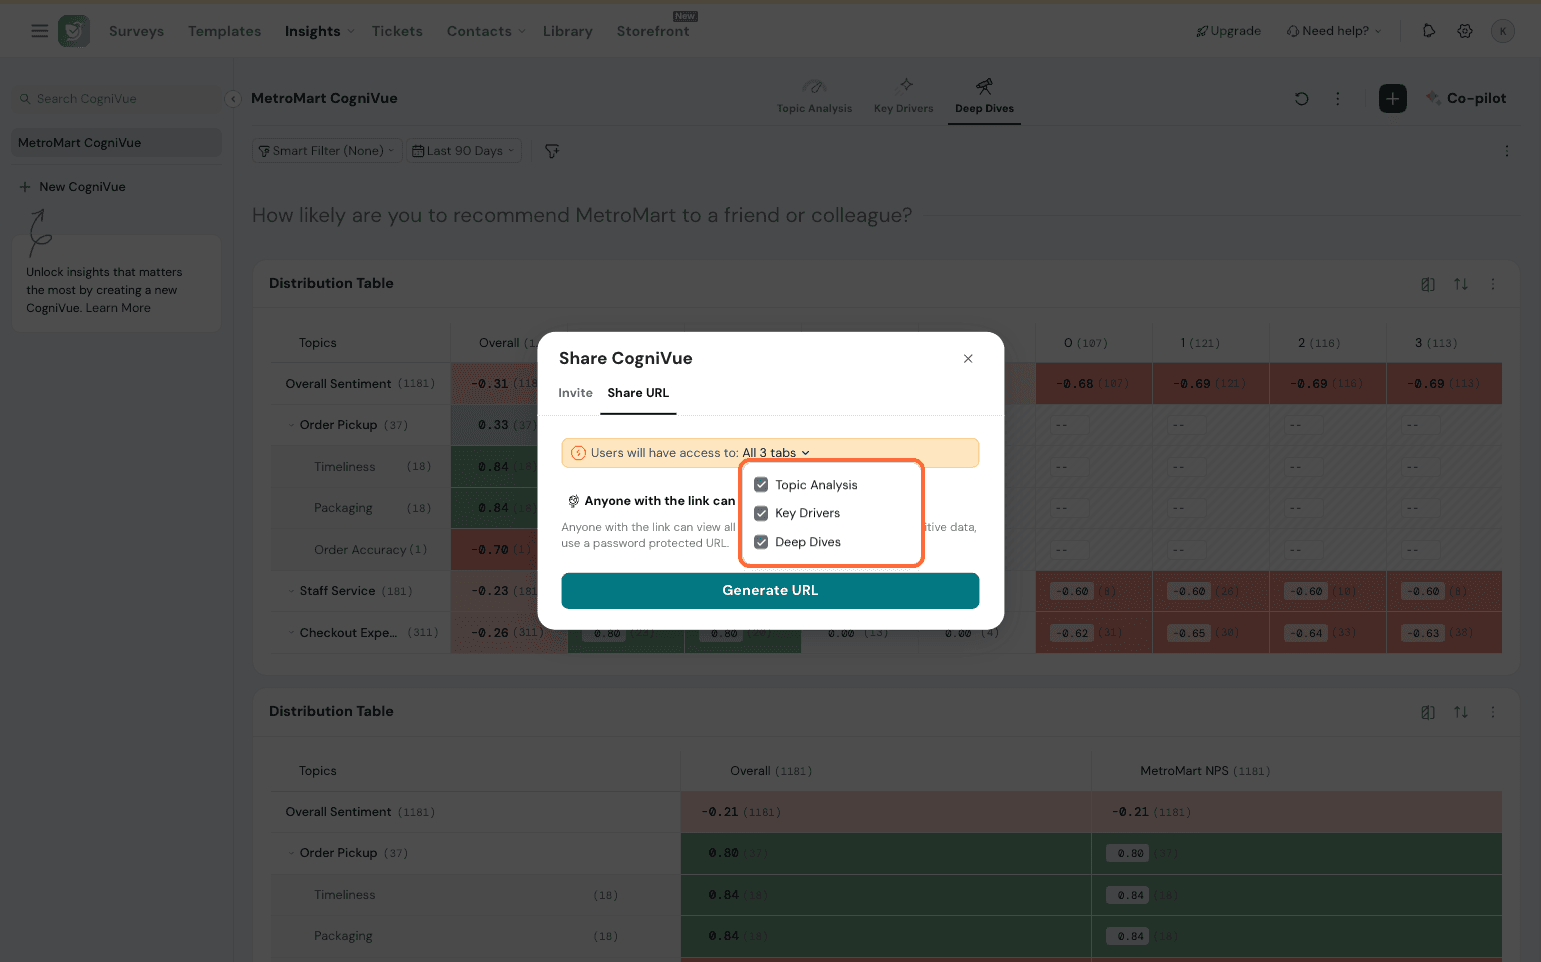
You can also share a CogniVue as a publicly accessible link. Here, you can choose if the viewer can access all tabs or needs access to specific tabs for viewing.
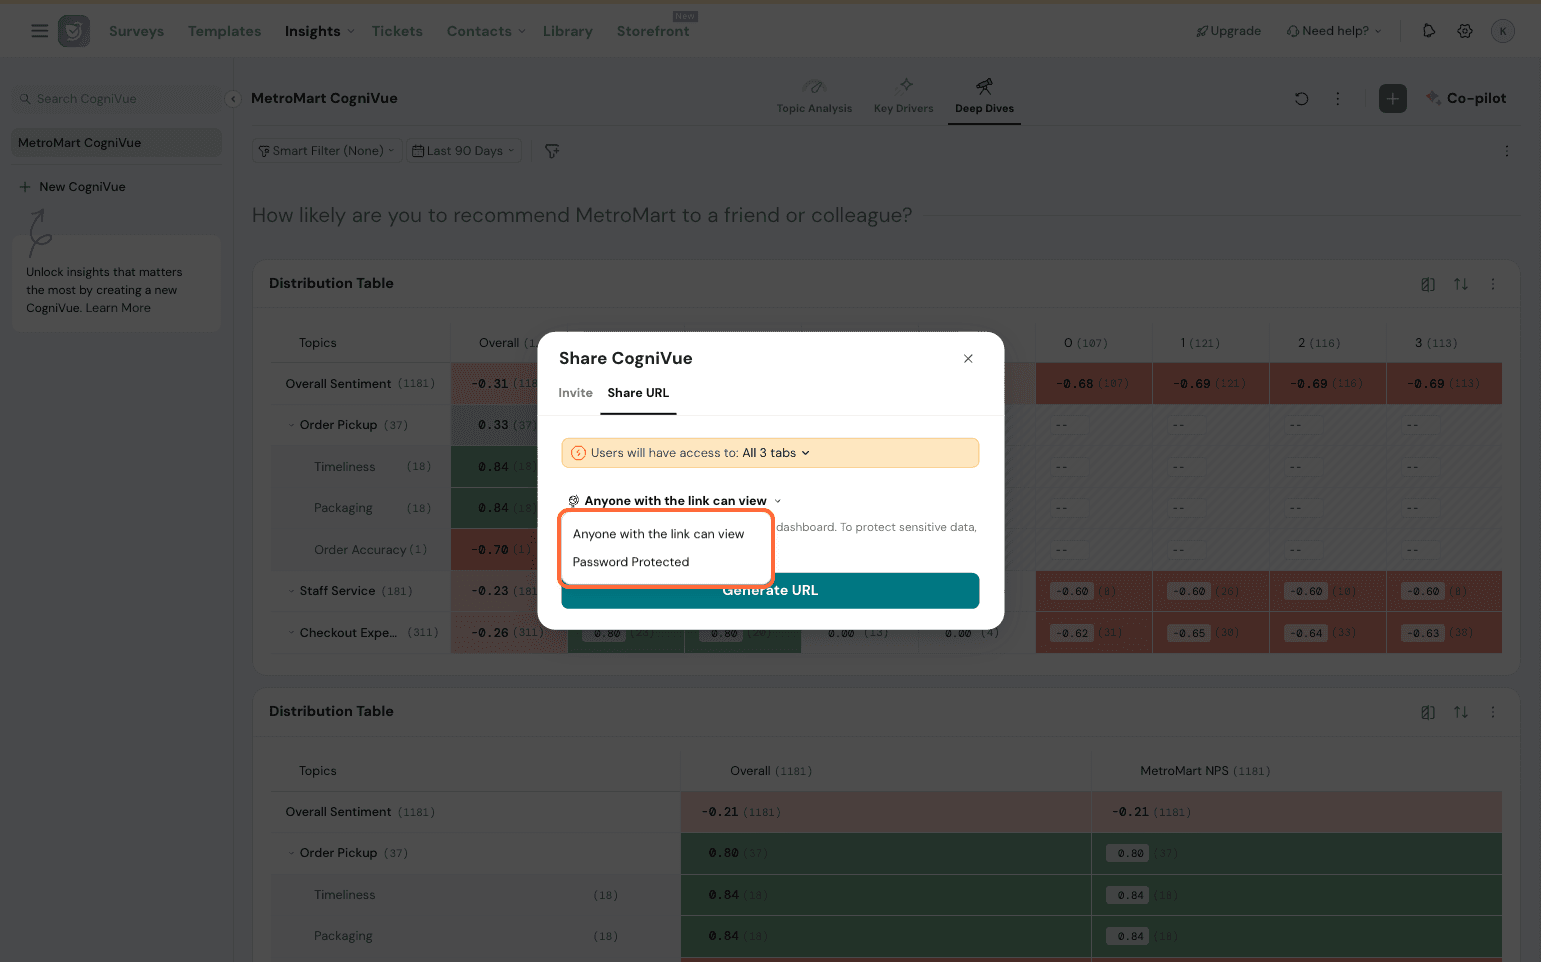
You can password-protect the CogniVue. Simply select the dropdown here and switch it to password mode.
Go with the default password or make your own. Once done, click Apply.
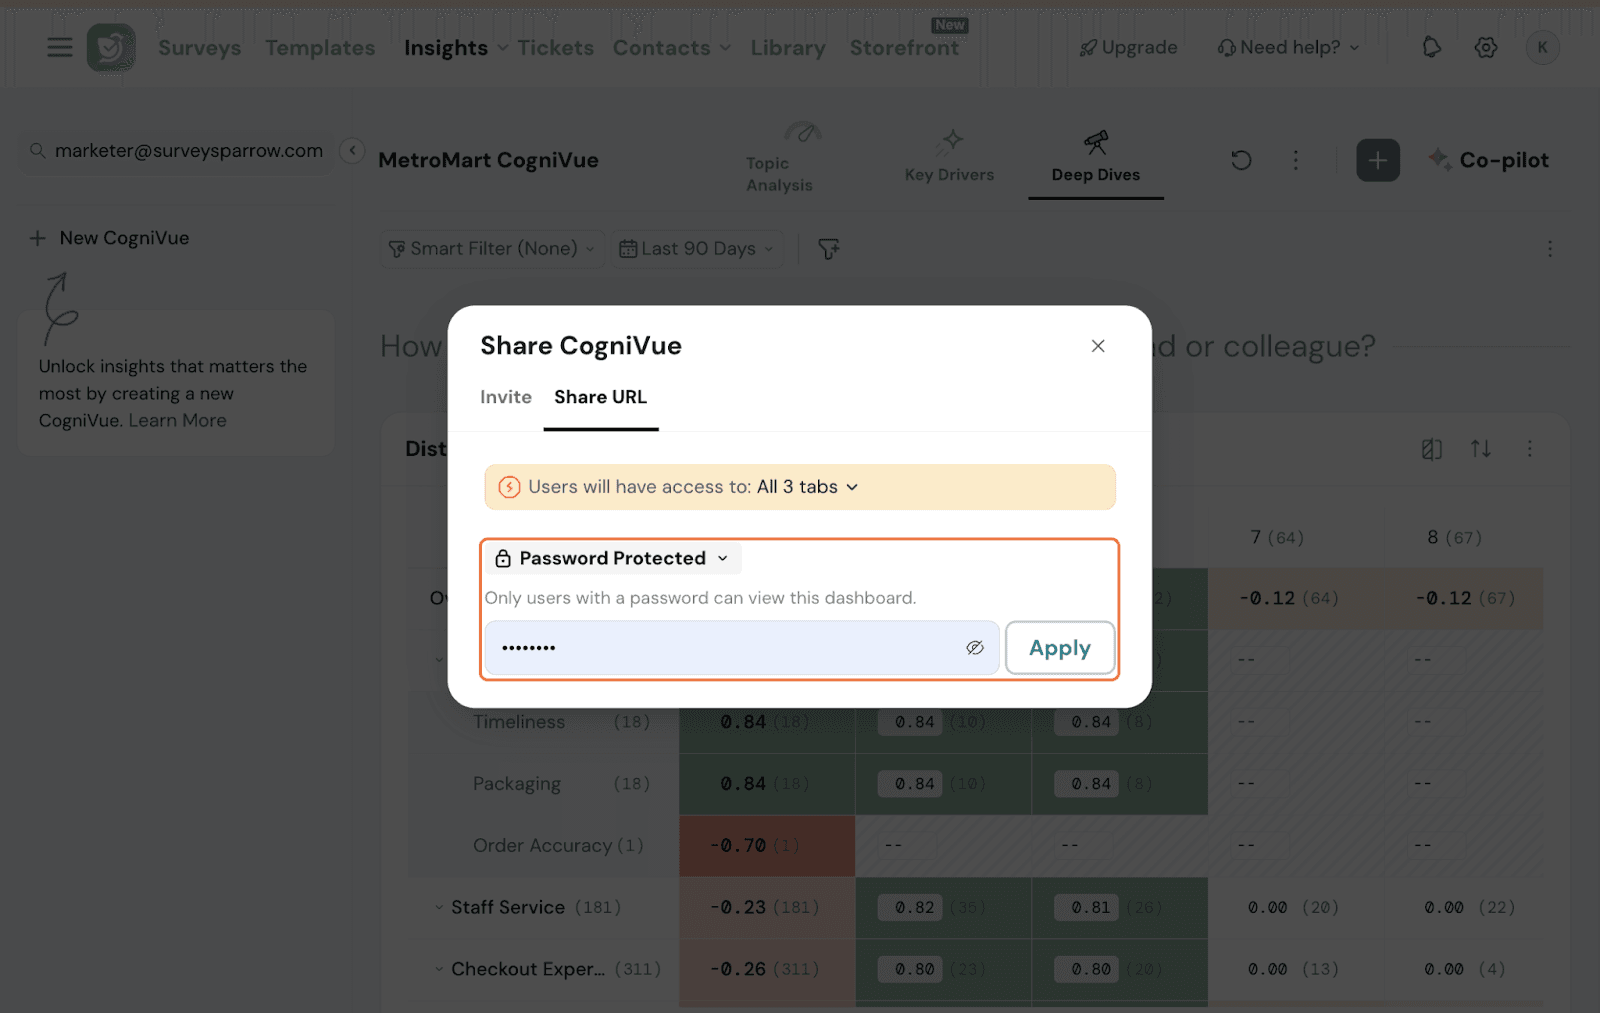
Copy the public URL below and share it with the specific people who need access to this CogniVue.
Note: AI summaries are not available in shared/public views of CogniVue.
Download
You can download your CogniVue. Click on Download.
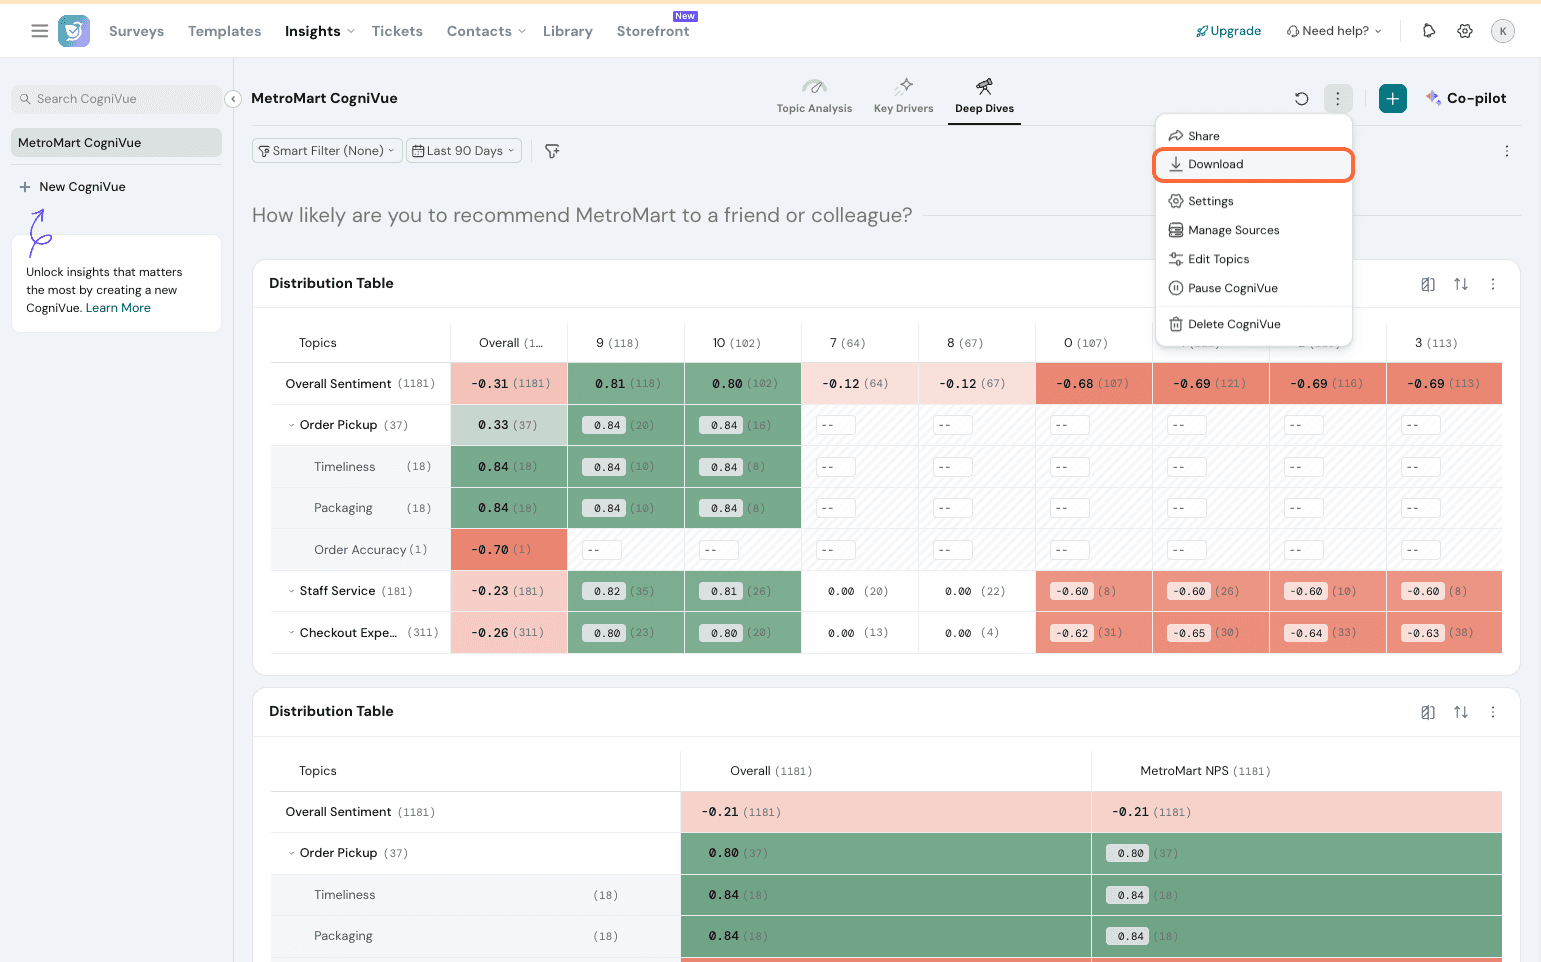
Here, you have by tabs or by Responses.
Under Tabs, you can choose if the entire CogniVue must be downloaded or just specific tabs like Topic Analysis or Deep Dives.
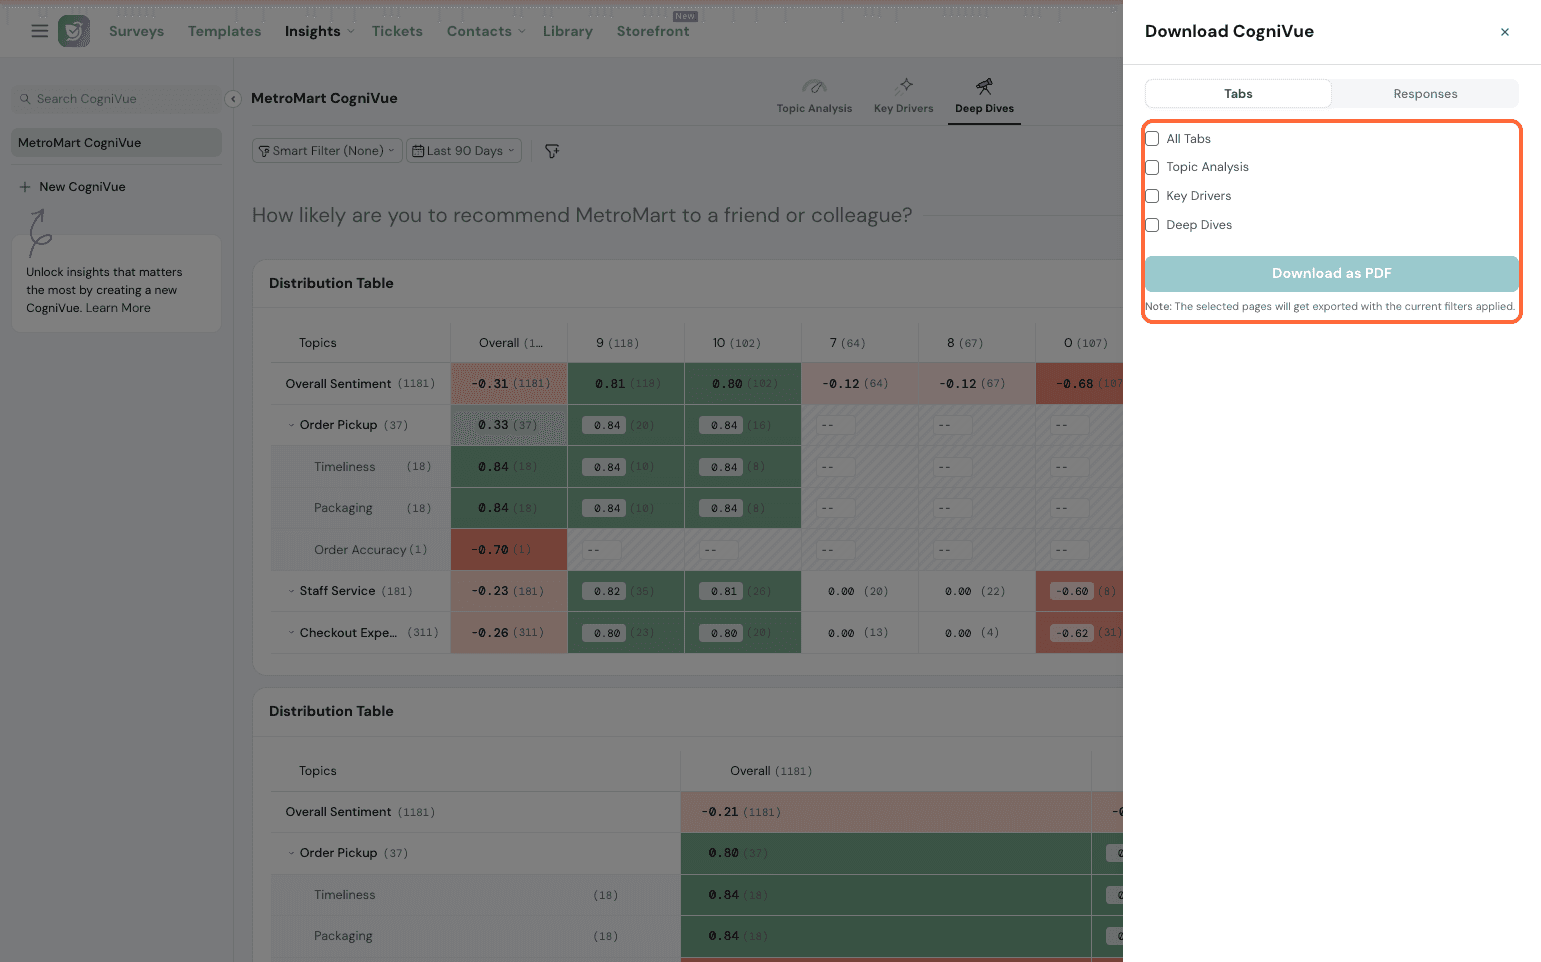
It will be downloaded as a PDF with the current filters you have inside the dashboard applied automatically.
Under Responses, you can download the responses directly from here. You can choose to include contact properties, metadata, and variables if you choose to.
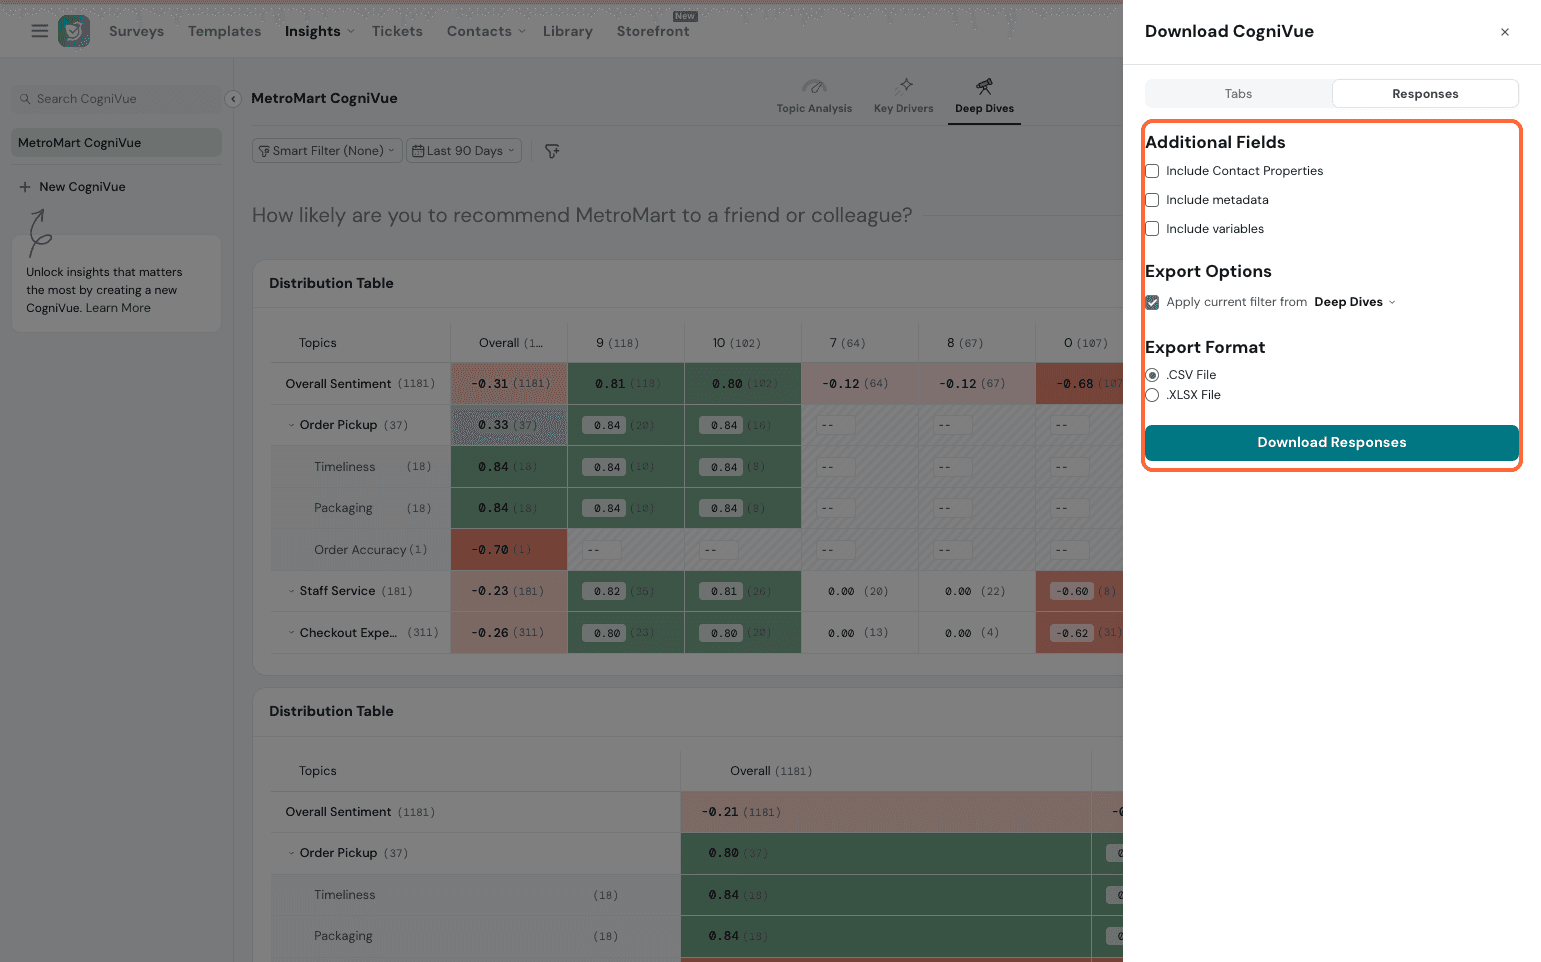
Choose which current filters you want to be applicable when exporting, whether it be the filters under Deep Dives or the Key Drivers tab.
Here, only CSV or XLSX formats are supported. Choose which format you prefer and download it.
Settings
Under Settings, you have the following tabs.

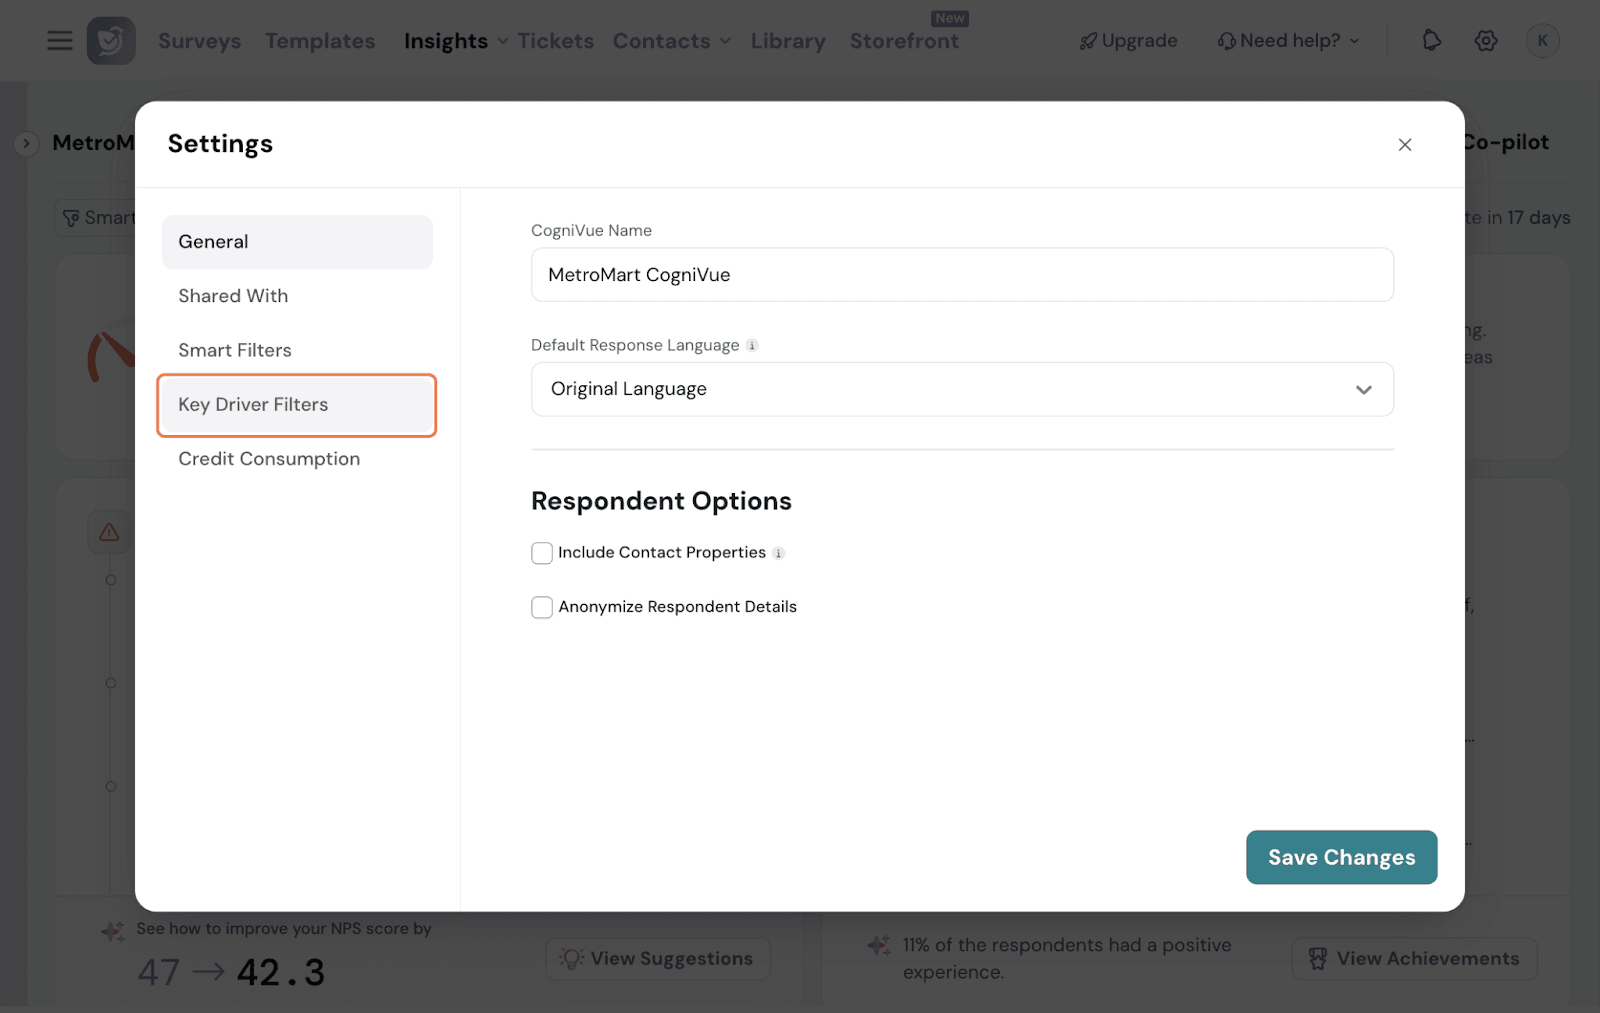
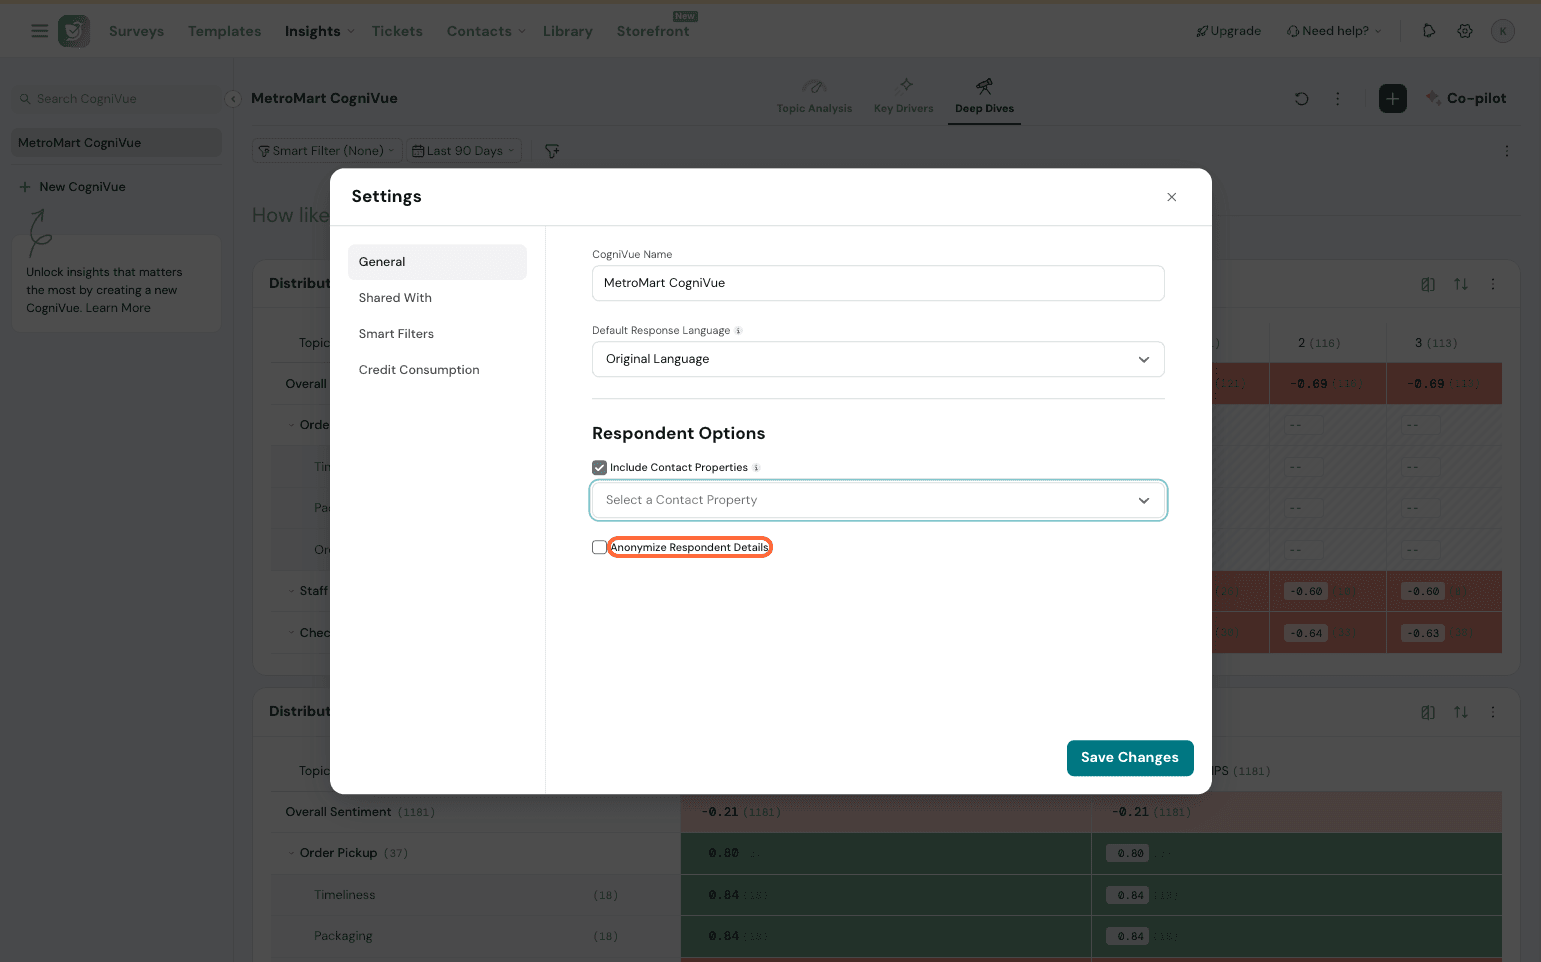
General: Here, you can edit the CogniVue name and choose the Default response language.
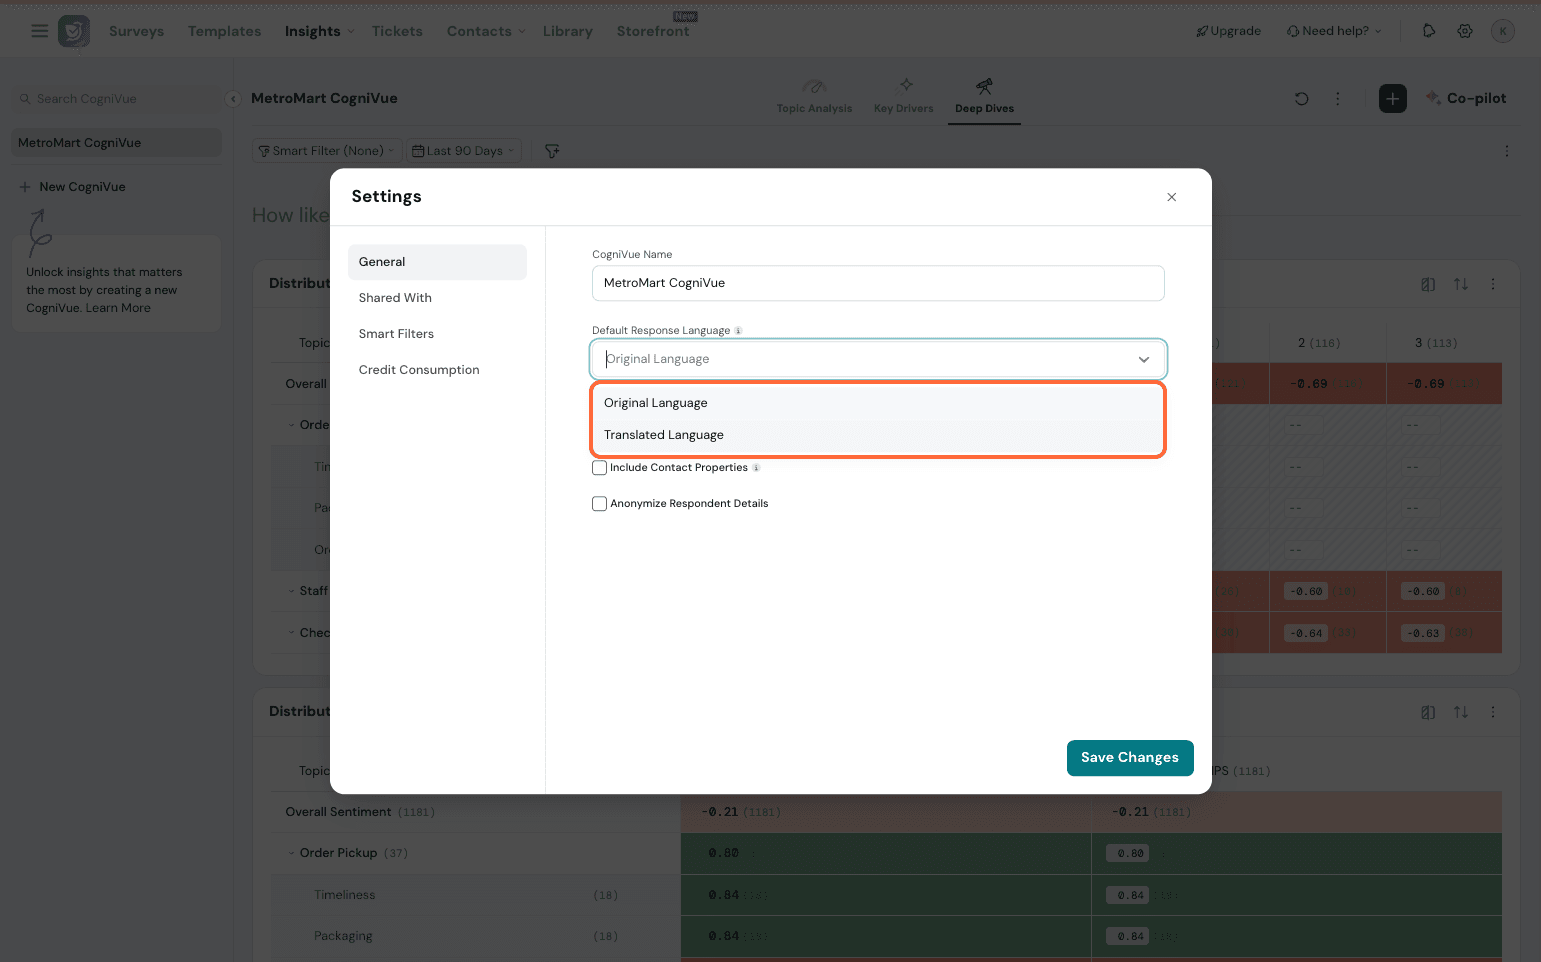
You can also choose if you want to include contact properties to appear when you drill down into the responses.
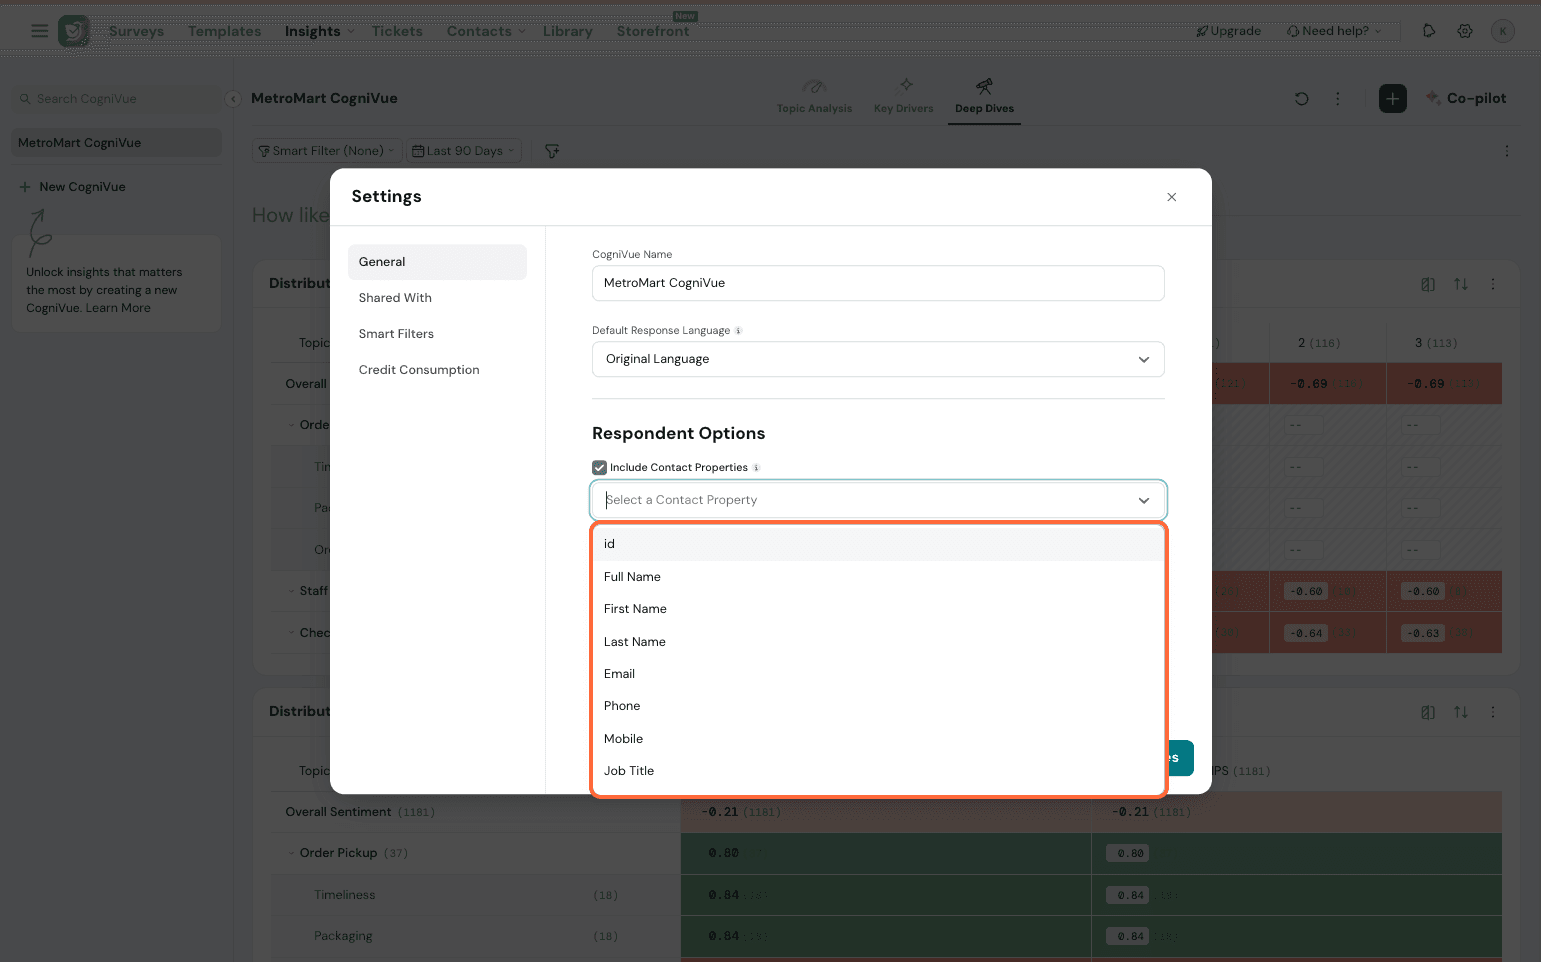
If you are sharing your CogniVue with others and prefer respondent anonymity, click on the Anonymize Details option for the same.
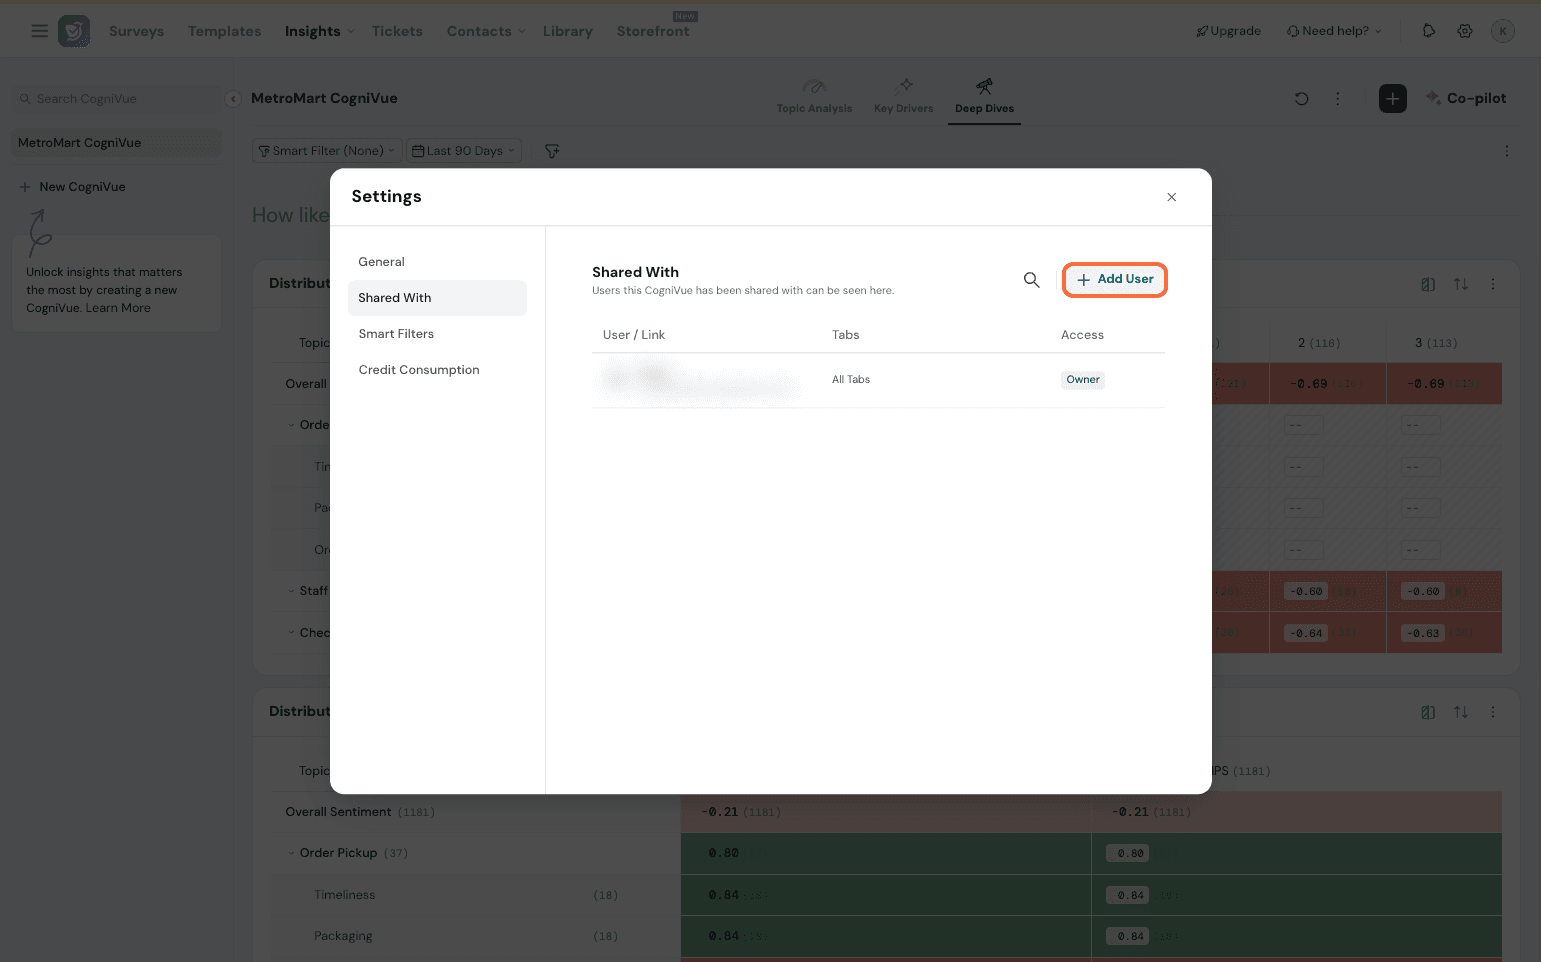
Shared with:
This helps you to monitor the invited users to your CogniVue and the specific access they have. You can see the tabs they have access to and their access level (viewer, editor). You can add new users from this screen as well.
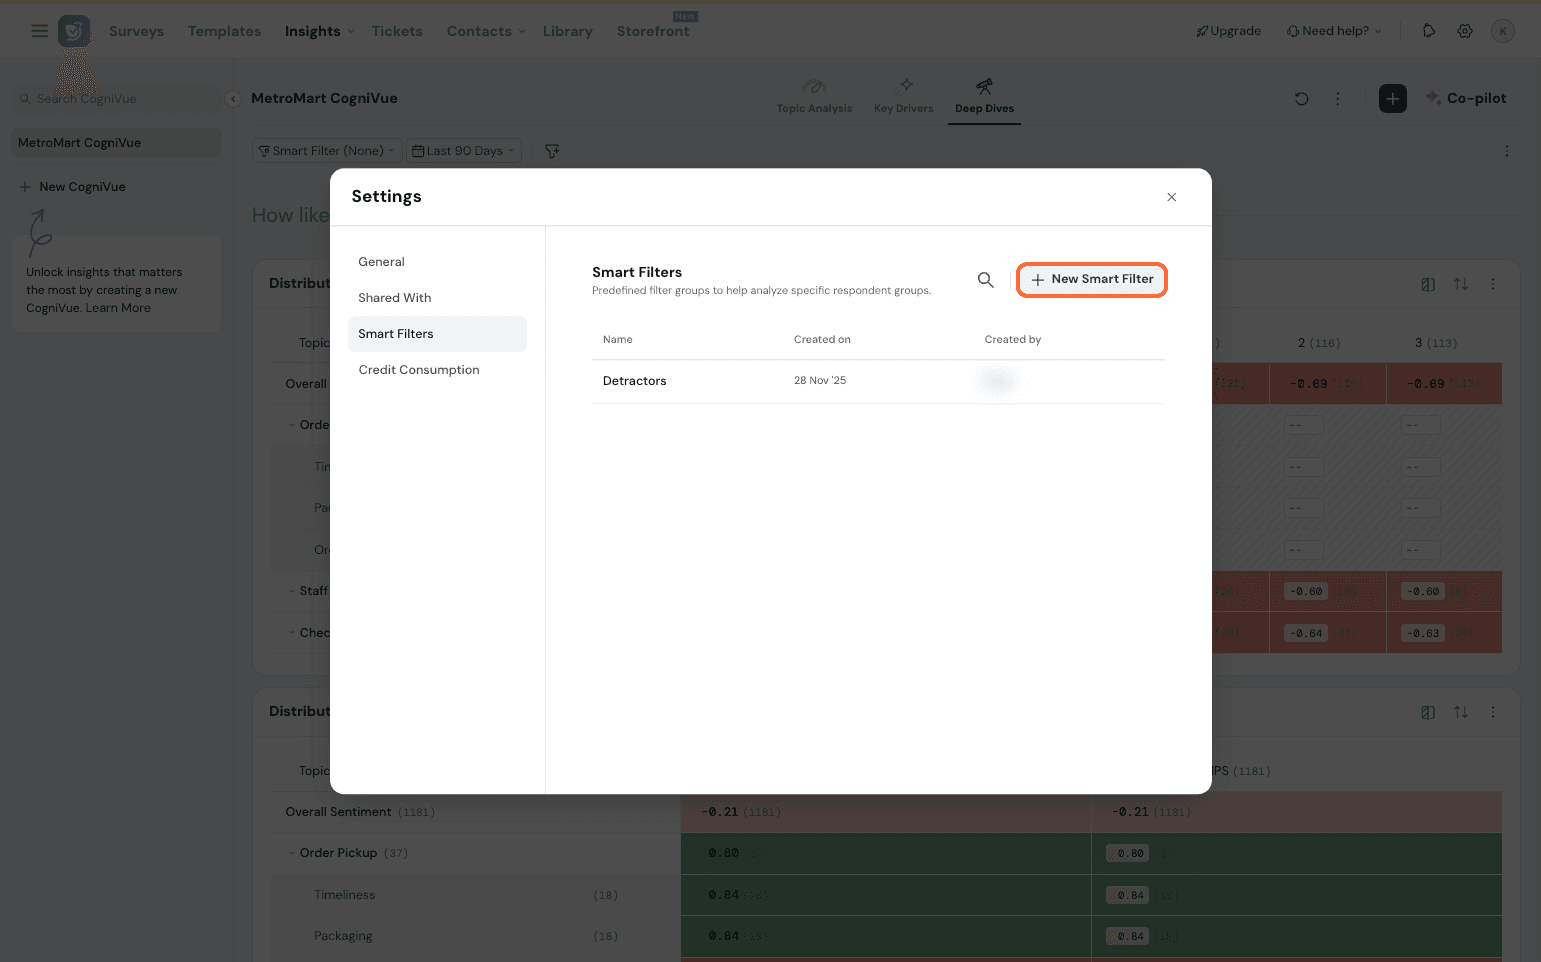
Smart Filters:
The Smart Filters created and stored in the CogniVue tabs are displayed here. You can see when it was created and by which user. New smart filters can also be created from here.
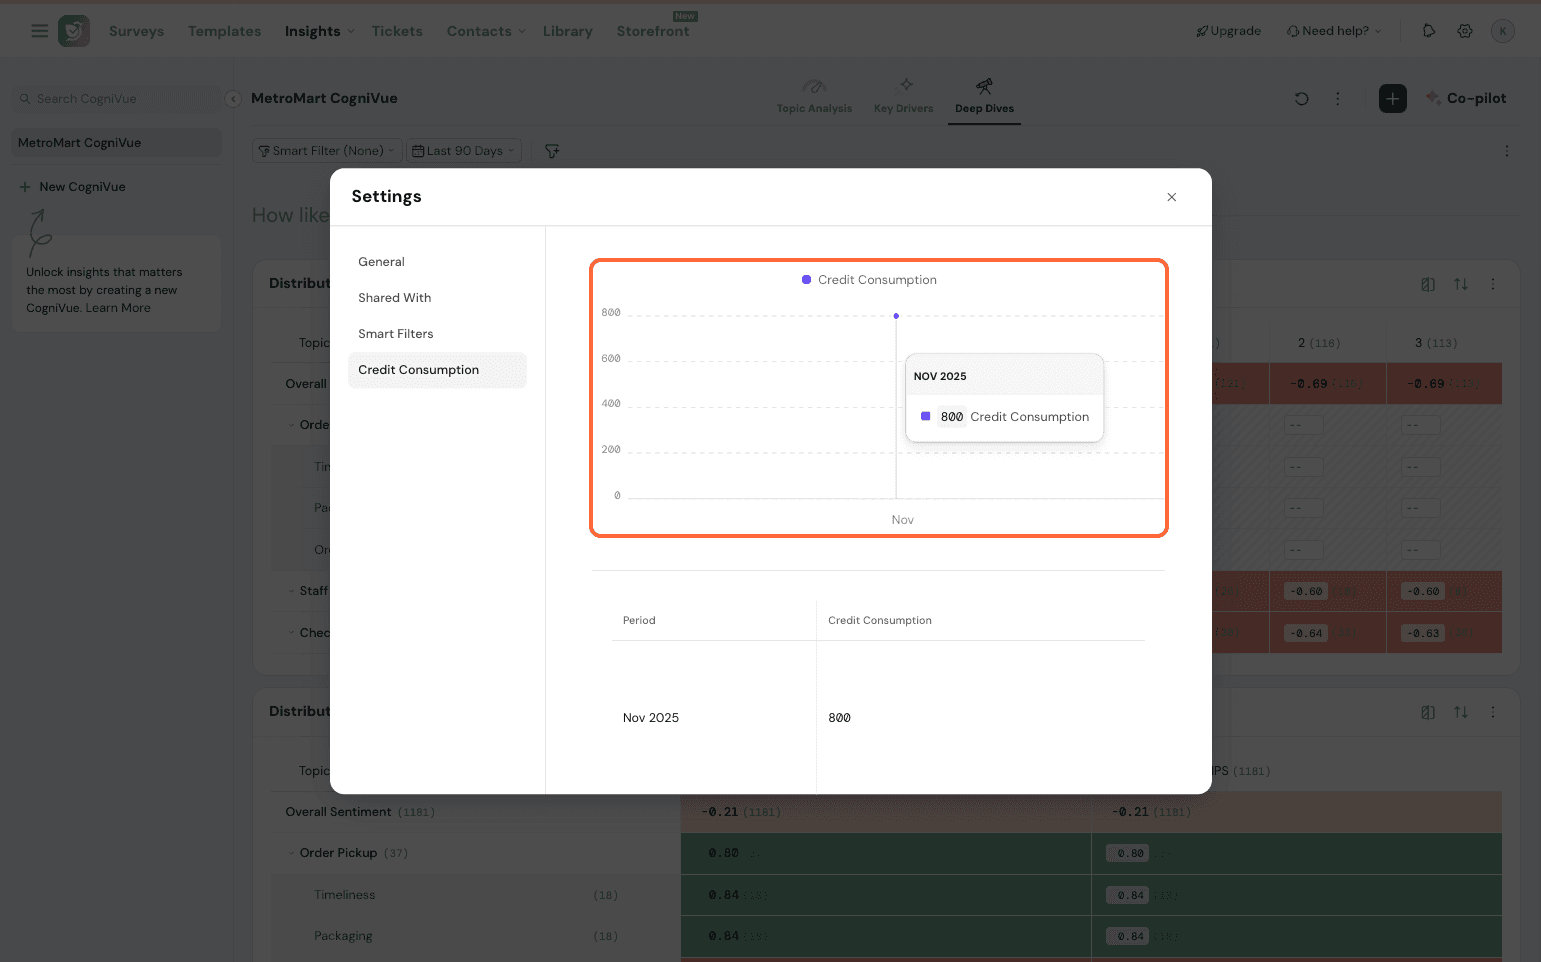
Credit Consumption:
This displays the exact credit consumption happening and shows the trend across time periods.
Manage Sources
If you’d like to add a new source or edit the source for the CogniVue anytime, you can click on this and configure the sources as you please.

Once you click, you’ll be taken to the configuration page, which came up when initially setting up.
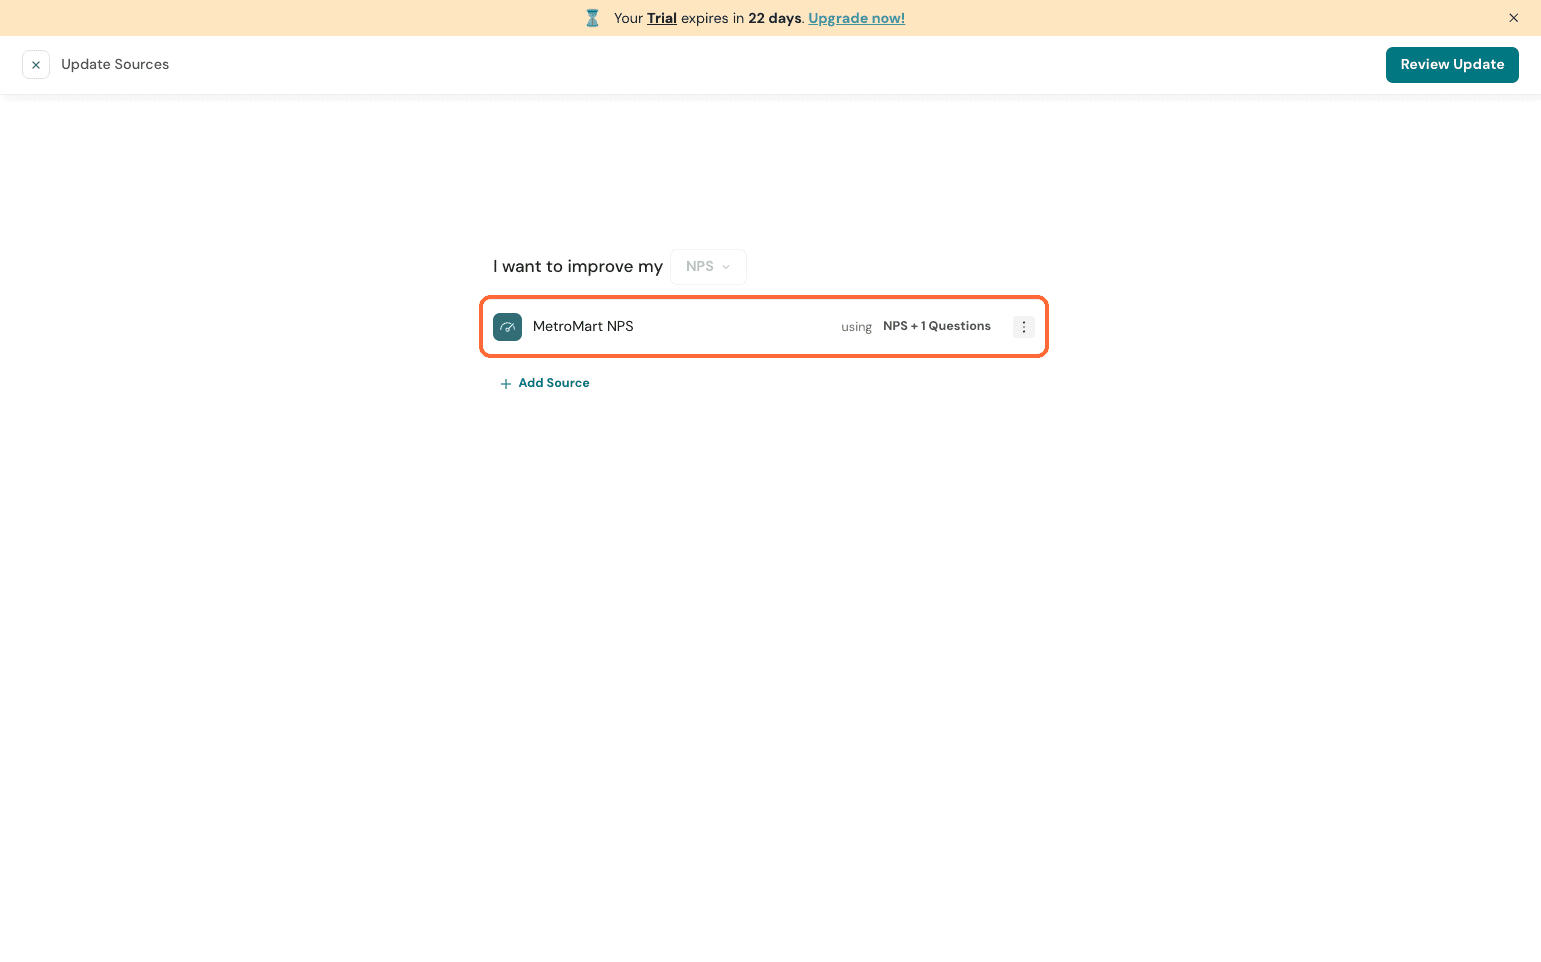
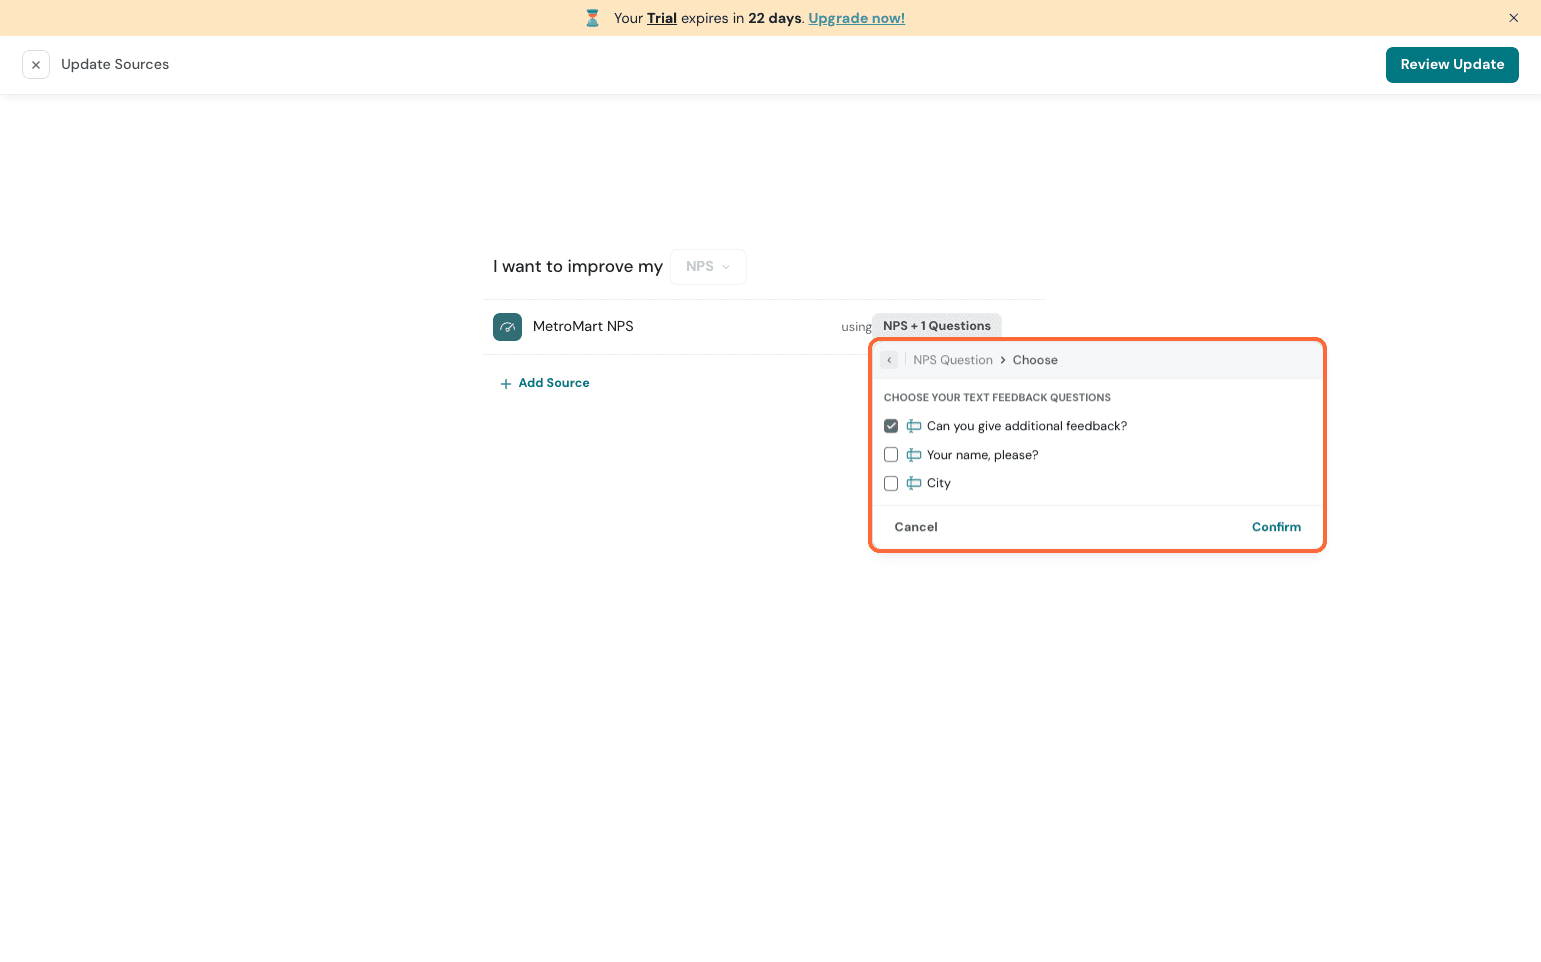
You can edit the metric monitored (from NPS to CSAT if you prefer), the scale question added, or remove the survey itself as a source.
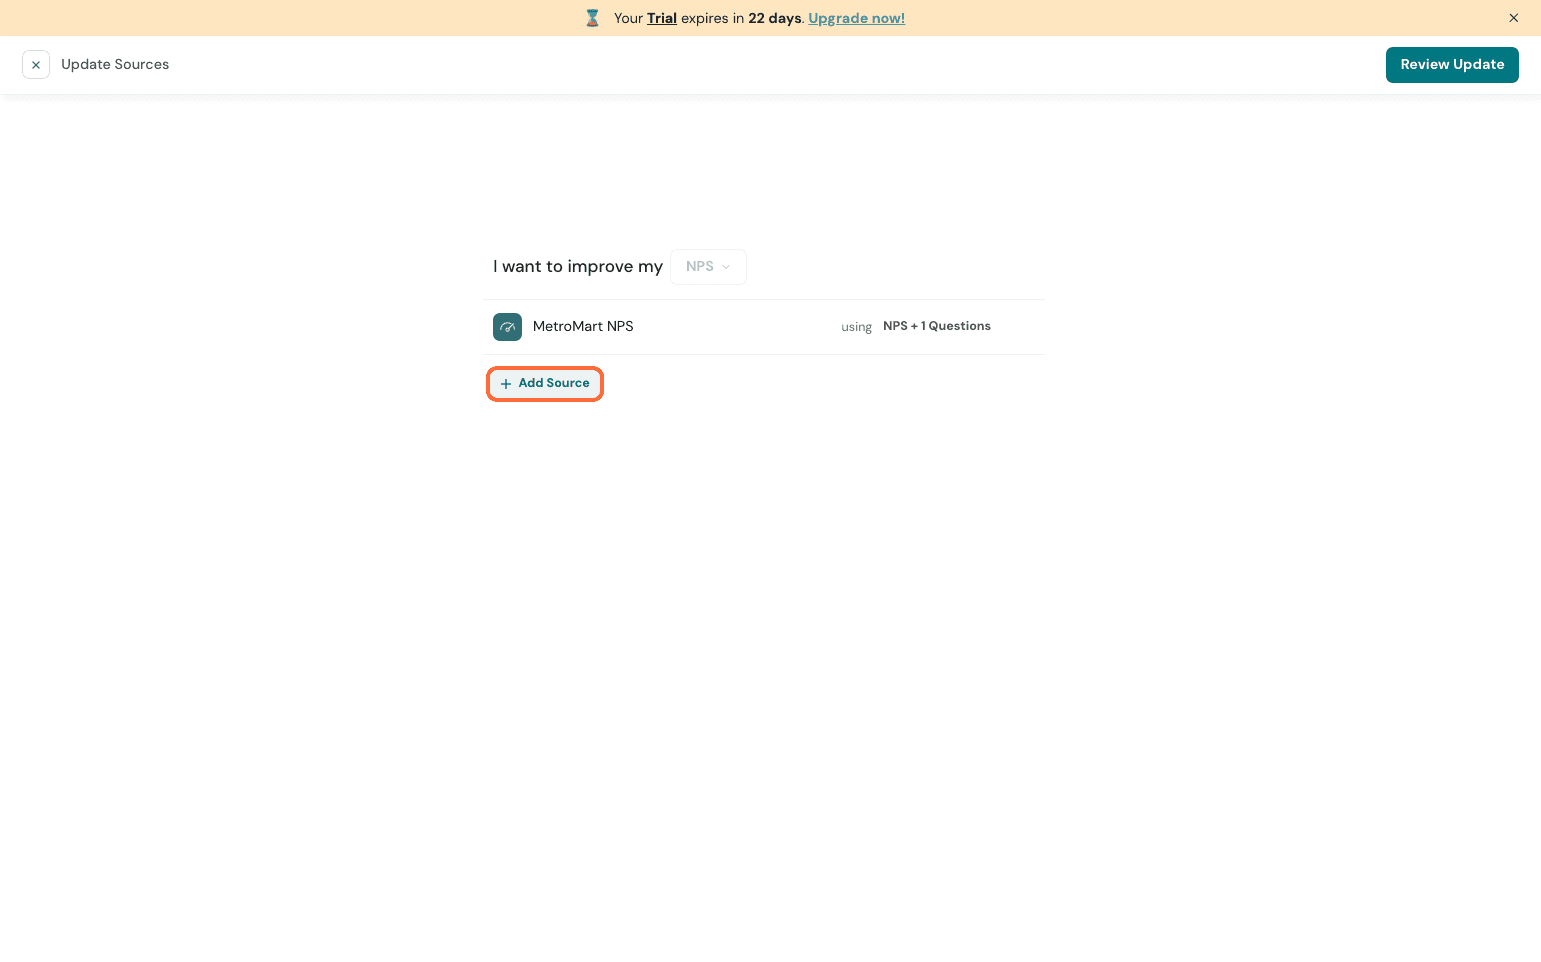
You can click on Add source and add more if you wish.
Once configured, the new credits consumption is displayed, and you can choose if you wish to sync historic data. You can also opt in if you wish to resync data to update the Key Driver. Credit consumption varies depending on the scale of historical data synced and the options opted for.
Note: If you choose to resync, you may lose existing data.
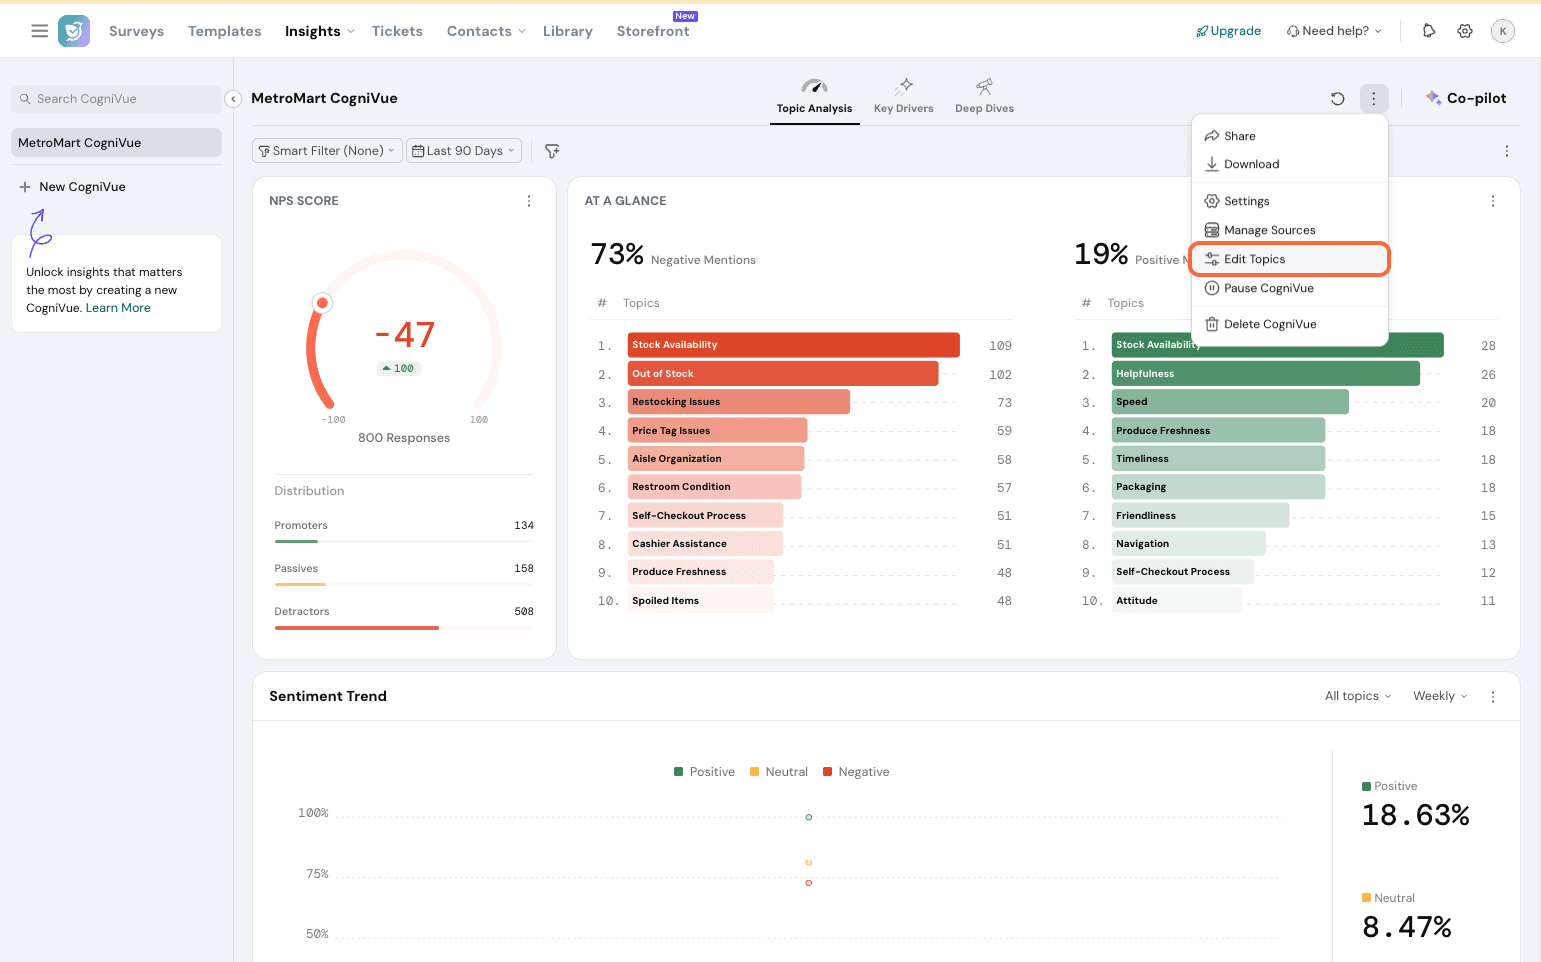
Edit Topics
You can edit topics configured and set up if you feel they don’t best represent your business.
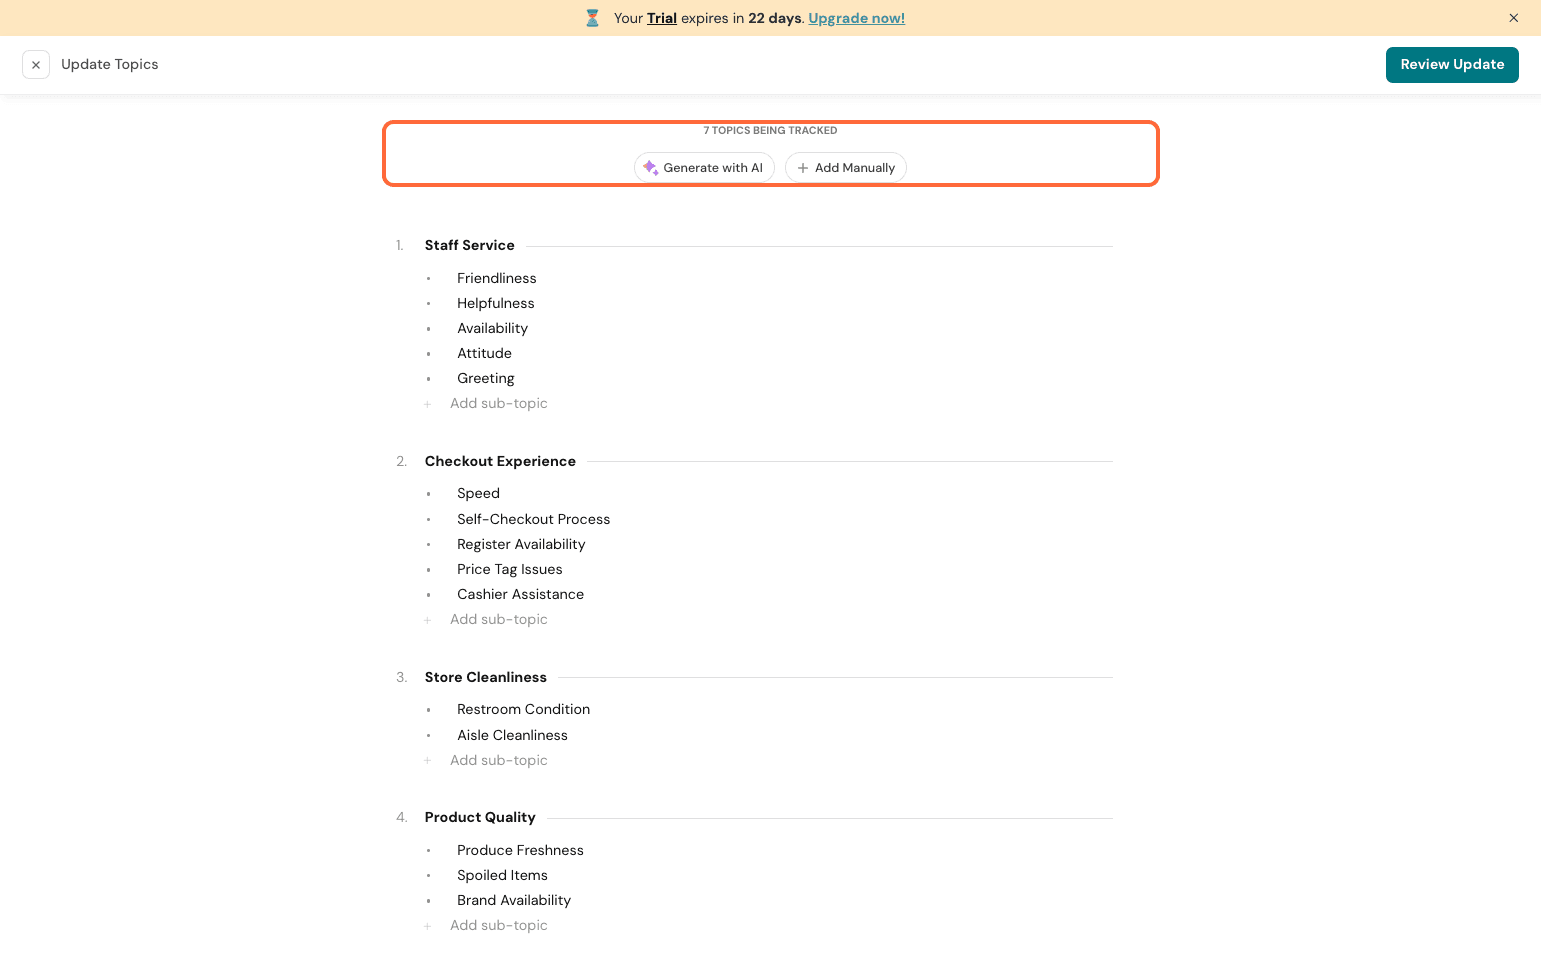
The process is the same: you can prompt AI to refine or edit/add manually.
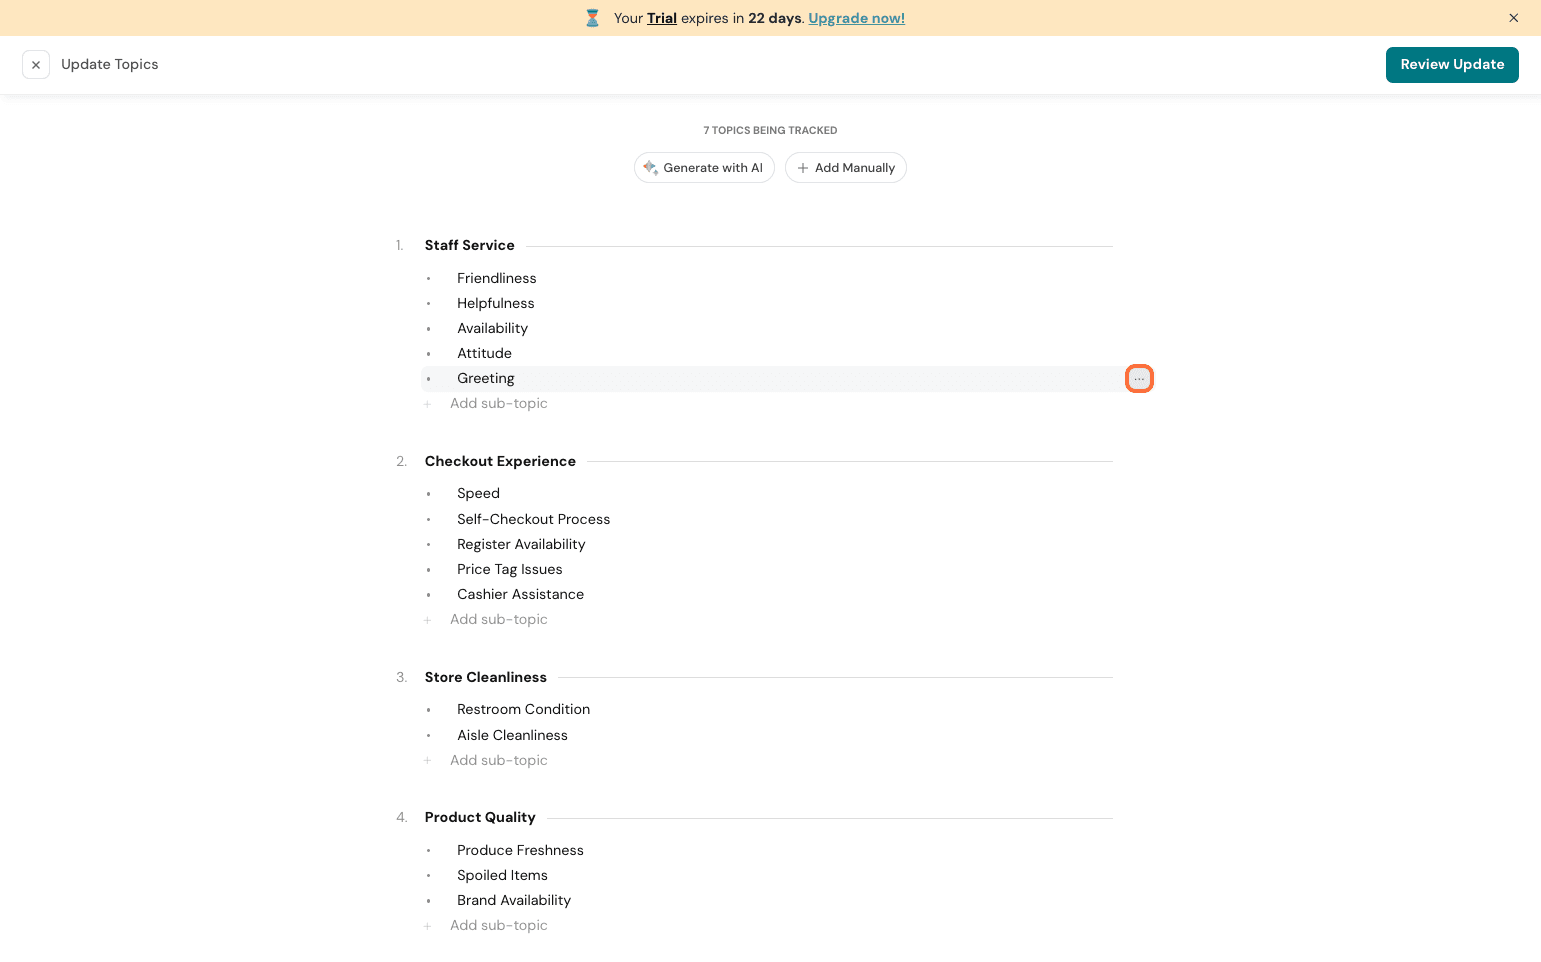
If you are editing a specific topic/subtopic, you will find 3 dots on the right side.
Once clicked, you get 2 options:
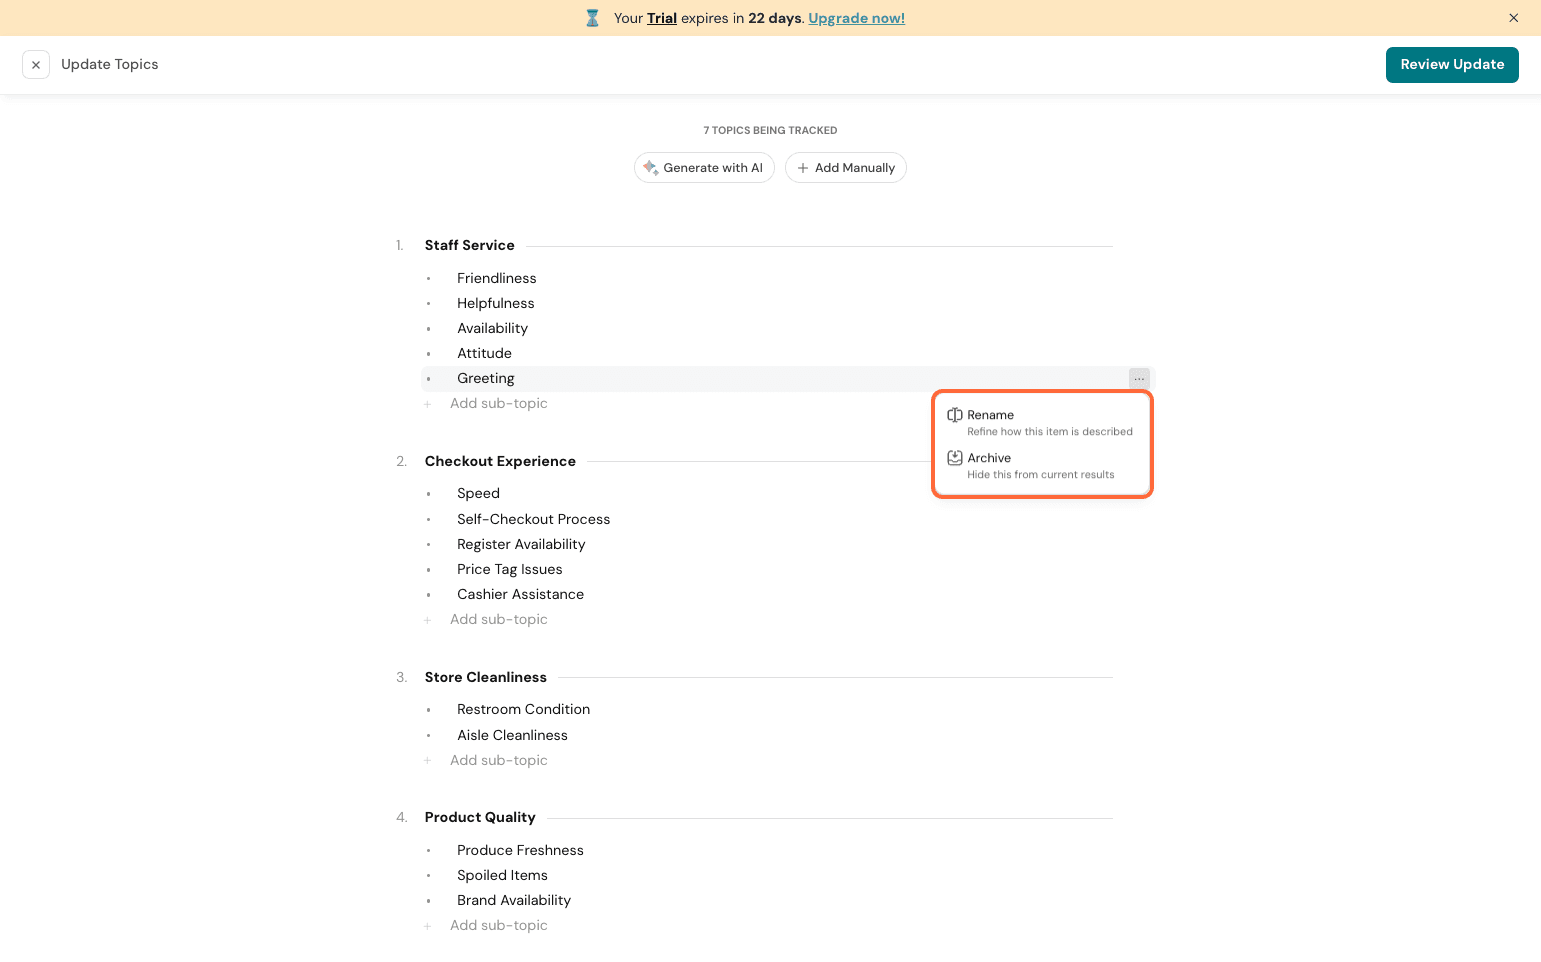
- Rename: This is if there is a typo or you wish to use a better term to define the same topic. Note that if you are repurposing the topic, it would lead to disrupted analysis.
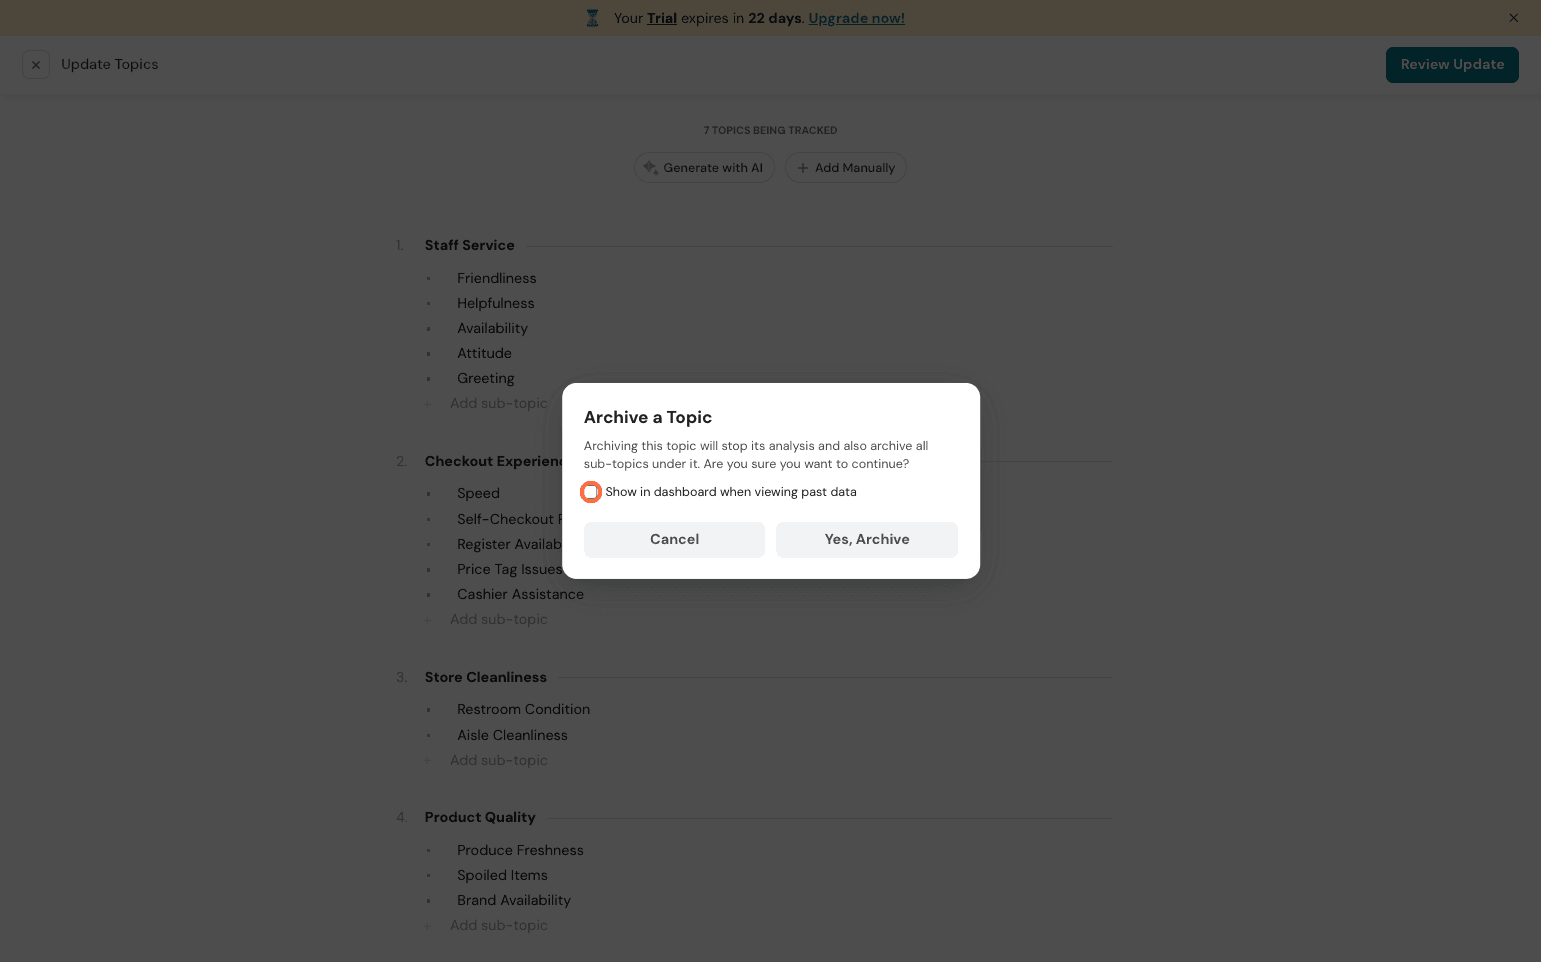
- Archive: You can archive specific topics if you no longer wish to run analysis but feel you might need it later. When archiving, you can choose for it to still be displayed for past analysis already done. You can always un-archive a topic later on.
Once set up to your satisfaction, you can save and choose if historic data needs to be resynced. After configuring, the CogniVue now runs on the updated topics.
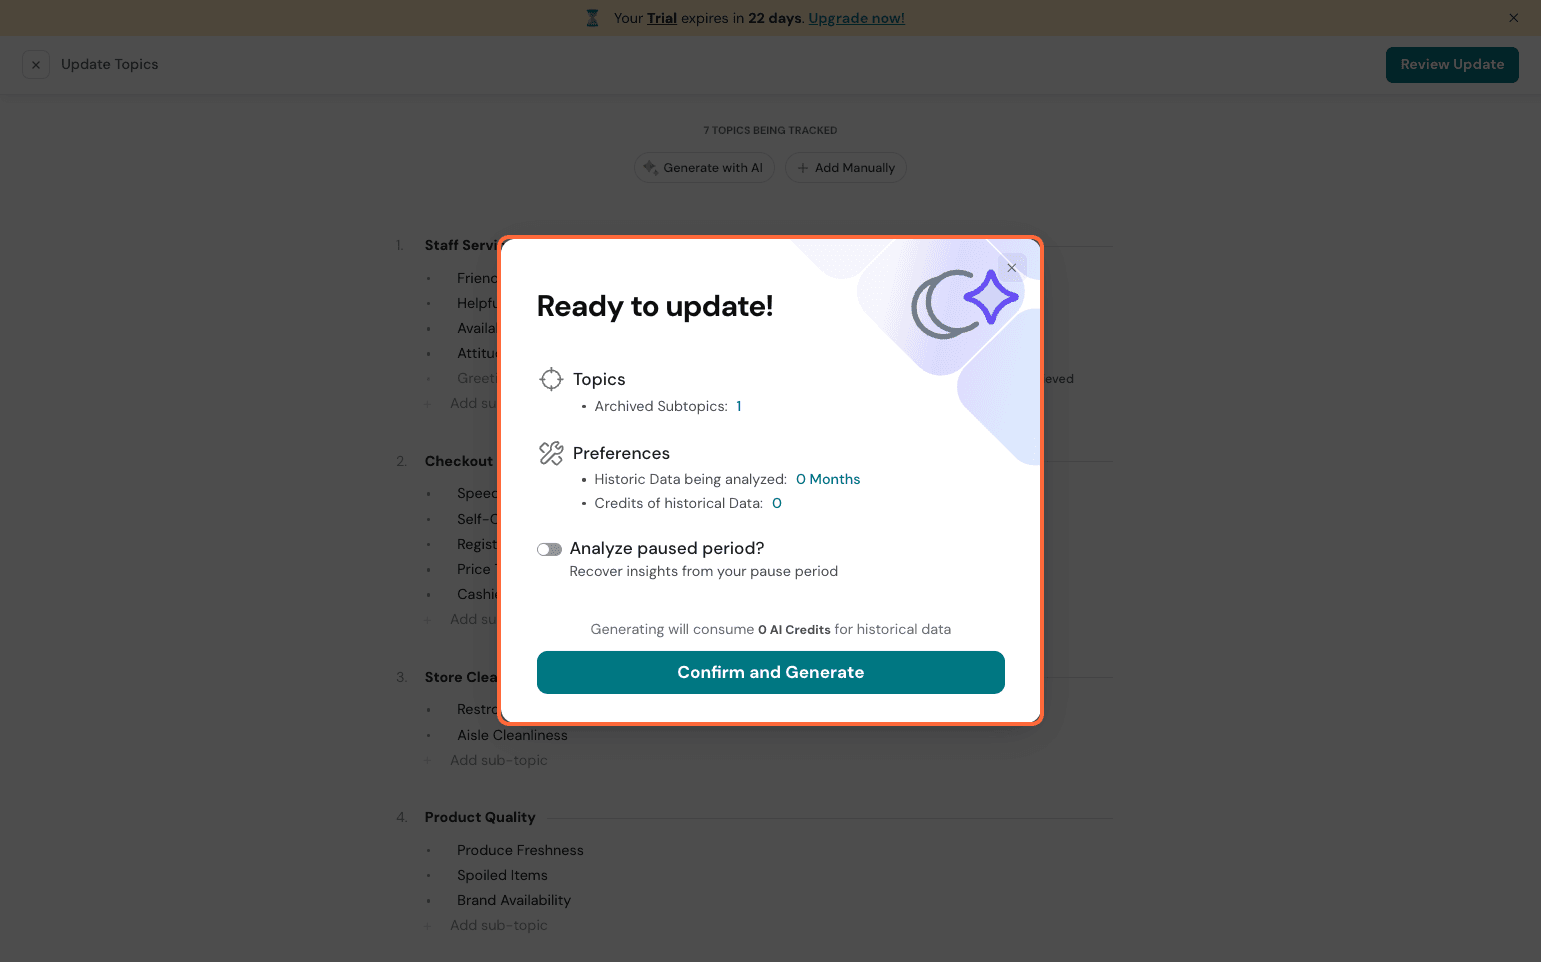
Note: If you choose to resync, you may lose existing data.
Pause CogniVue
If you prefer to save on credits or wish not to run analysis for some time, you can choose to pause your CogniVue.

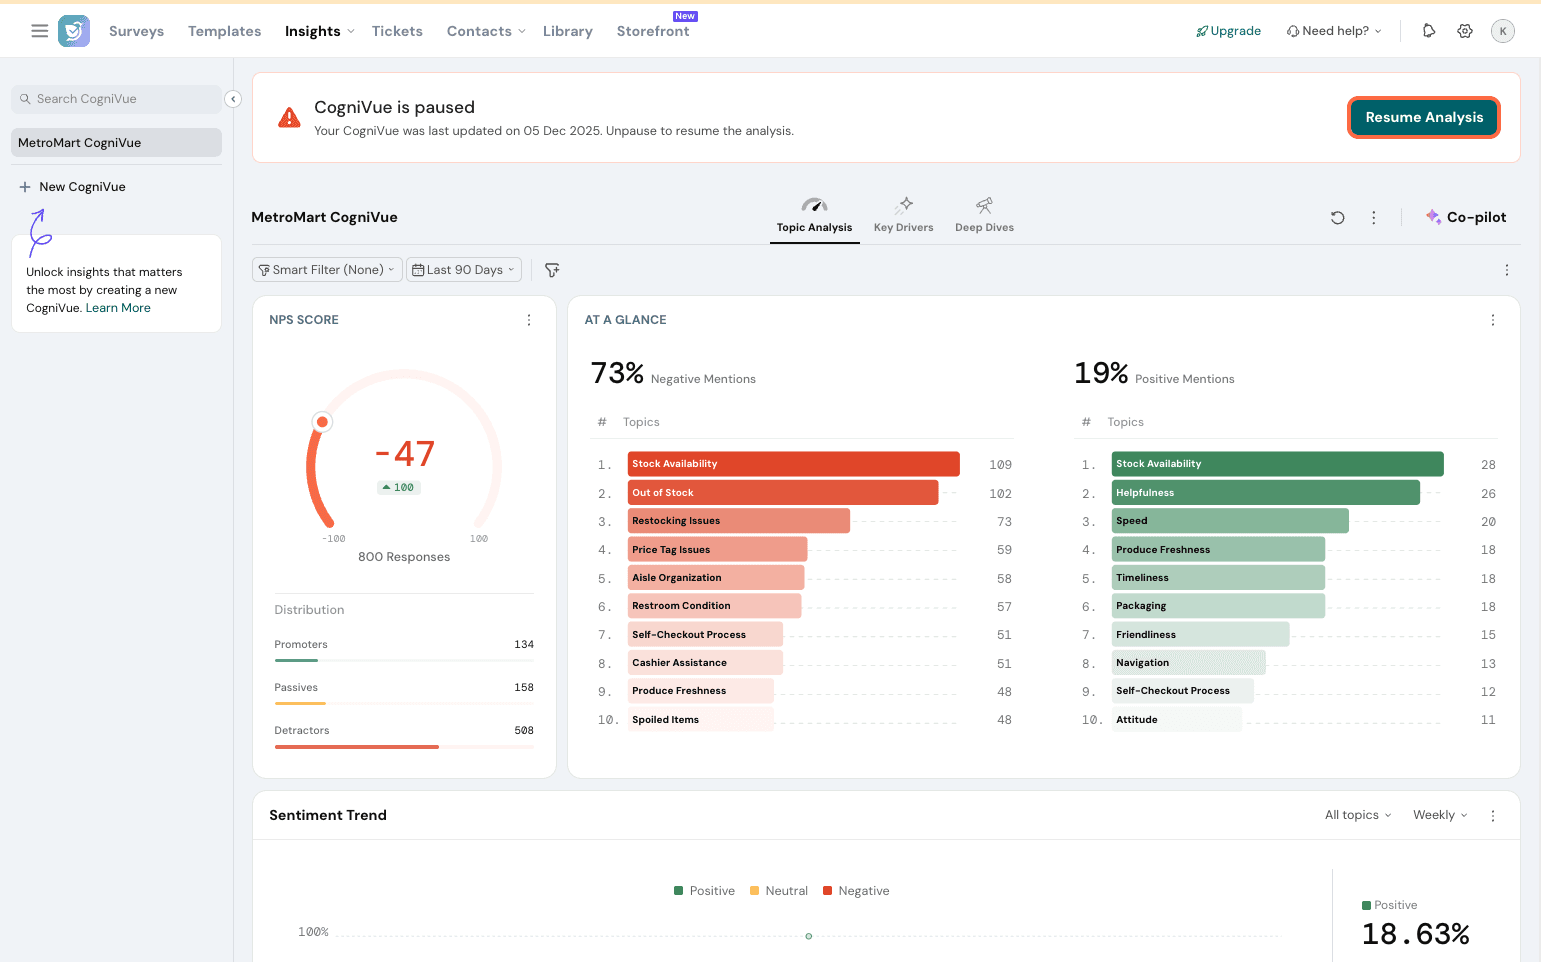
Whenever you wish to resume analysis, you can always do so. When resuming, you get the option to resync data from the period the analysis was paused for, so you can pick up insights from that as well.
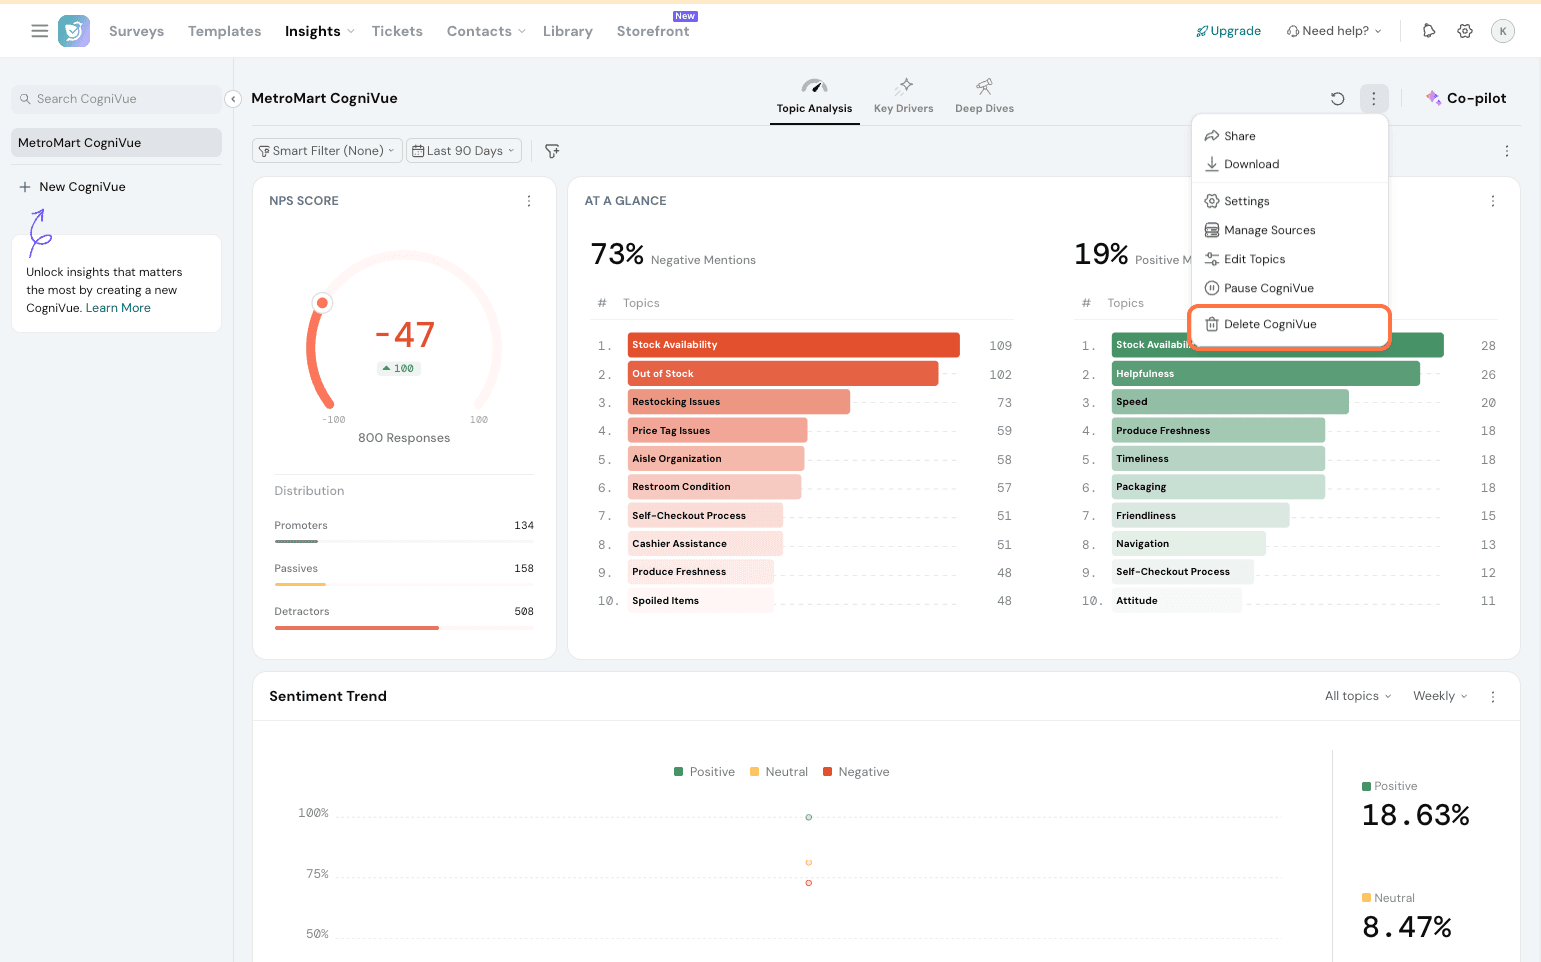
Delete CogniVue
If you choose to no longer need analysis, you can delete a CogniVue. Note that once deleted, it is not possible to bring back data from during your analysis. Also note that deletion of CogniVue will not get you back credits that were already consumed.
That's it on CogniVue! Read on for some commonly-asked questions.
FAQs:
- What is the sentiment score? How is it calculated? How is it relevant?
Sentiment for a topic is calculated by taking the sum of all sentiment instance scores and dividing by the total instances. Values will range from -1 to 1, -1 being the most negative and 1 being the most positive. The value is determined by the severity of the responses - for example, feedback with ‘the quality of the top was poor’ could be -0.3, whereas ‘this is the worst experience I’ve had’ could be -0.9.
- How often does the Key Driver section refresh?
The Key Drivers section refreshes every 30 days to capture meaningful changes in your customer data. It's designed for strategic insights, so aim to monitor it monthly or quarterly, depending on your needs.
- Why are the key drivers not updated in real-time or daily?
Key Drivers can yield meaningful insights based on accumulating enough data over time to show trends and patterns that best explain your brand performance. So, it gets updated on a monthly basis.
- How to set up a CogniVue?
Setting up CogniVue is a simple process. Check out the detailed guide on the setup process here.
- Can I add a survey and a review platform as sources to the same CogniVue?
Currently, we do not support adding one survey and external reviews to be analyzed in the same CogniVue. You can, however, analyze reviews from multiple review platforms in a single CogniVue to monitor your key metric performance. You can analyze feedback from multiple surveys in a single CogniVue as well.
- What are the question types supported to be analyzed in CogniVue?
If you enable Key Drivers section, this applies: For the primary question, only scale questions like rating scale and opinion scale questions would be supported. The question added must measure the metric you want to monitor and improve. For the open-ended text question, which should cover the ‘why’ behind the metric score, question types like text, MCQs, dropdown questions, picture choice and others are supported.
If it’s only Topic Analysis and/or Deep Dives, any text-based question type like text, MCQs, dropdown questions, picture choice and others are supported. Scale question is not mandatory.
- I changed the question in the survey which was added to CogniVue. Will it affect my CogniVue?
If you change the question, it will affect your CogniVue in one of the two ways:
- If you have rephrased the question, the answers you had gotten previously would no longer be contextually relevant so the analysis may not be as accurate.
- Changing the question type (e.g., scale to star rating) will prevent CogniVue from running.
So, when setting up a CogniVue, be sure of the source, especially when it comes to surveys.
- How do I set up topics and subtopics to be analyzed?
You can choose from the pre-configured questions based on your industry or start with your custom topics. Once you select an industry, you can glance through the pre-built topics and the subtopics under every topic to configure them according to your needs. You can add custom topics to this pre-built list. Simply click ‘Add Topic’ and set it up.
- What is the ideal sample size to be analyzed in CogniVue?
For a CogniVue to run effectively, it is better to have as many responses as possible to run the analysis. If you have set up 15 topics to be studied, a minimum of 1000 responses is needed for valid results. But the more responses you can feed, the more precise and accurate insights you can glean from CogniVue.
- What is the maximum historic data that can be imported for comparison?
You can import upto 10 years’ worth of historic data from your surveys and review platforms.
- What are the share options supported for CogniVue?
CogniVue can be shared with specific users by inviting them. A public view link can also be generated and shared across, which gives view-only access to specific tabs or the entire CogniVue, based on your configuration. Additionally, to make real-time monitoring easy, you can add in widgets from Topic Analysis and Deep Dive to your executive dashboards.
- Can I export my CogniVue?
Yes, you can export the entire CogniVue board as a PDF. Widgets can be exported as PNG, JPG, CSV, and XLSX files. The responses can also be exported from CogniVue as a CSV or xlsv file
- Can my CogniVue be password-protected?
Yes, you can password-protect your CogniVue. When sharing the link, you can toggle this on so only those with the password can access your data analysis.