
Getting started with the Executive Dashboard
Executive Dashboards allow you to visualize your survey data (from multiple surveys), track key performance indicators (KPIs), and gain actionable insights through customizable widgets. You can compare and correlate the data from different surveys for useful insights. Some simple use-cases include:
- Combining data from multiple surveys (NPS, CSAT, employee feedback) into one view for unified reporting and stakeholder briefings.
- Spotting patterns over time across teams or touchpoints using trend, journey, and gauge charts to catch issues early.
- Sharing a password-protected, auto-refreshing TV Dashboard link so stakeholders can monitor data without needing a login.
This guide will help you with creating your first dashboard and adding data visualizations.
1. Inside your SurveySparrow account, hover over the Insights tab in the top navigation bar and from the dropdown menu, select Dashboards.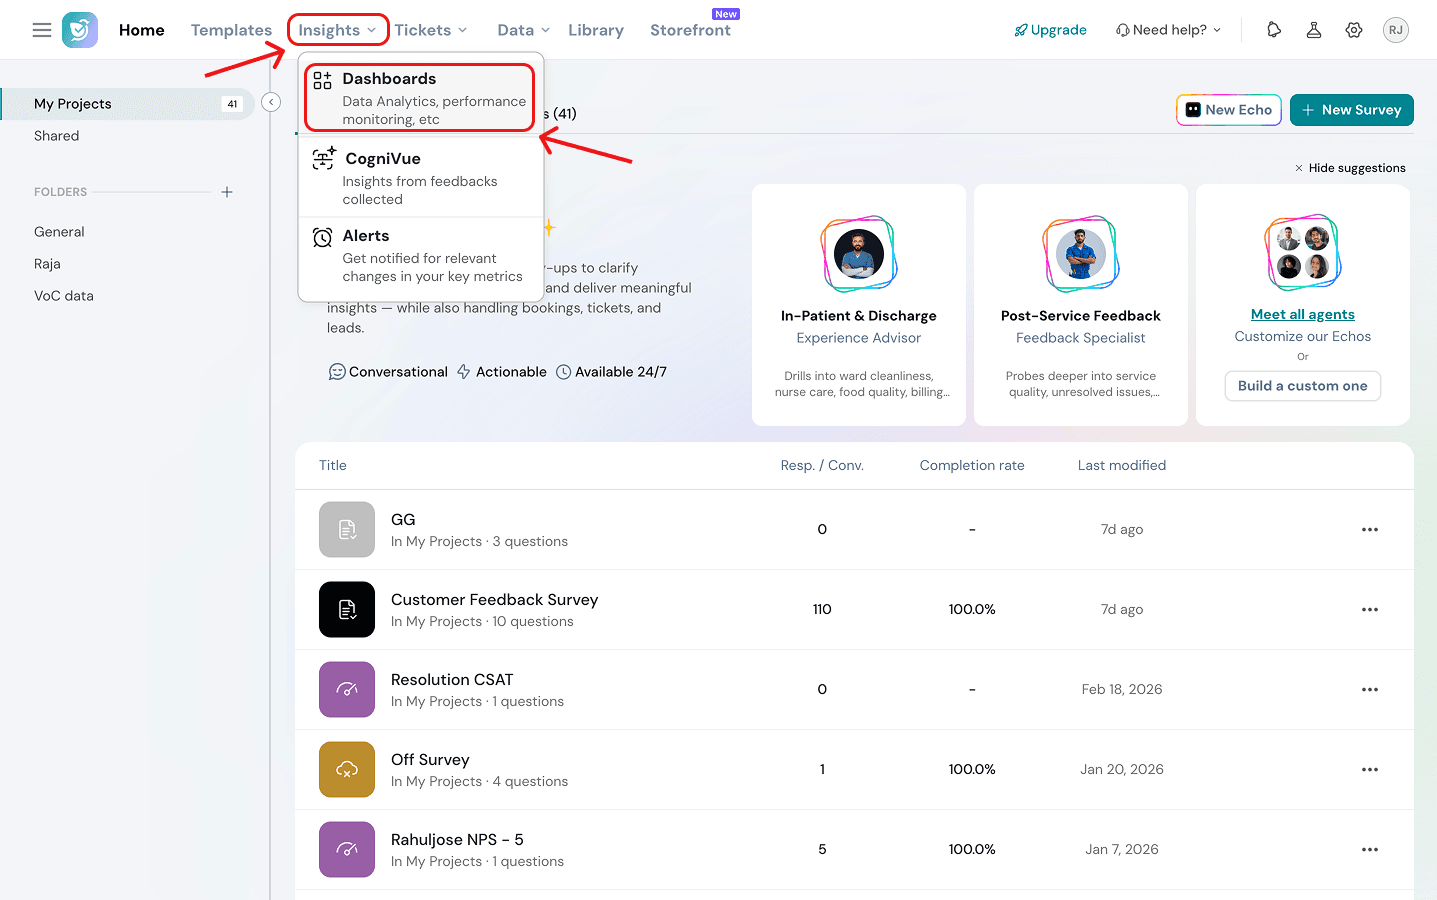
2. Create New: If you don't have any dashboards yet, click the Create New Dashboard button in the center of the screen.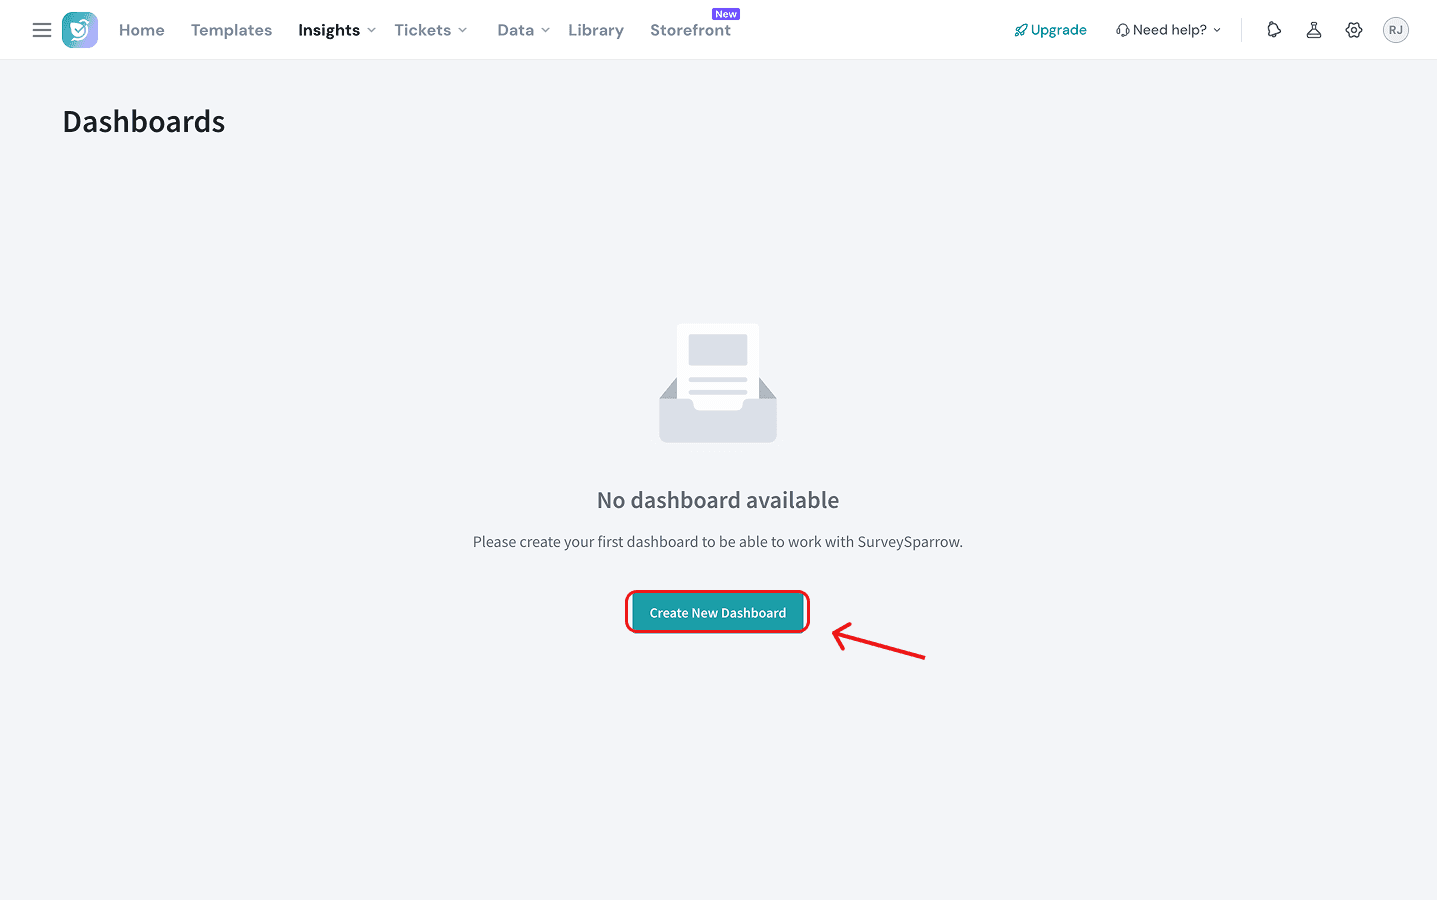
3. Enter a title and description, then click Create New Dashboard.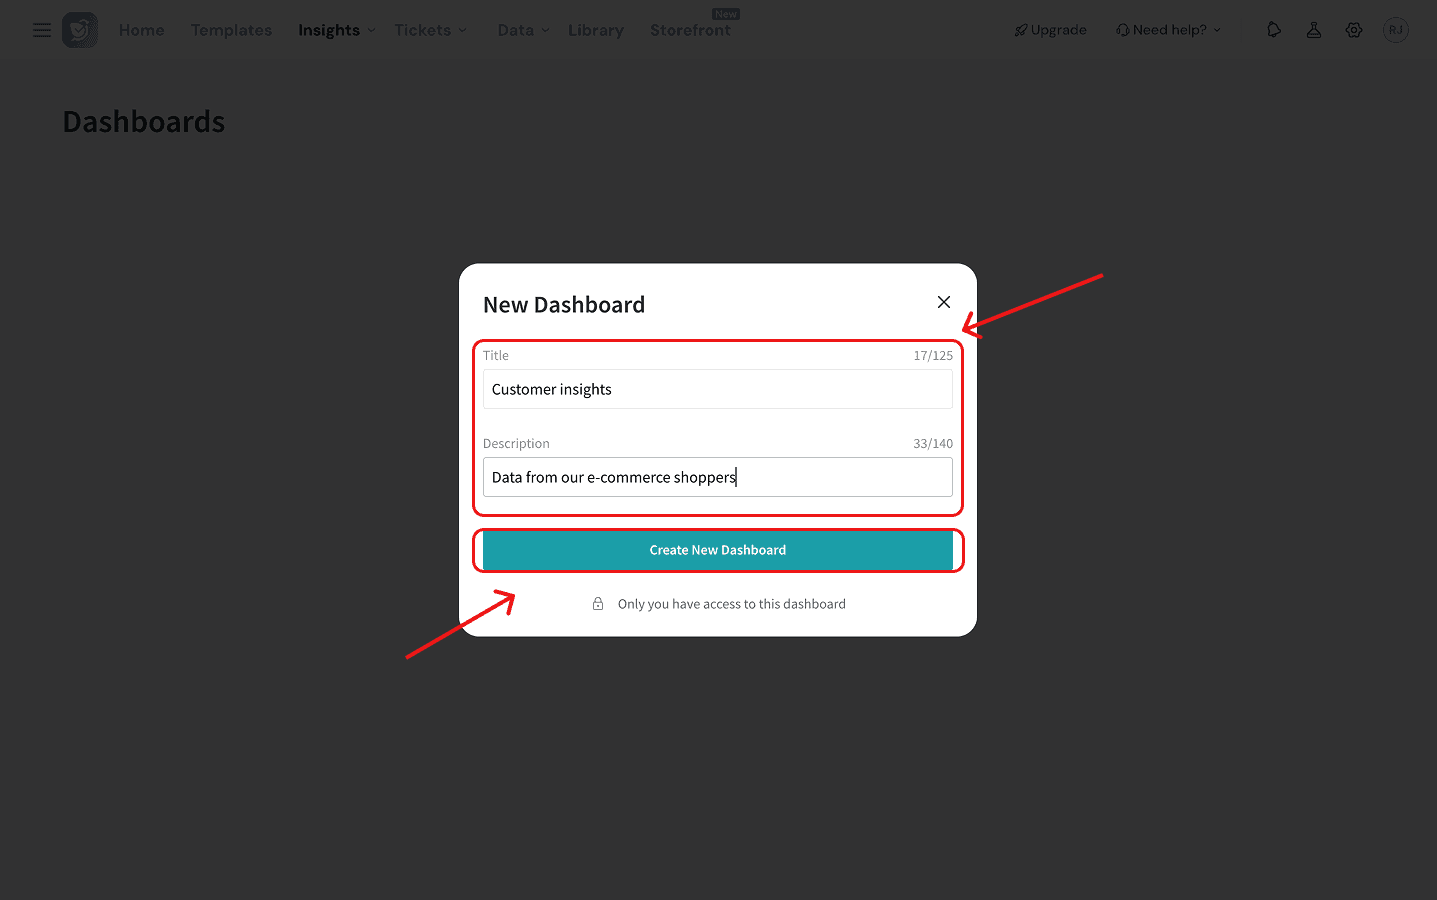
4. Next, it’s time to add widgets. Widgets are the individual charts and graphs that display your survey data. Click the + Widget button in the top right corner or the Add Widget button in the center of your empty dashboard.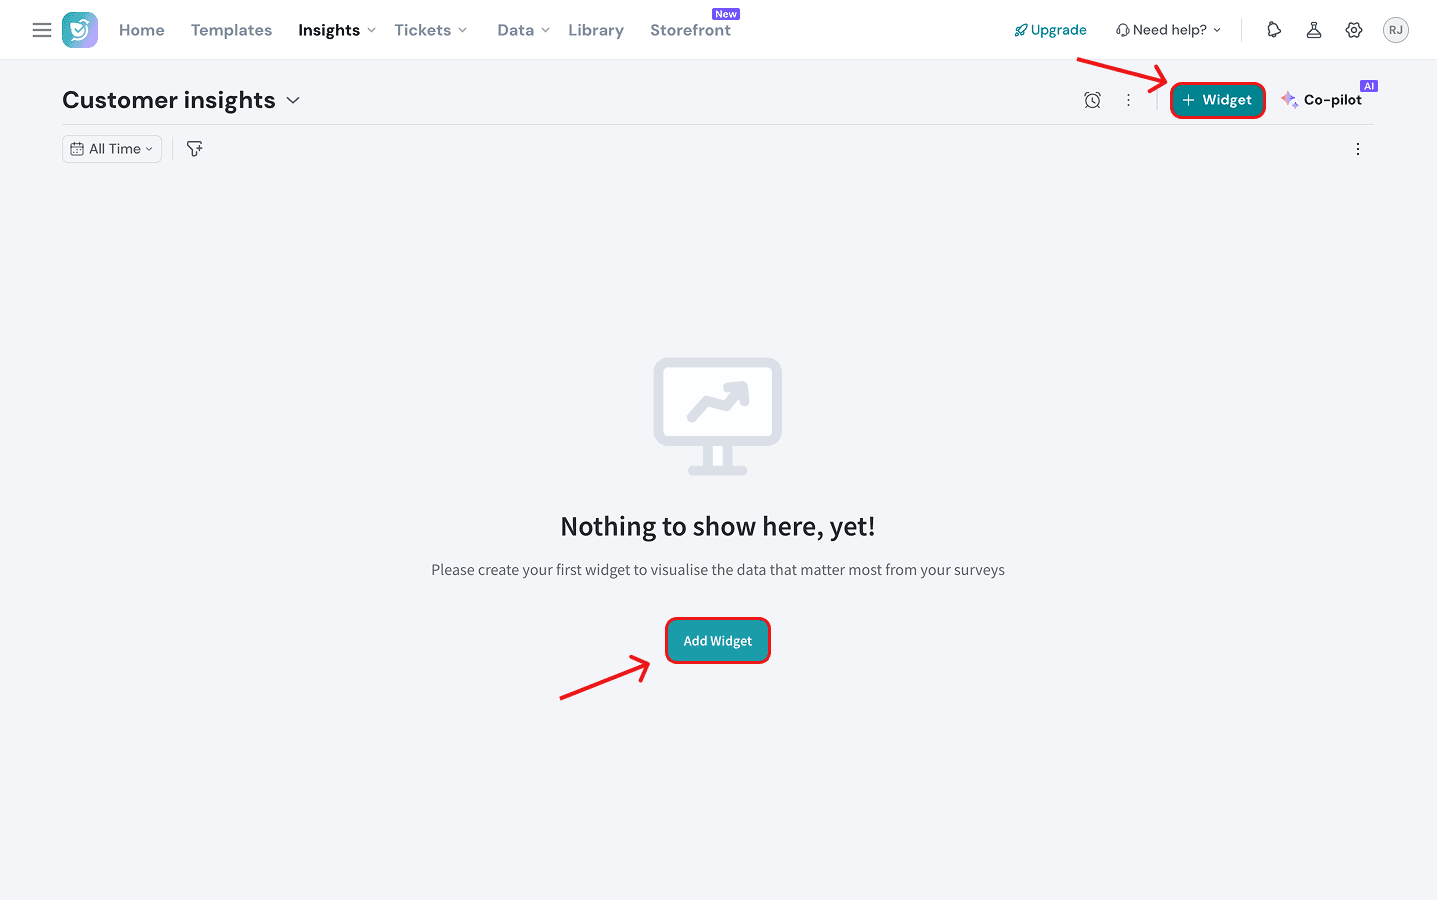
5. Choose a visualization style from the gallery (eg: Bar Chart, Pie Chart, KPI Chart, or Rating Chart). Currently there are 25 styles available. In this instance, we will select a Bar Chart.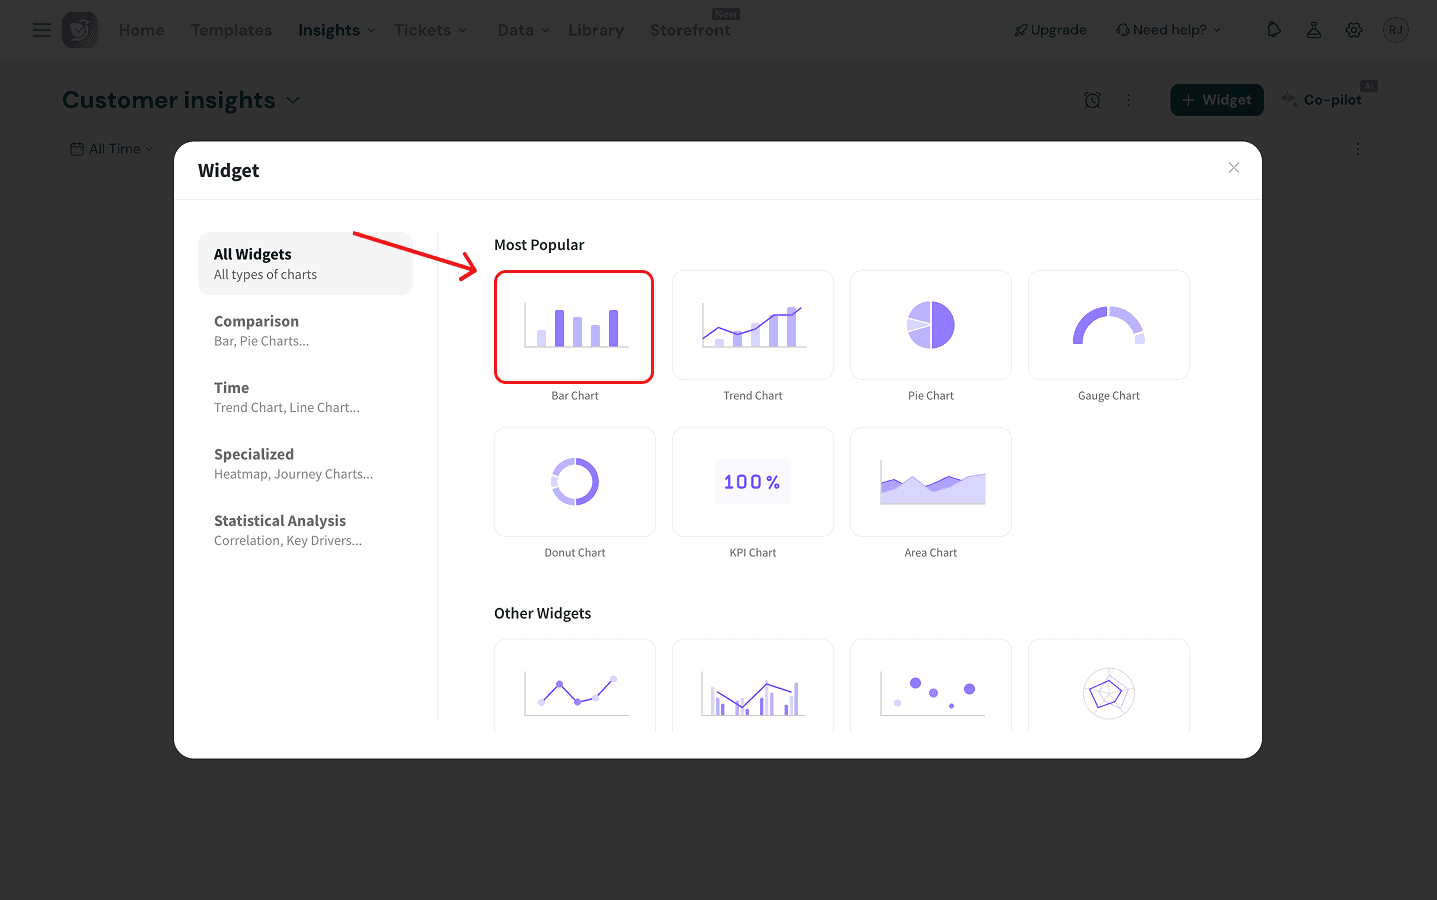
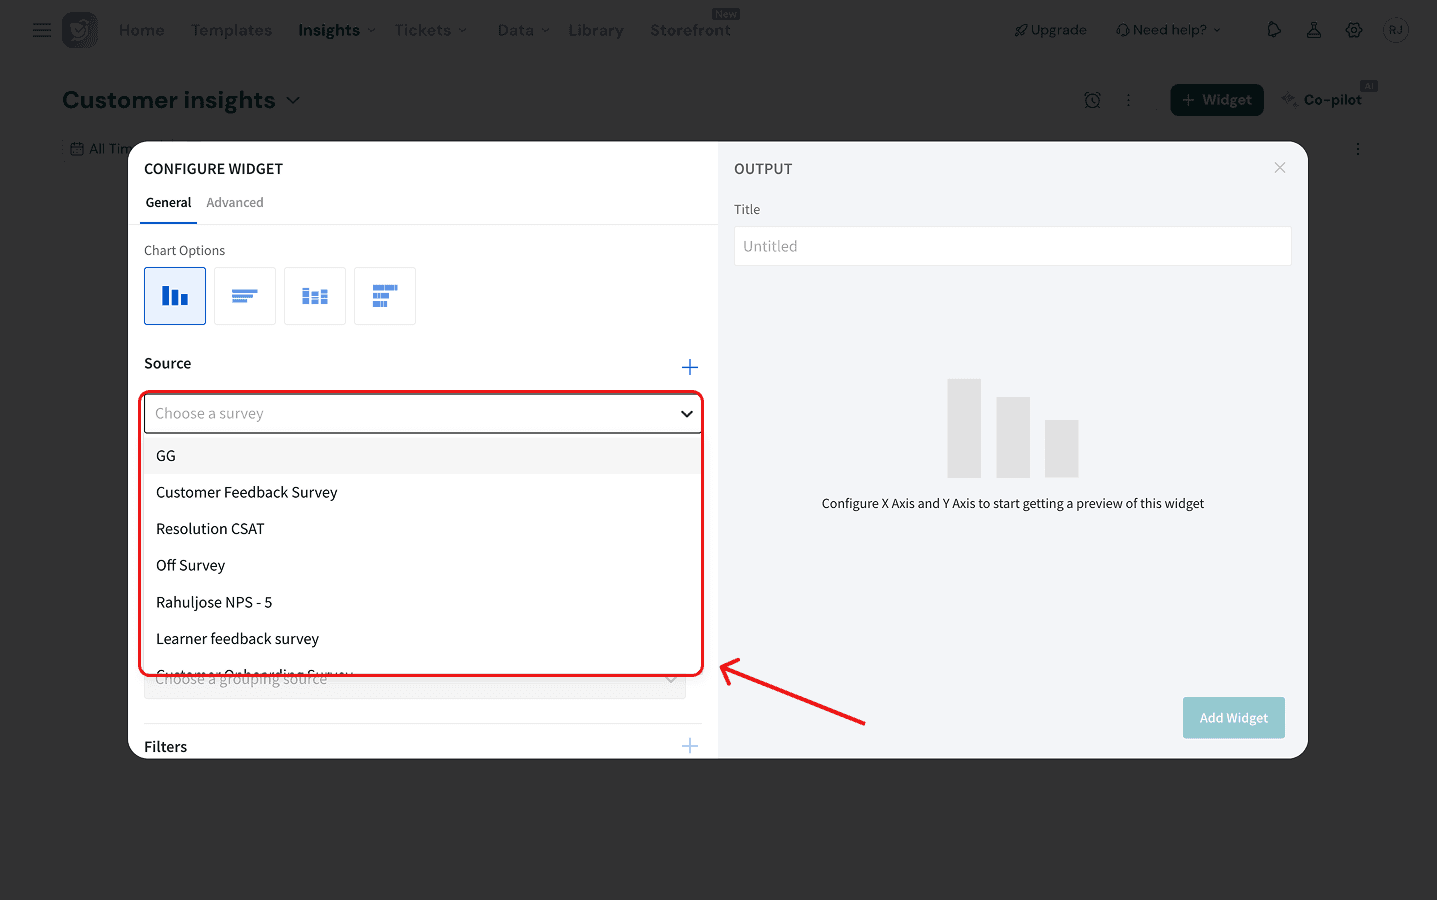
6. Configure the following:
- Source: Choose the specific survey you want to pull data from (e.g., "Customer Feedback Survey").
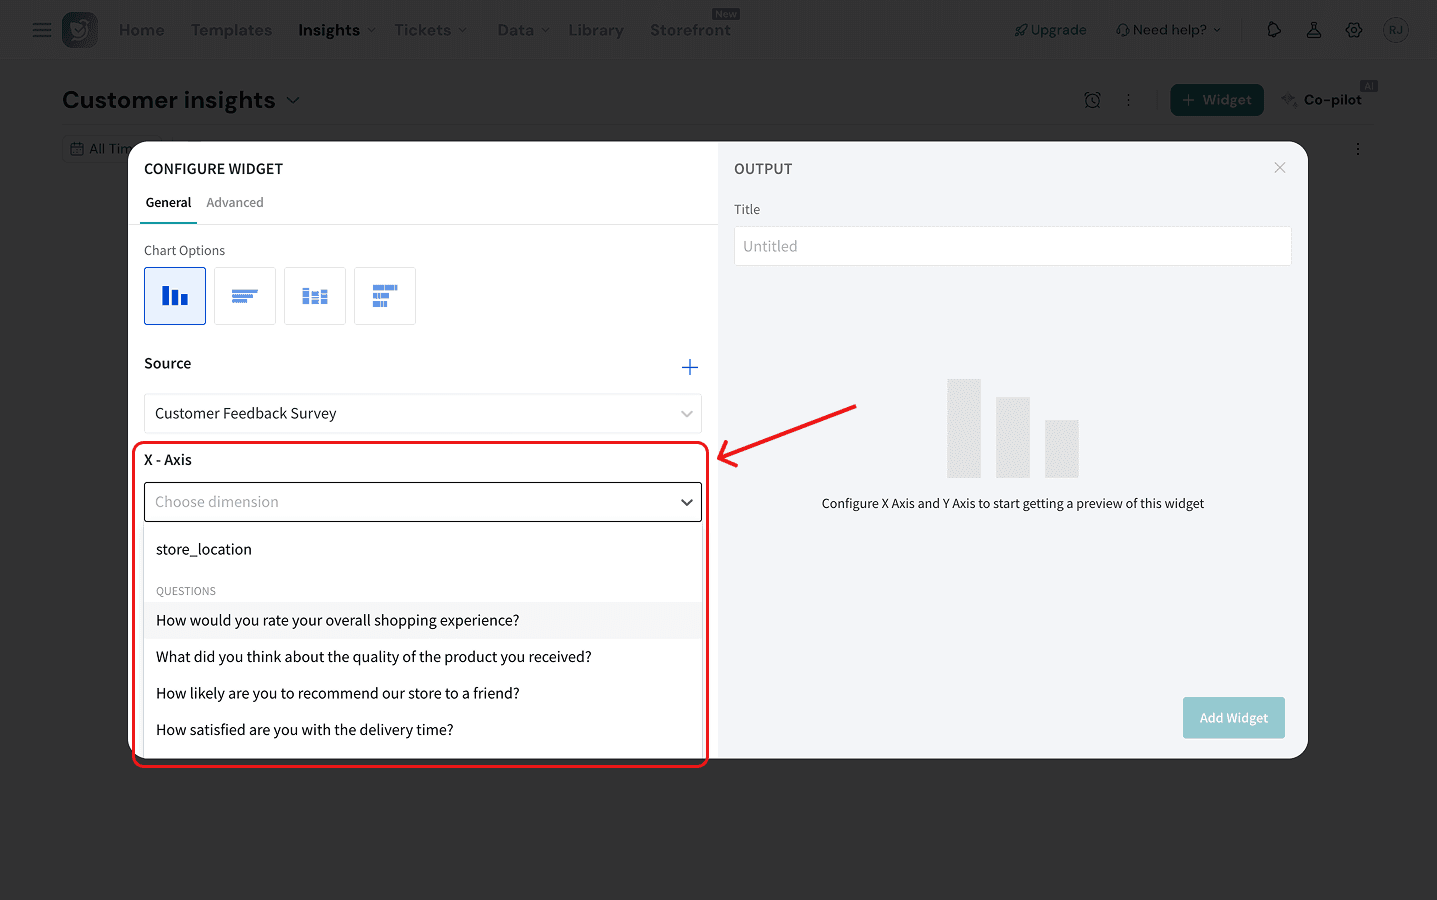
- X-Axis: Select the dimension you want to display on the horizontal axis. This can be a variable, a response property or a question.
- Y-Axis: Select the dimension you want to display on the vertical axis.
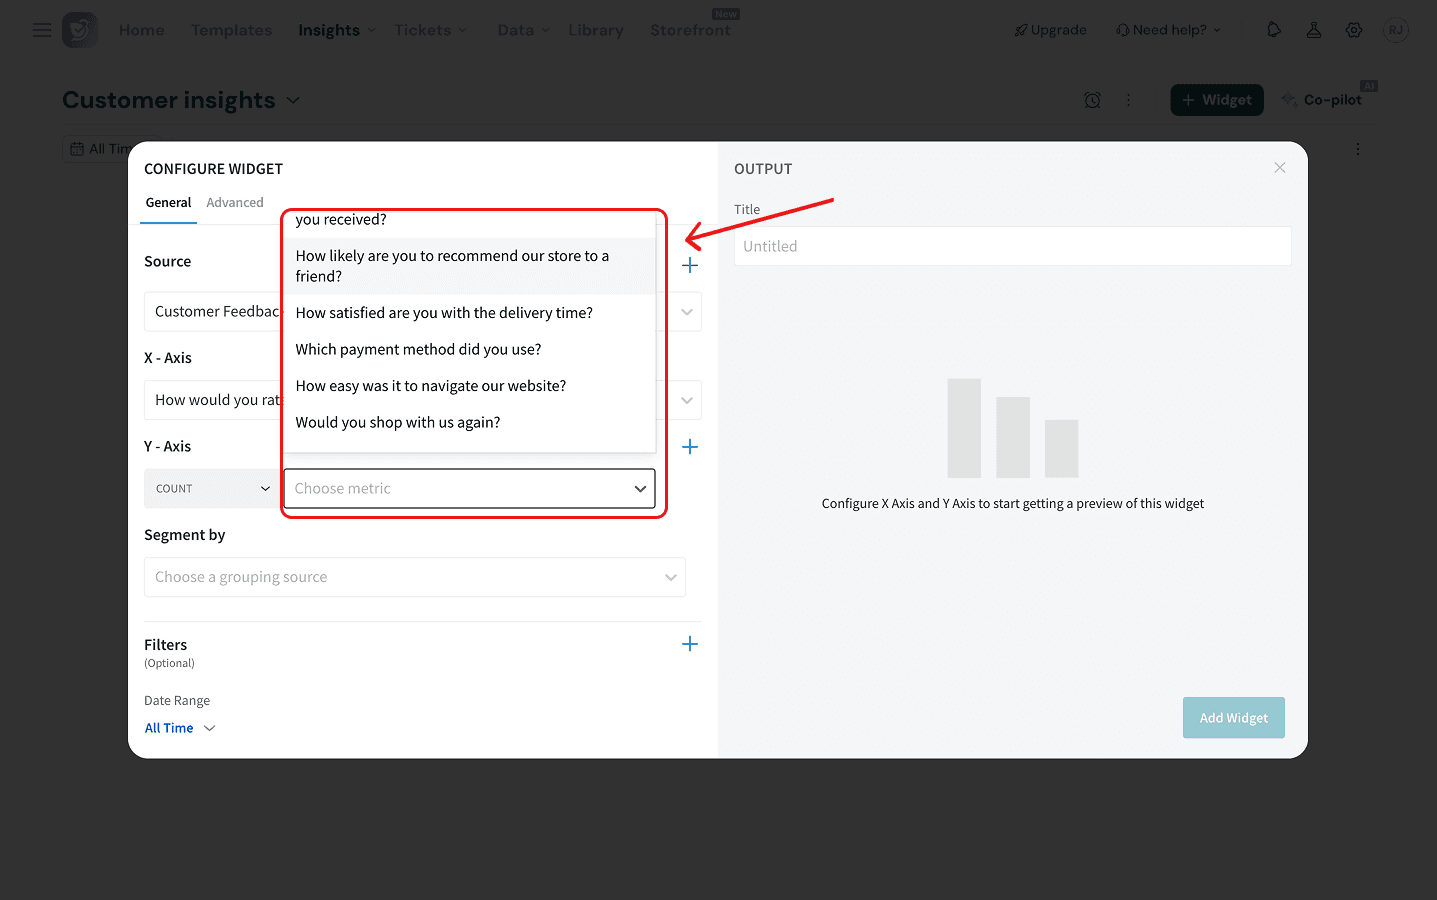
Note: You can also select the metric for the vertical axis (e.g: Count, NPS Score, or Average).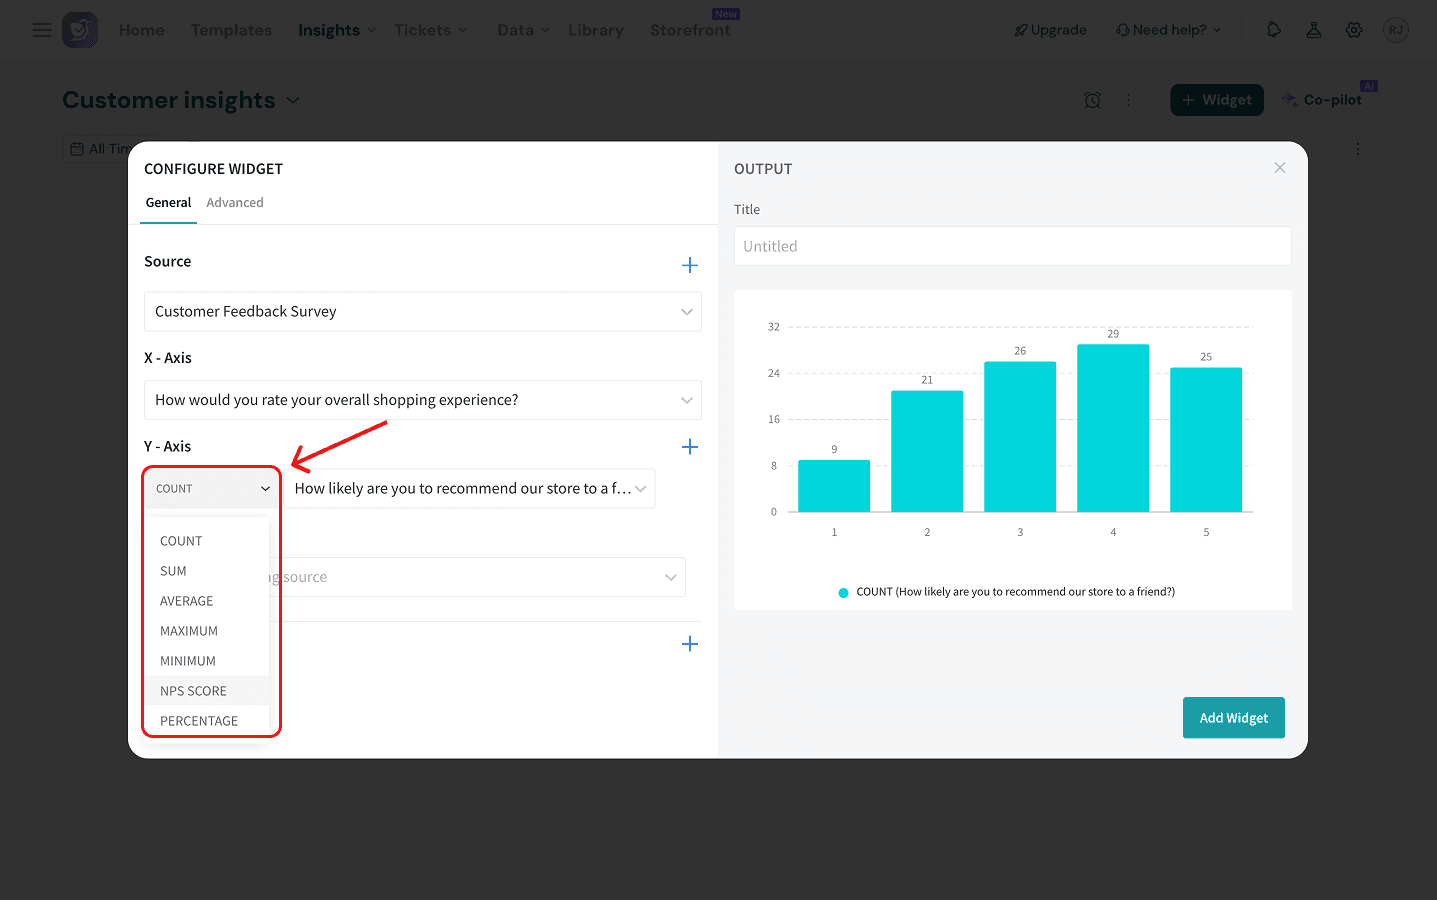
Note: You can add additional Sources and Y-axis dimensions by clicking on the respective blue-arrows to the right.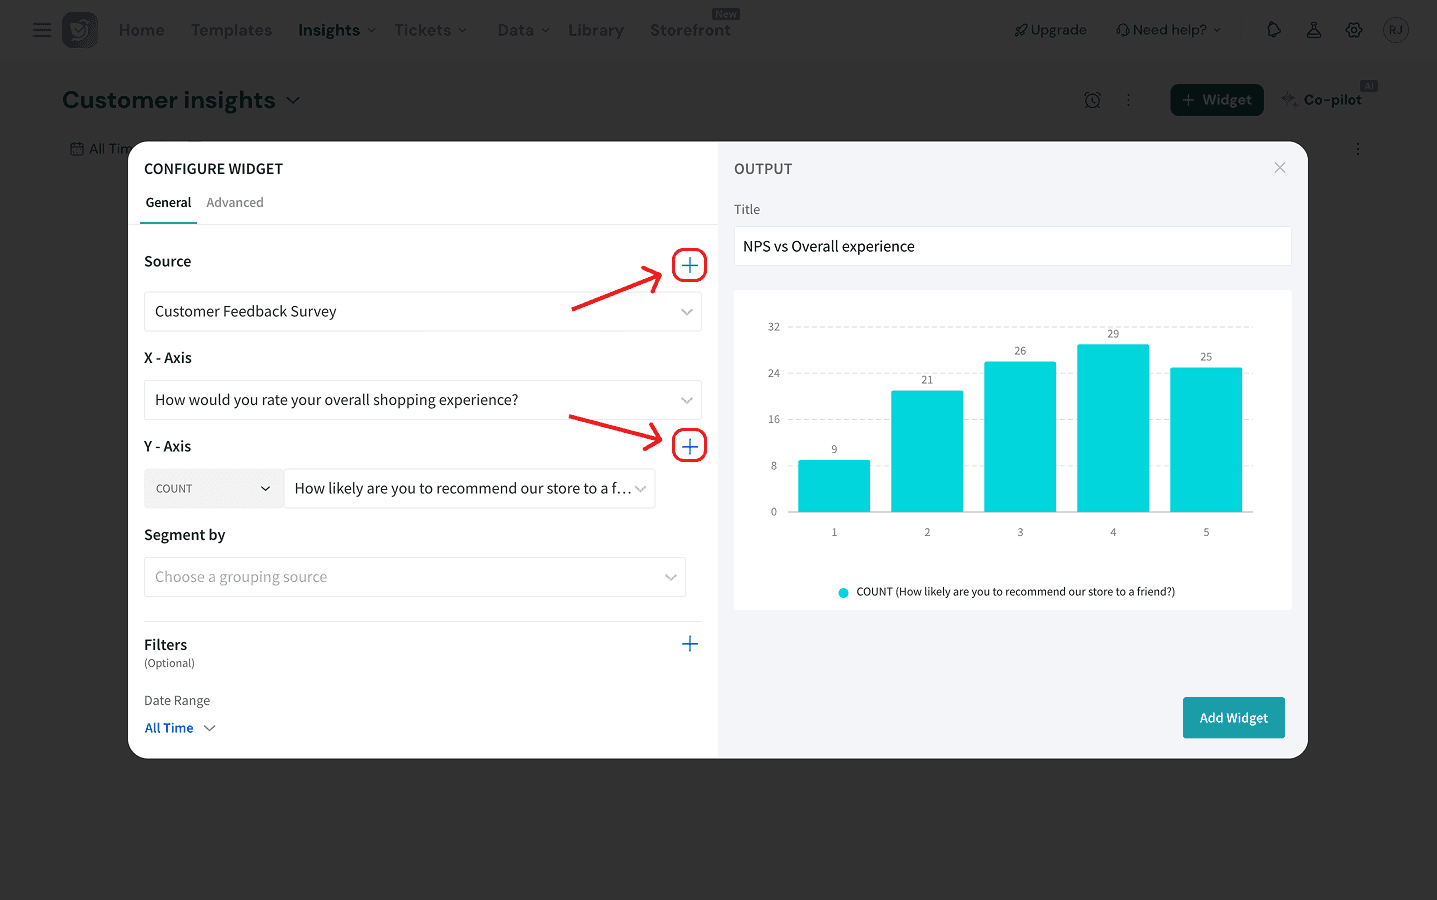
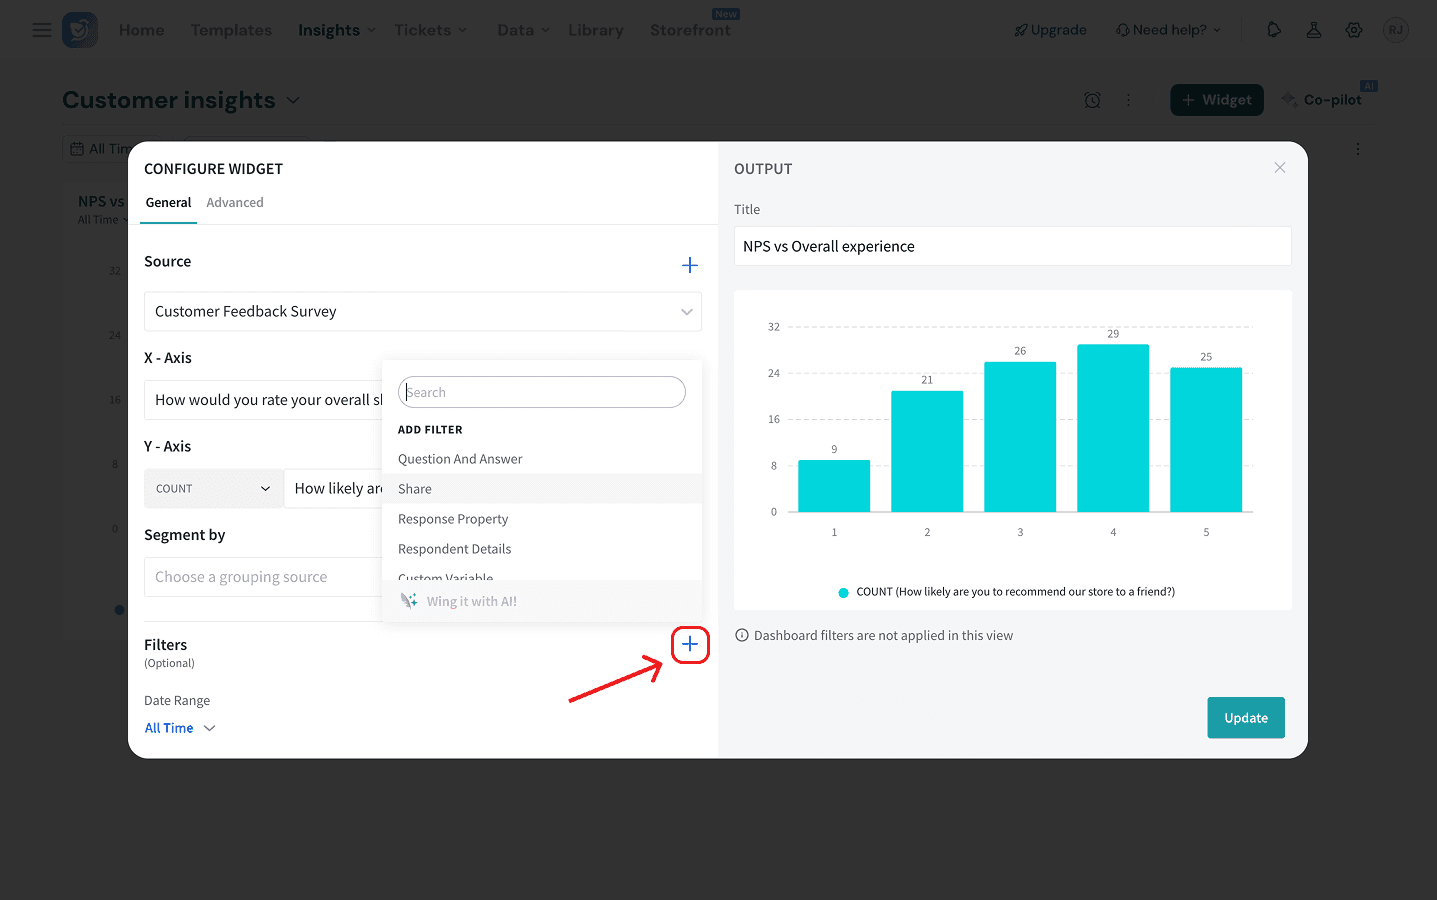
7. Within the widget, you can add filters:
- General filters: You can add filters based on questions, response/respondent properties, variables etc.
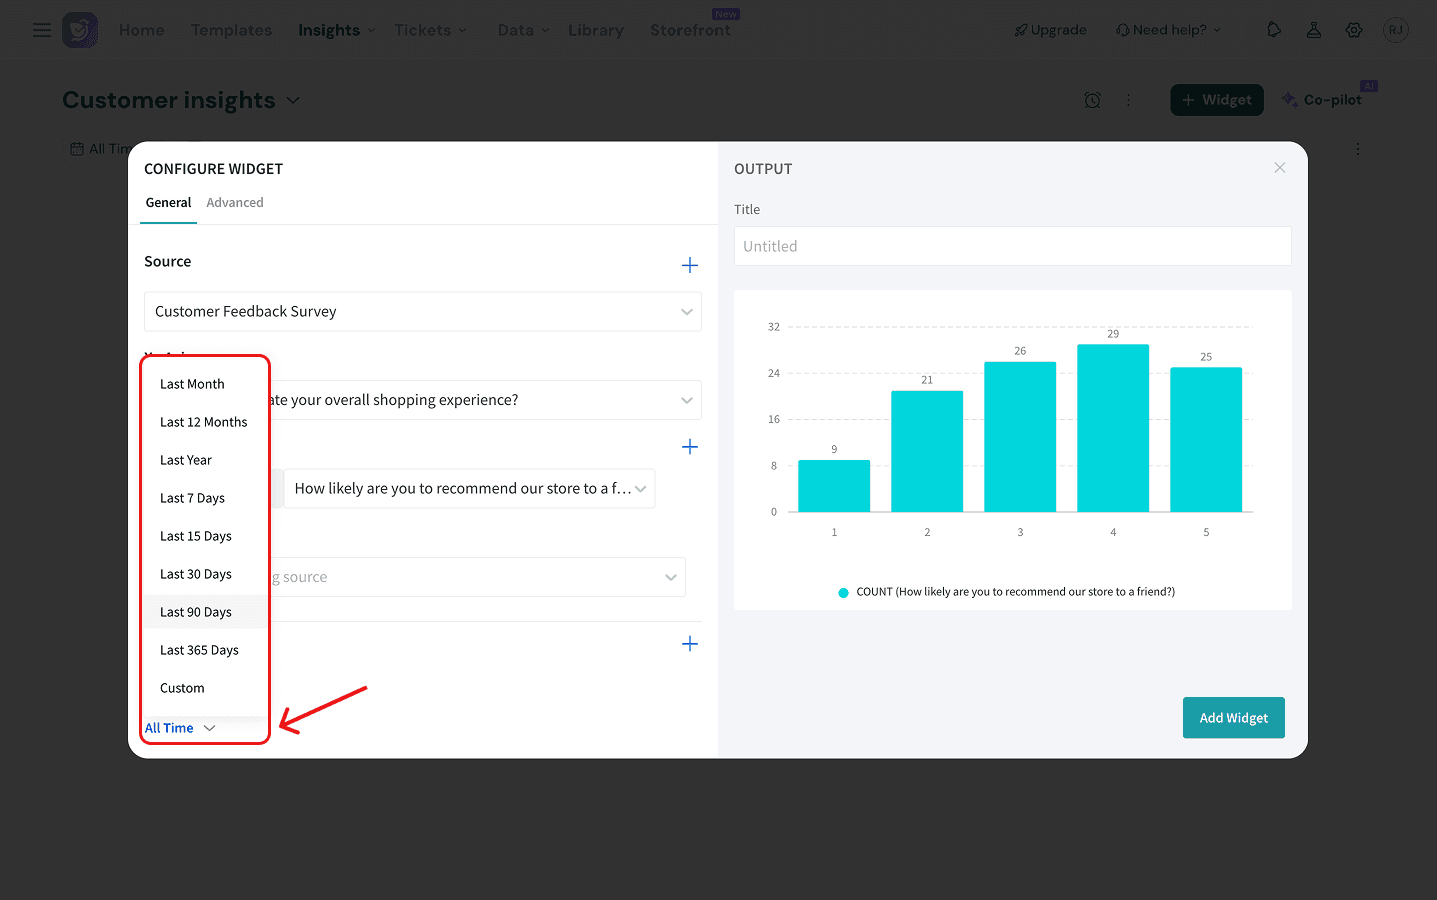
- Time Filters: Use the date range selector (e.g., “Today”, "All Time", "Last 30 Days", or "Custom").
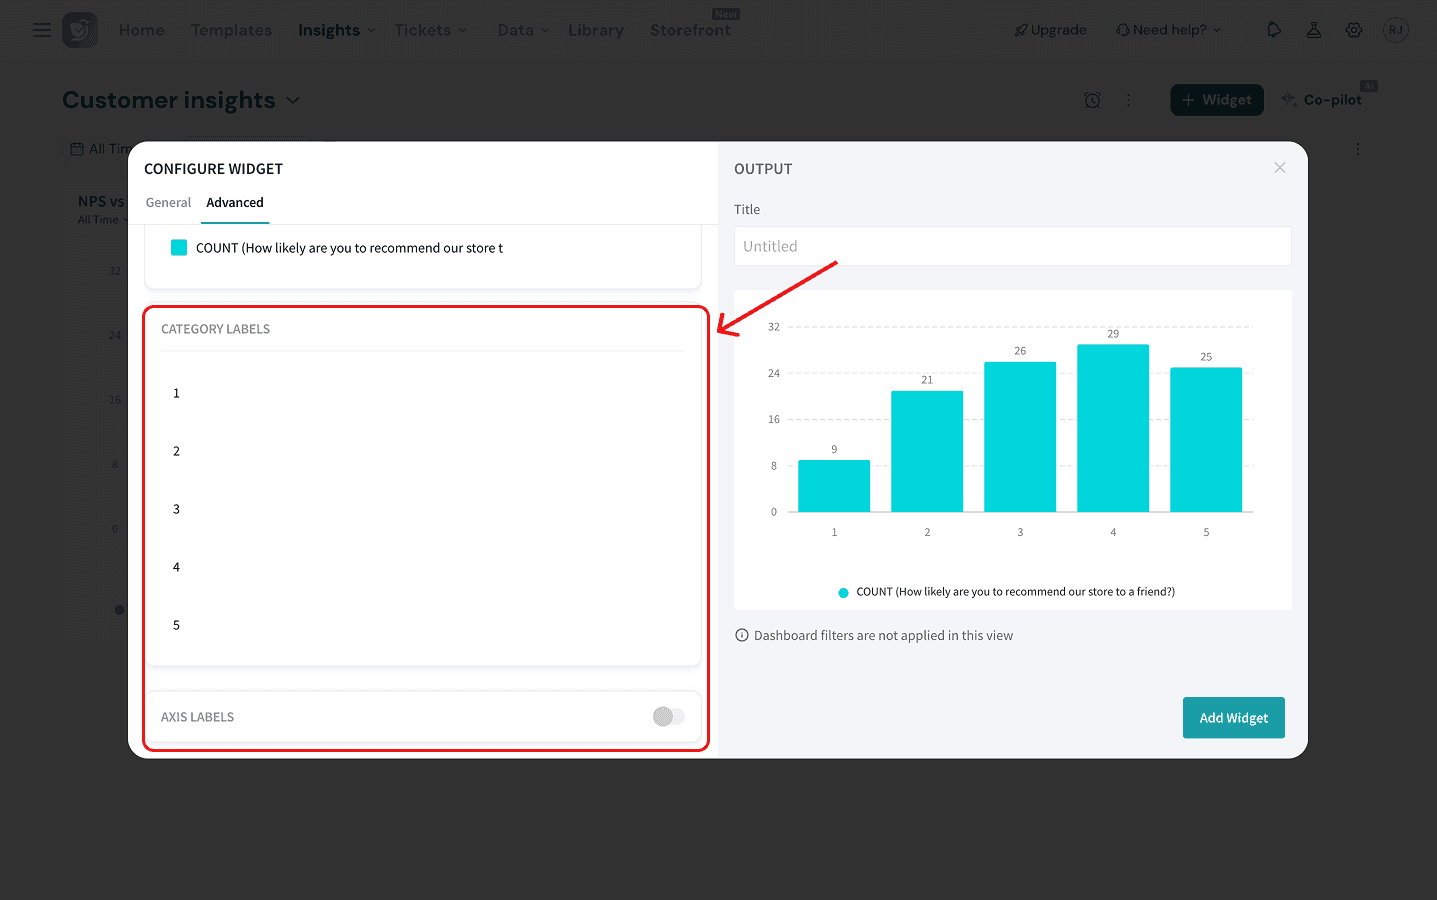
8. You can also open the Advanced section to change the theme, add benchmarks and set labels.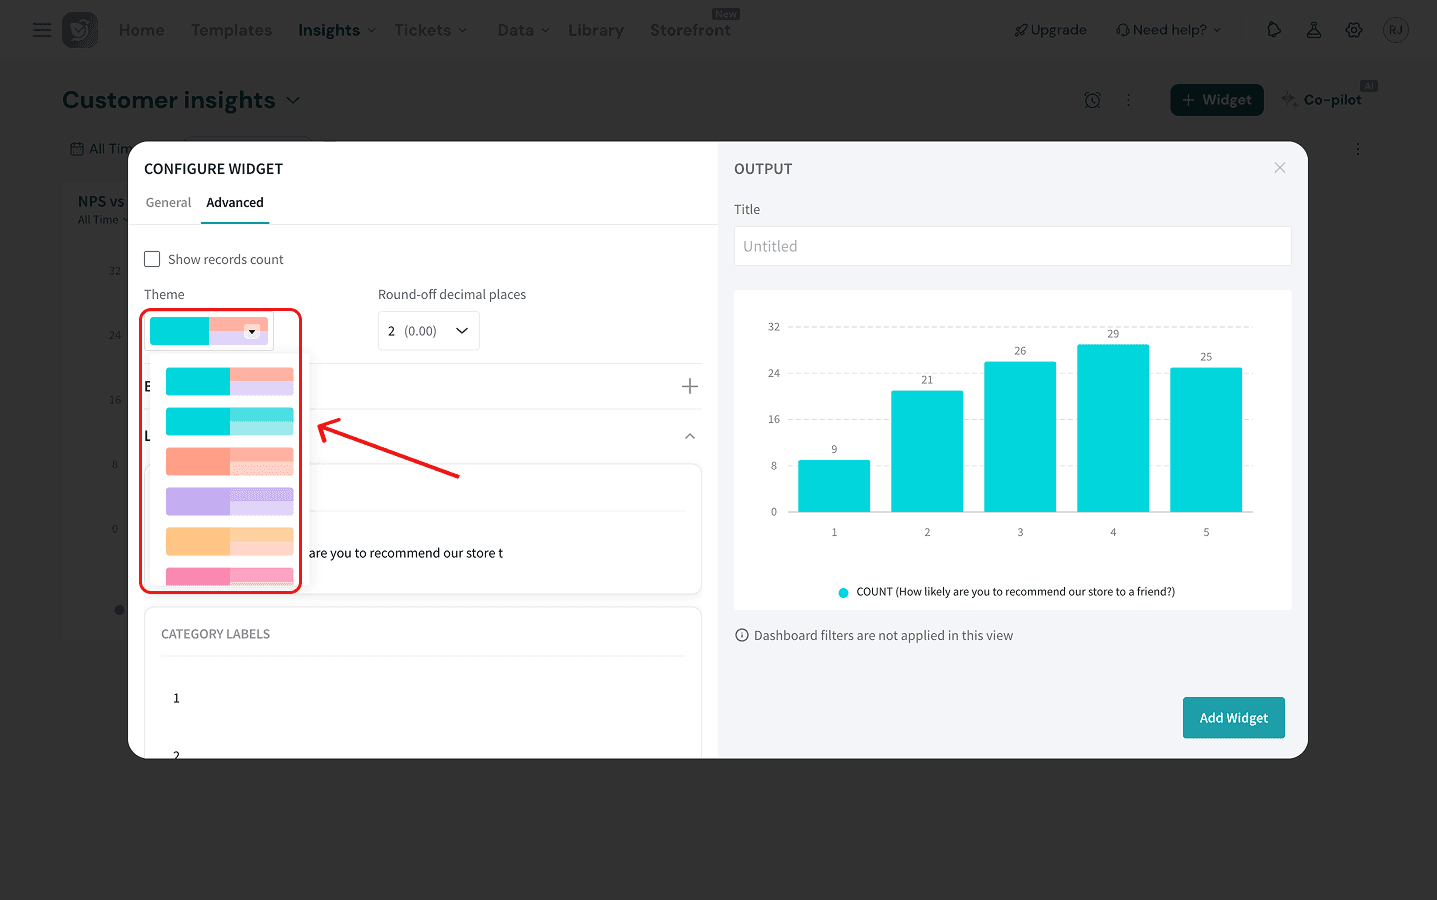
9. Once the preview looks correct, enter a title for the widget and click Add Widget.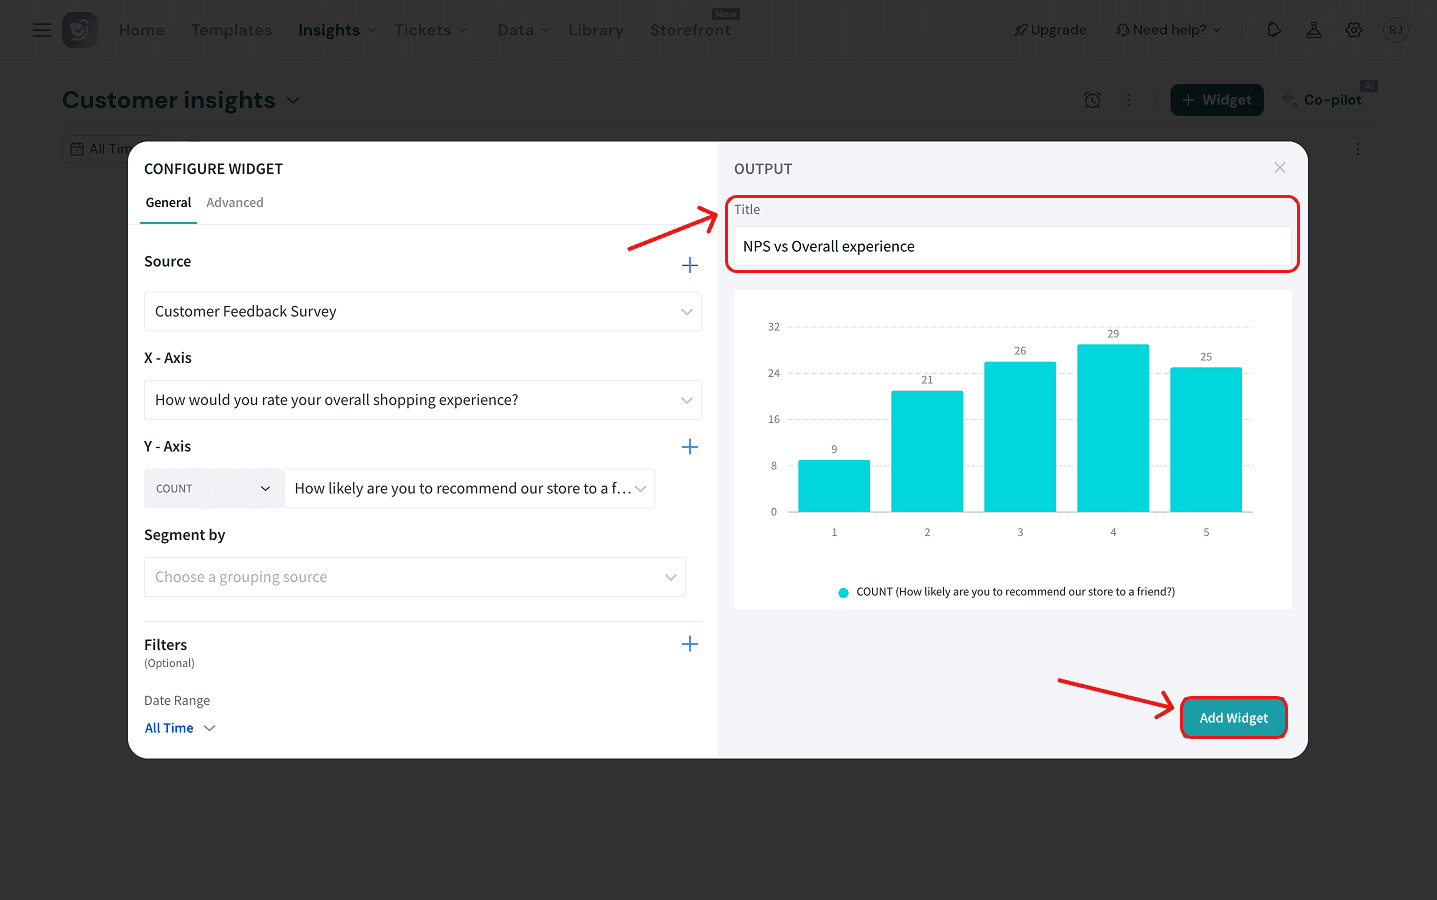
10. After adding a widget to the dashboard, you can move it by clicking and holding the horizontal grid at the top. You can resize it by clicking and dragging the right corner (both appear on hover).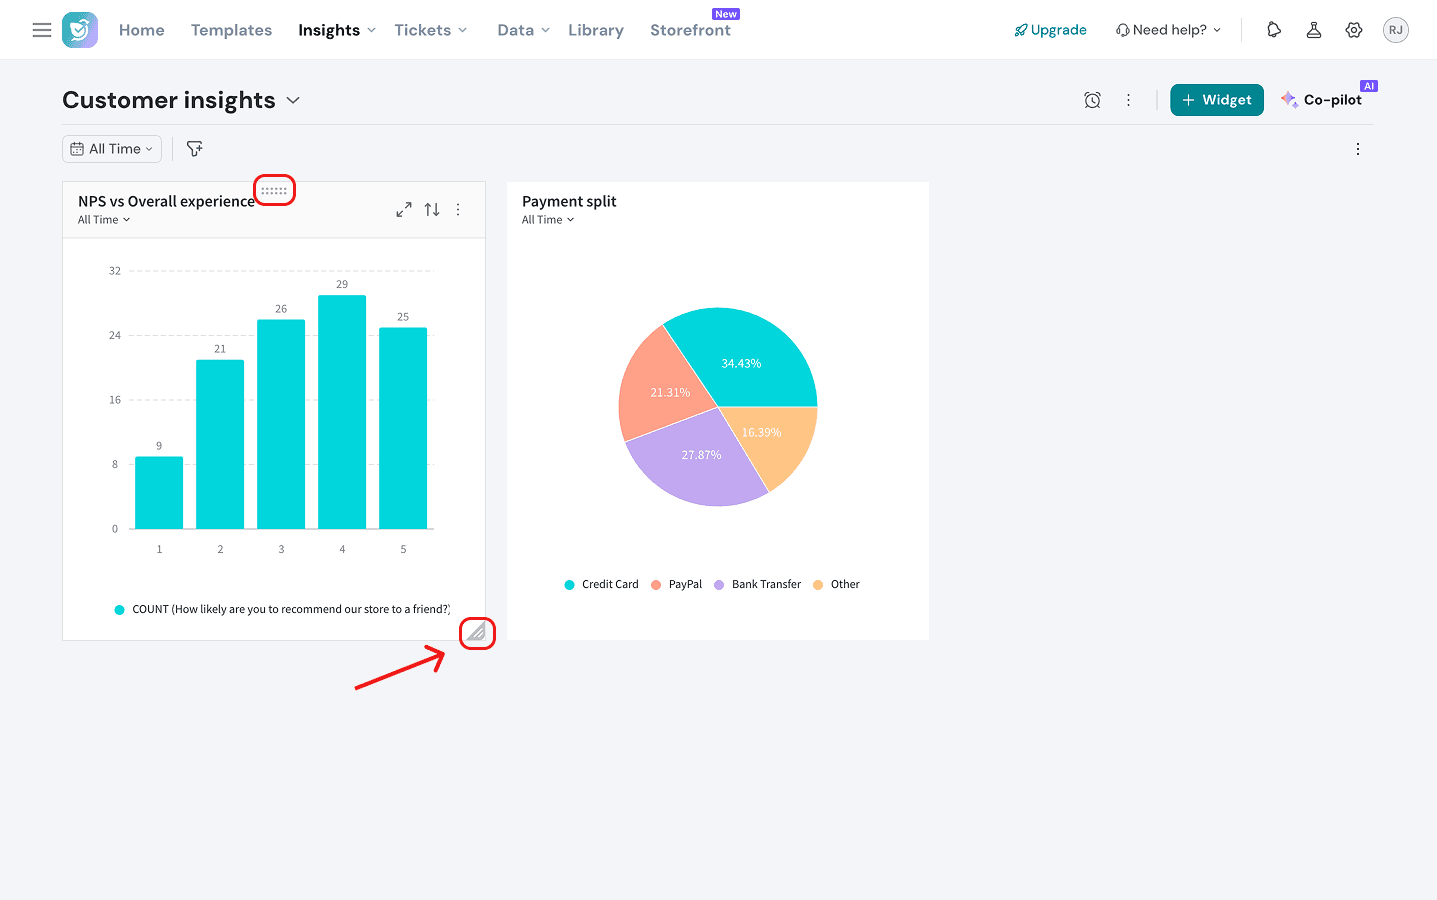
11. If you’d like to edit, duplicate, download or delete your widget, click on the horizontal three-dot icon in the right corner and a drop-down menu will appear with all the options.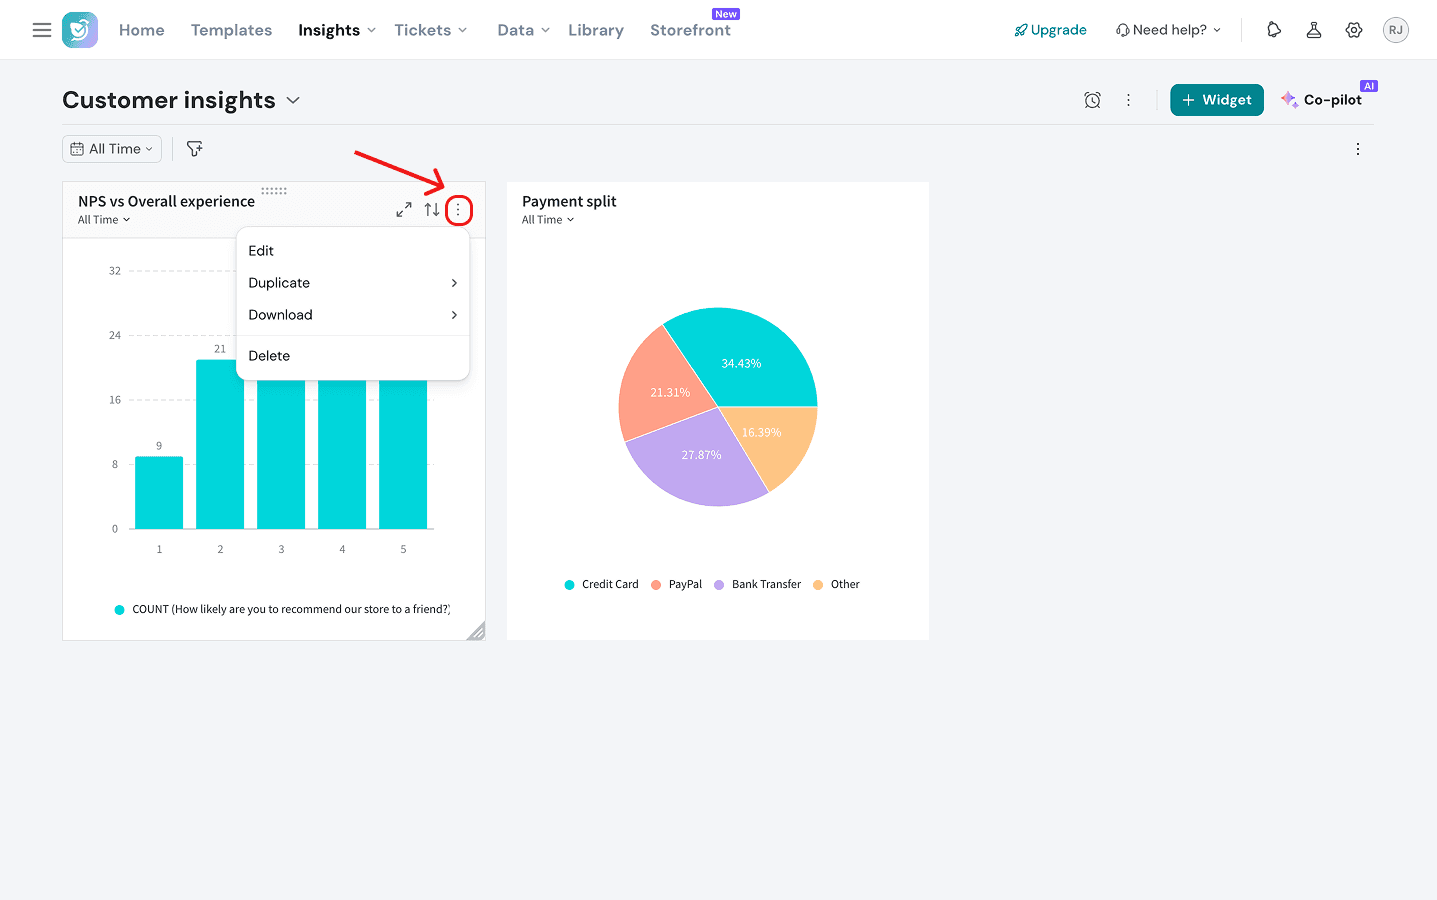
Note: If you’d like to drill-down into the data within a widget, click on the expand icon (2nd icon to the left of the three-dot icon).
12. Apart from widget level tweaks, you can also add filters at the dashboard. Click on the funnel icon to choose from a variety of options.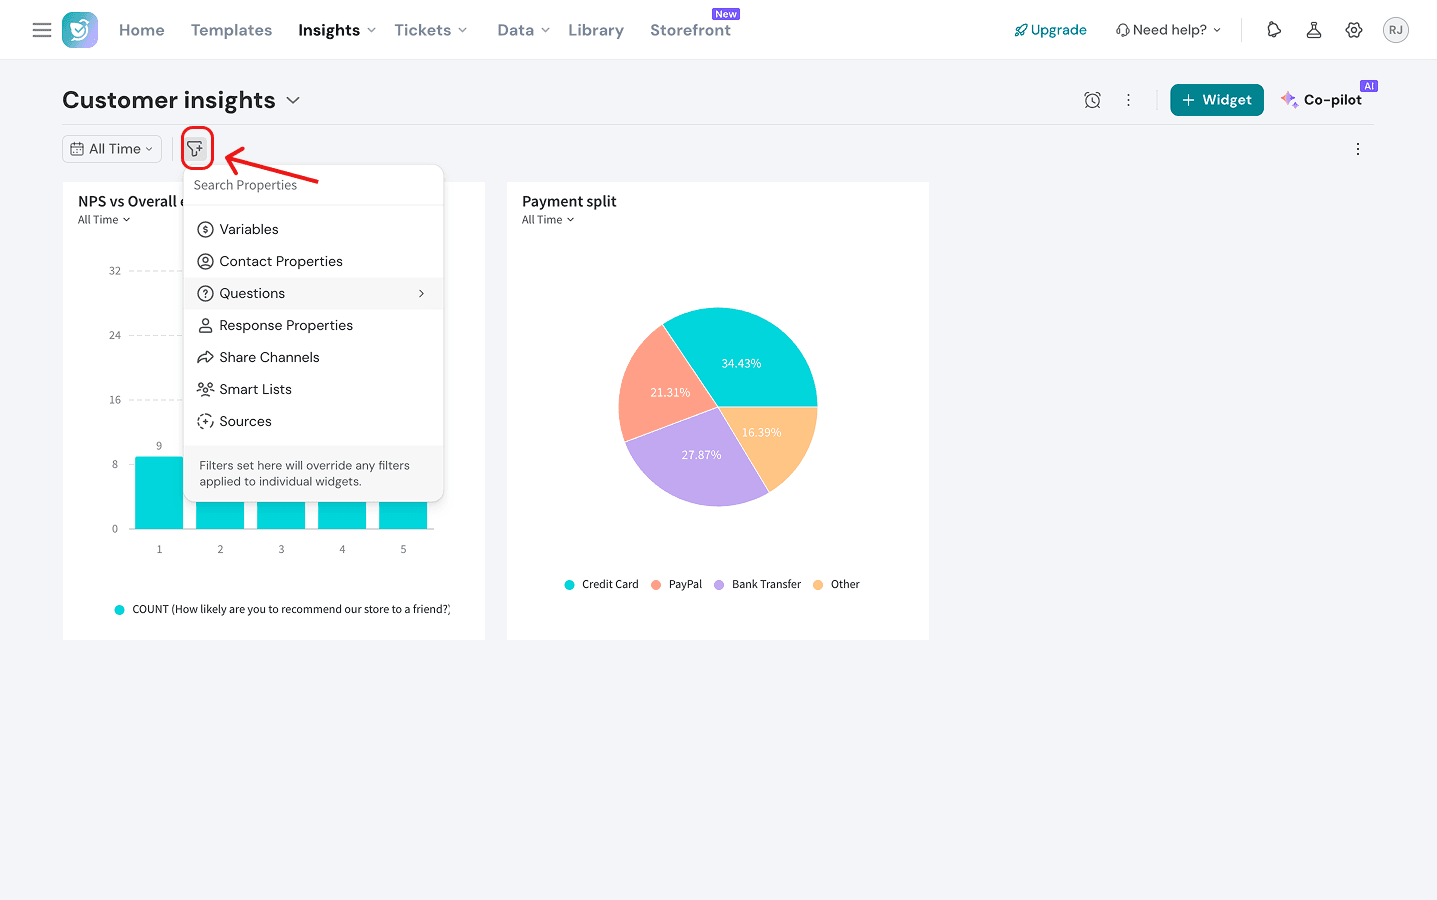
Note: A new property we’ve added is the question filter. You can choose to filter data across widgets (whose source is the same survey), based on the question and the responses.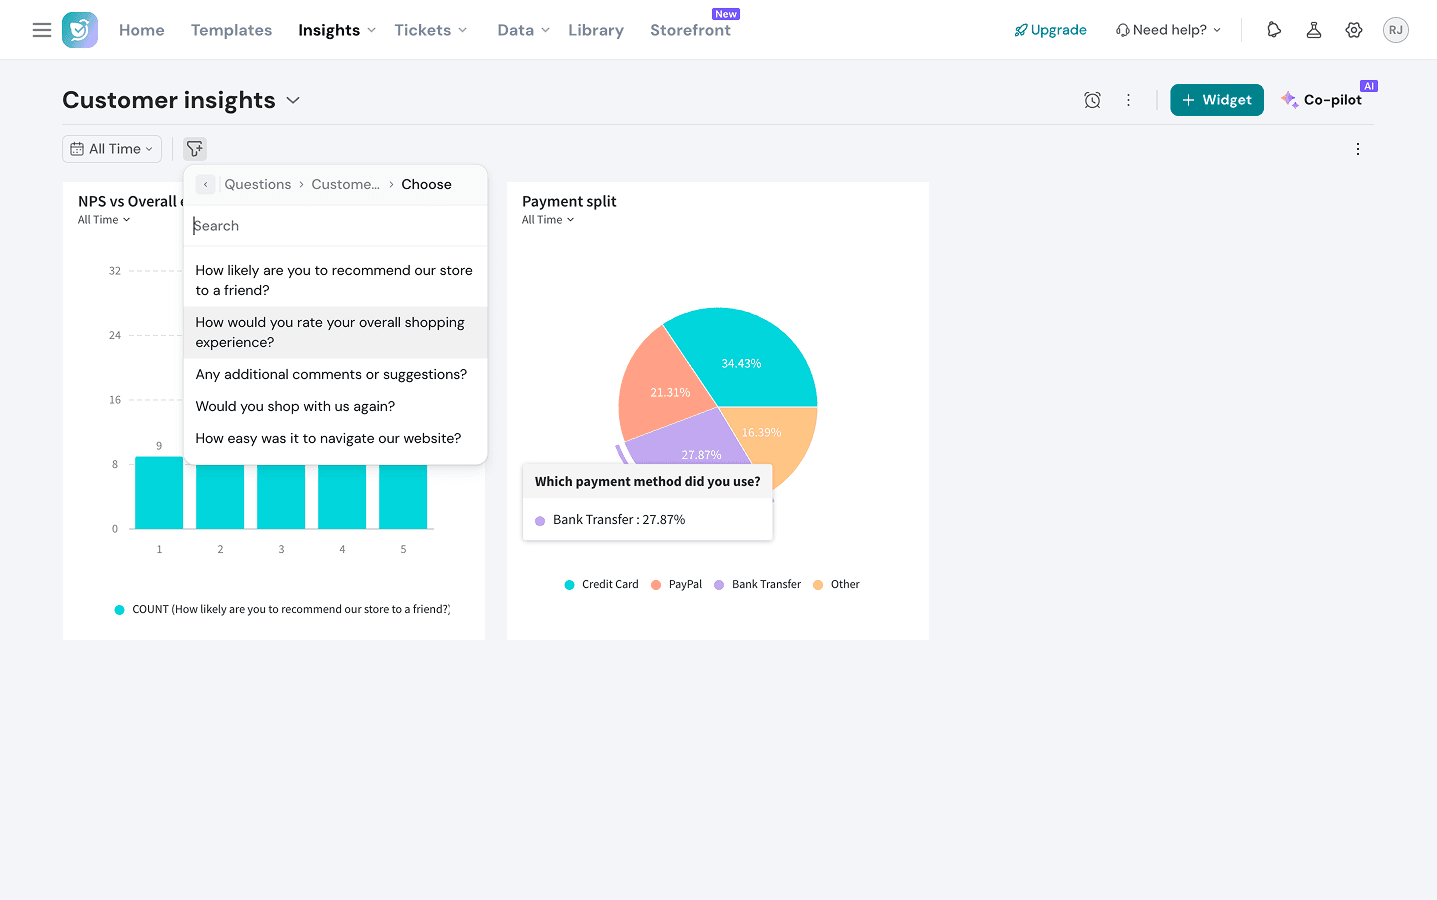
13. In addition to the general filters, you can also set time filters across the dashboard. The default option is all time, but you can choose from timeframes as short as today, till the last 365 days or even better - a custom timerange.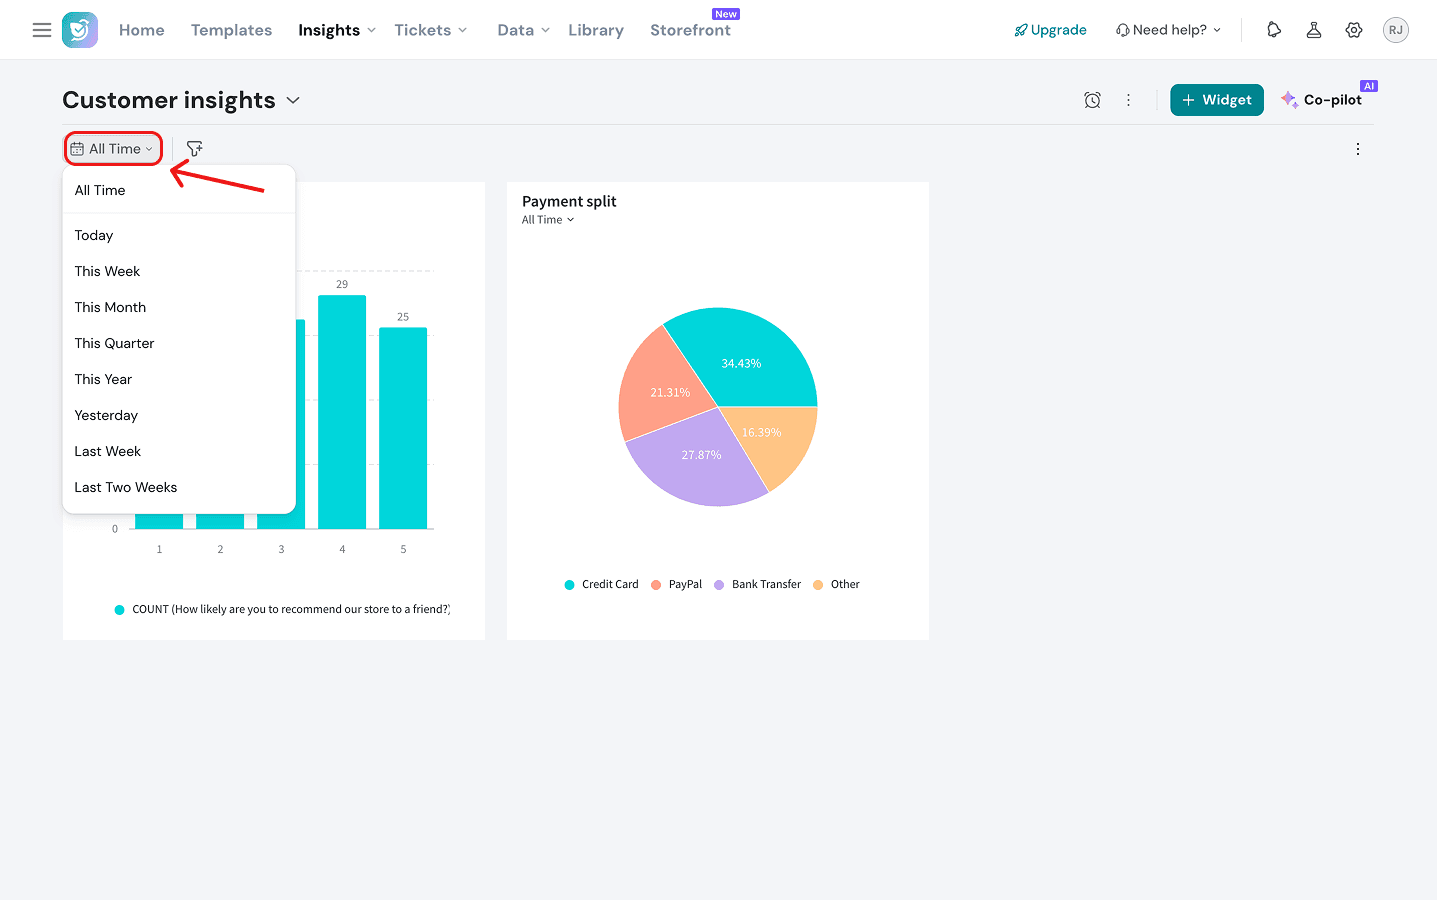
Note: If you’d like to reset these filters, click on the horizontal three-dot icon in the right edge of the dashboard and choose from the options in the drop-down menu.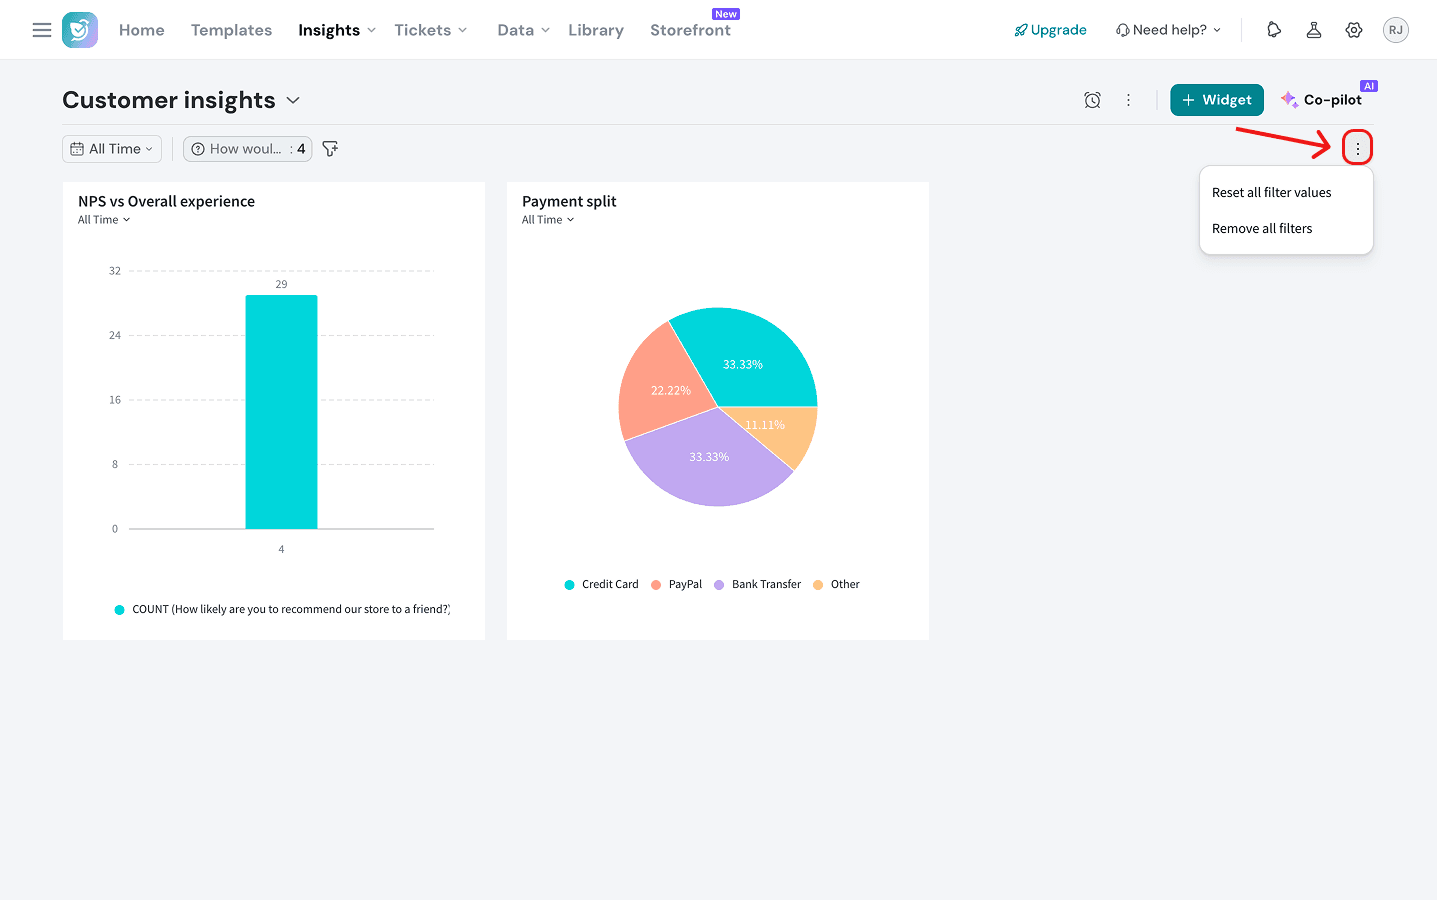
14. To edit dashboard level settings, click on the horizontal three-dot icon to the left of the Widget button on the right side of the dashboard. Here you can configure various settings to distribute the dashboard, download it, change its branding, clone it or delete it. You can also configure custom metrics that make sense for your business.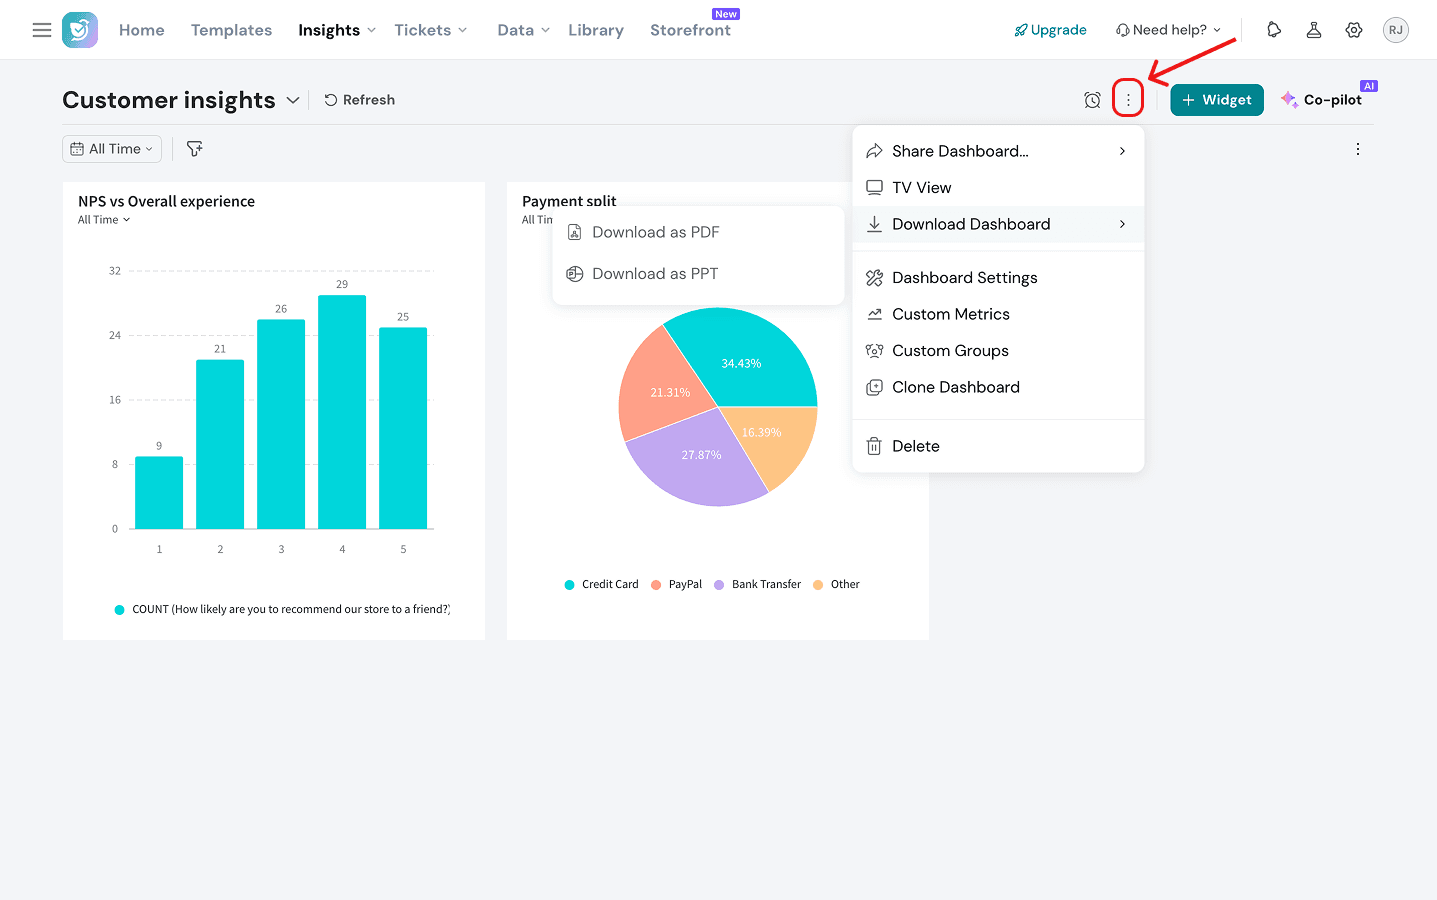
15. If you’d like to display your dashboard on a screen for executive meetings, click on the TV view option in the same menu above. You can configure the TV Dashboard, from name, theme and the access level (password-protected or accessible to anyone with the link). We recommend that you set a password to protect sensitive information.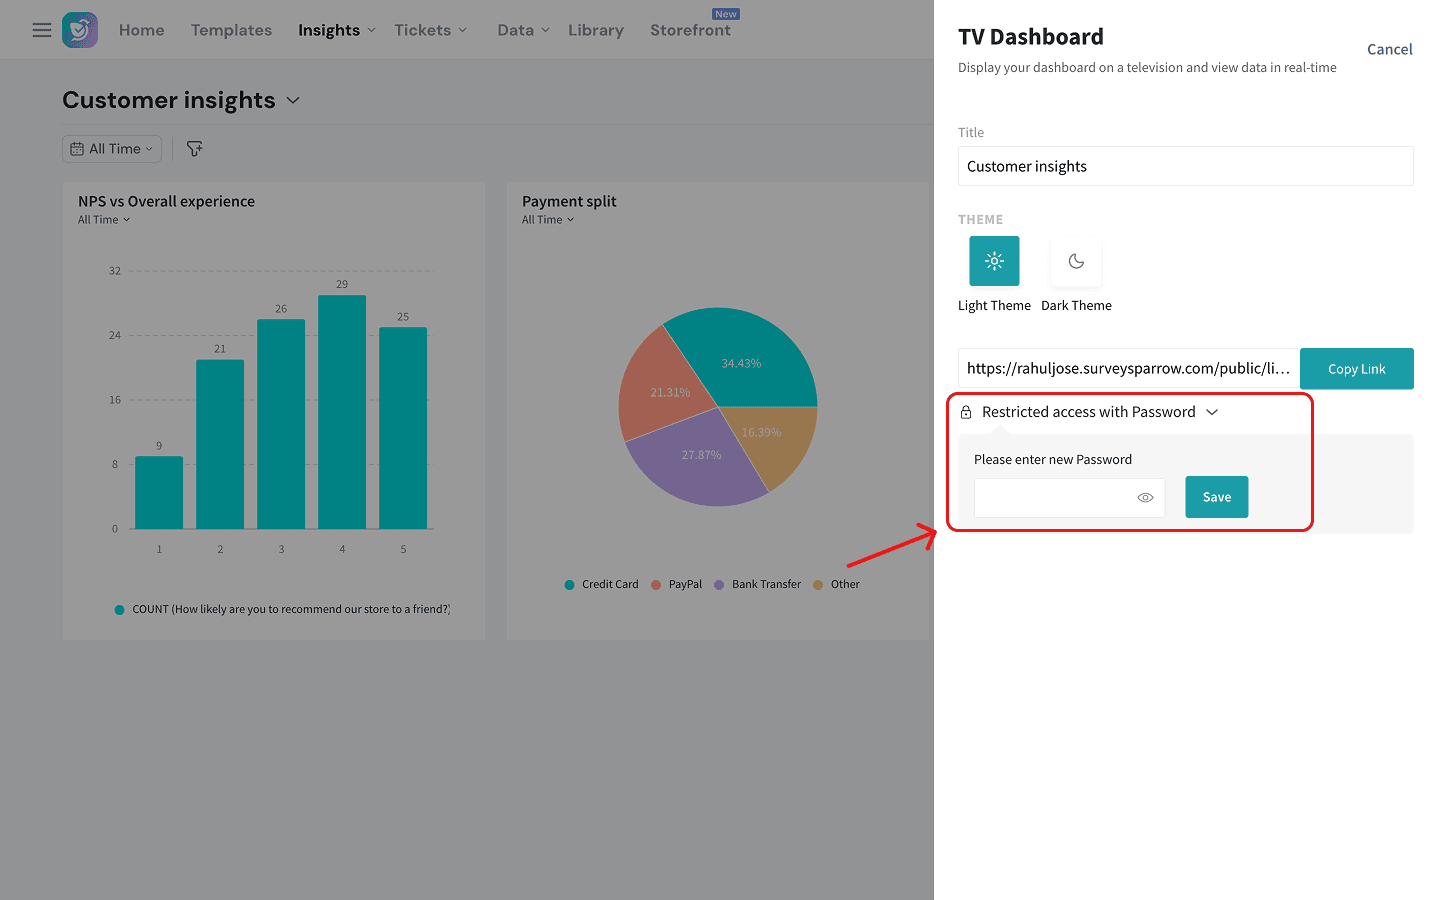
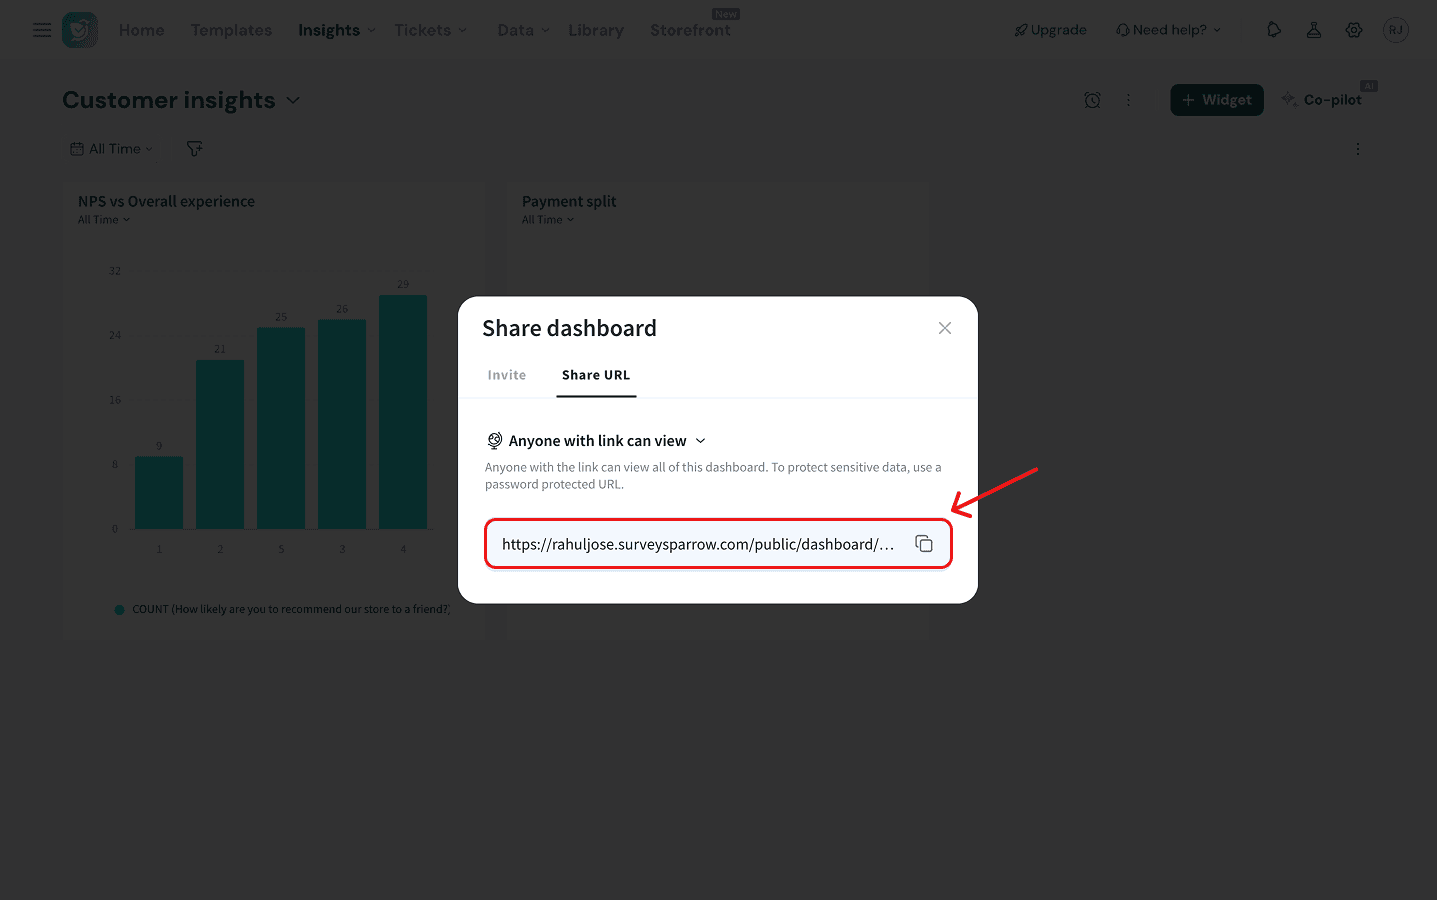
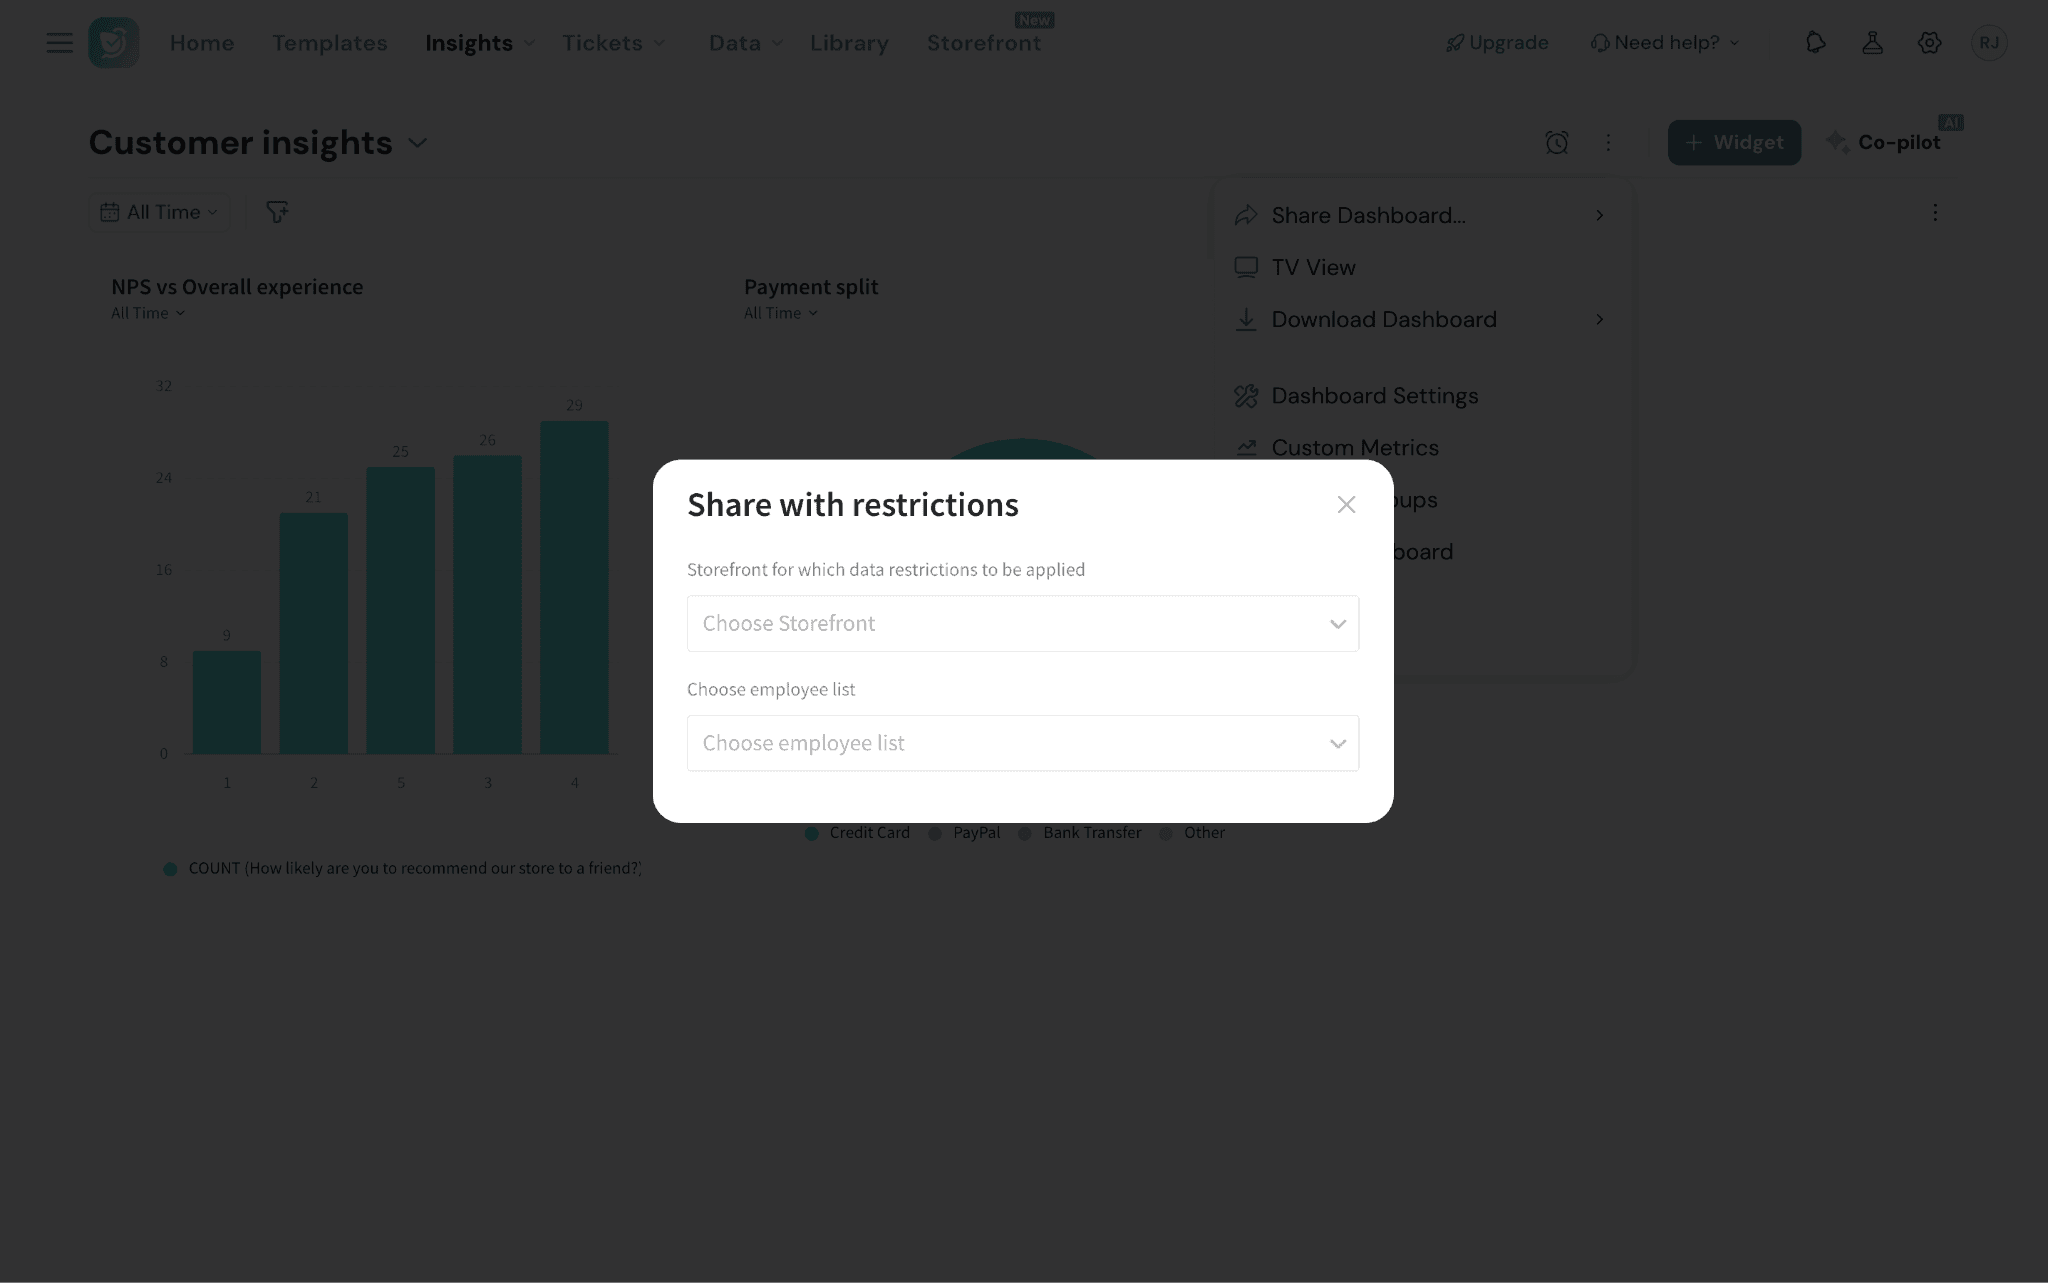
16. If you click on the Share Dashboard option in the Dashboard settings menu, you have two options:
- Unrestricted access: You can invite individuals from your contacts/employee lists or generate a URL that anyone can access.
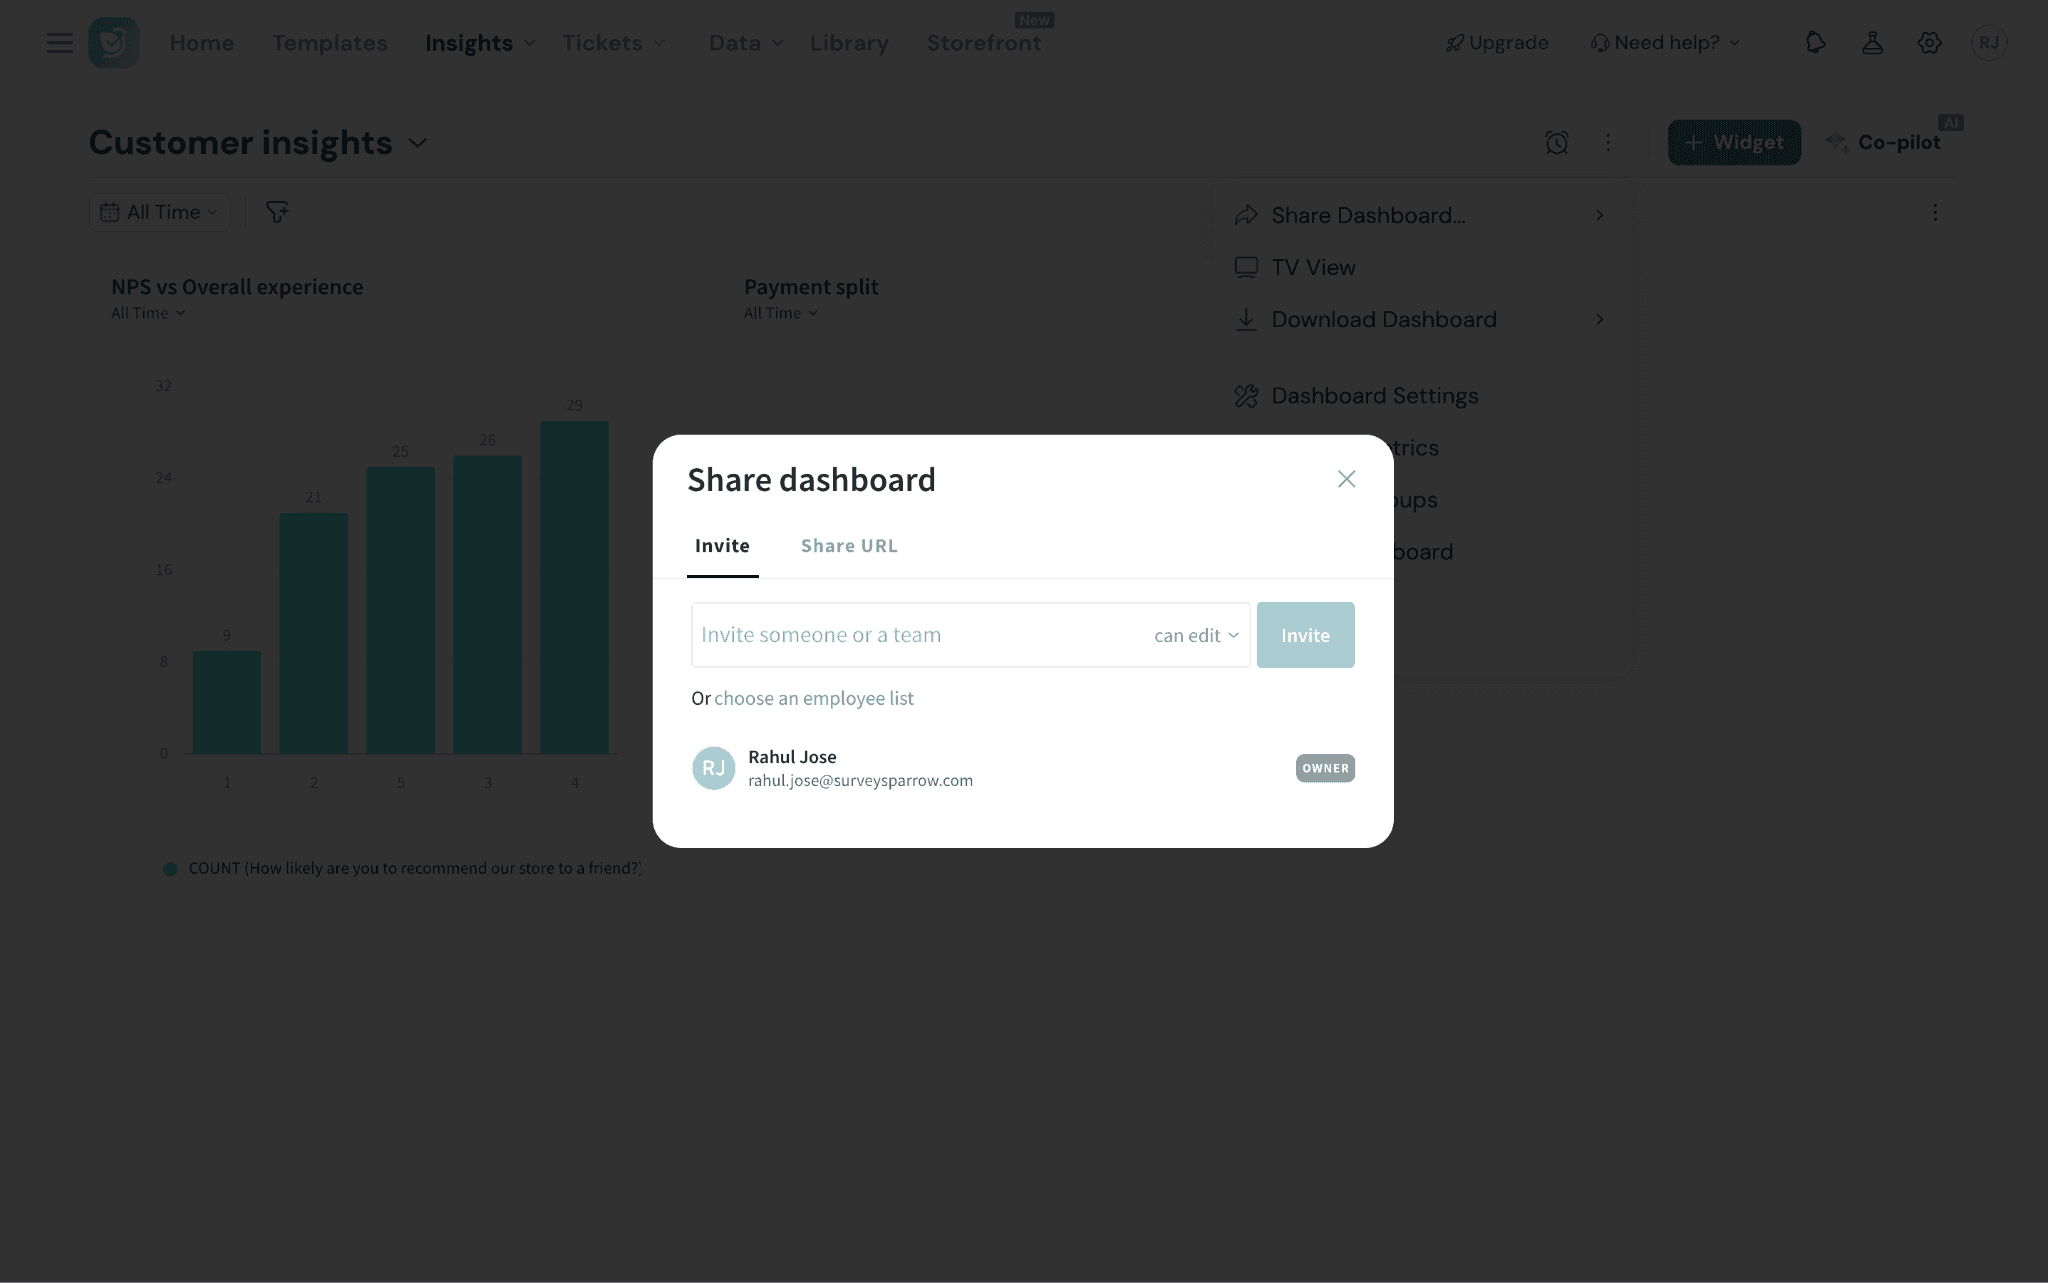
- Restricted access: You can share it with employees who have access to a particular storefront. You can choose the Storefront and the corresponding employee lists.
17. If you’d like to refresh the dashboard’s data, hover over the top of the dashboard. The Refresh icon should appear, click on it.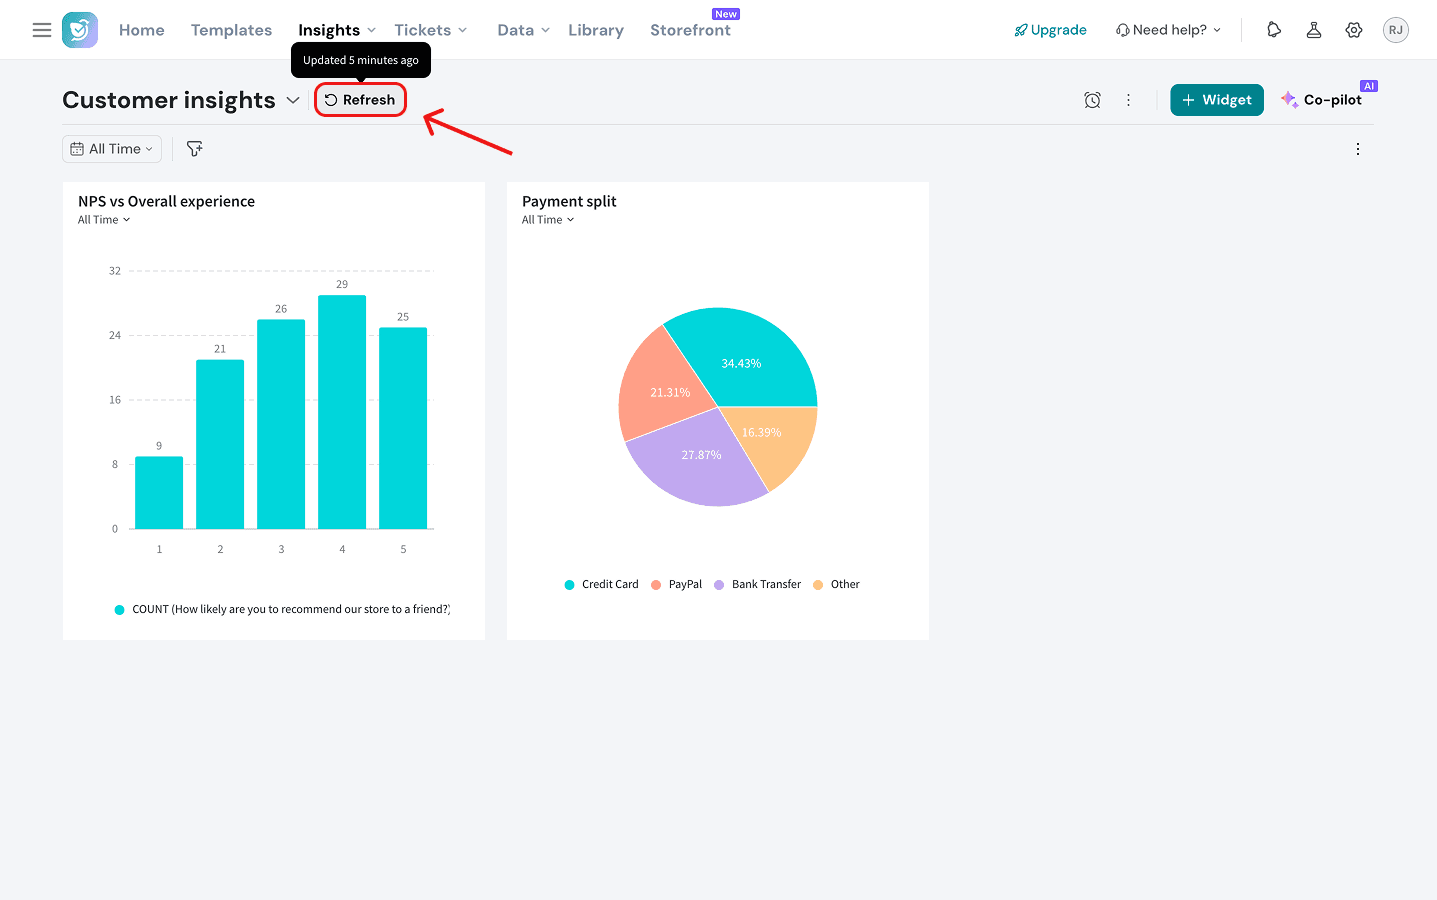
18. If you’d like to set alerts for critical metric thresholds, you can set alerts by clicking on the clock icon. To learn more about alerts, read this article.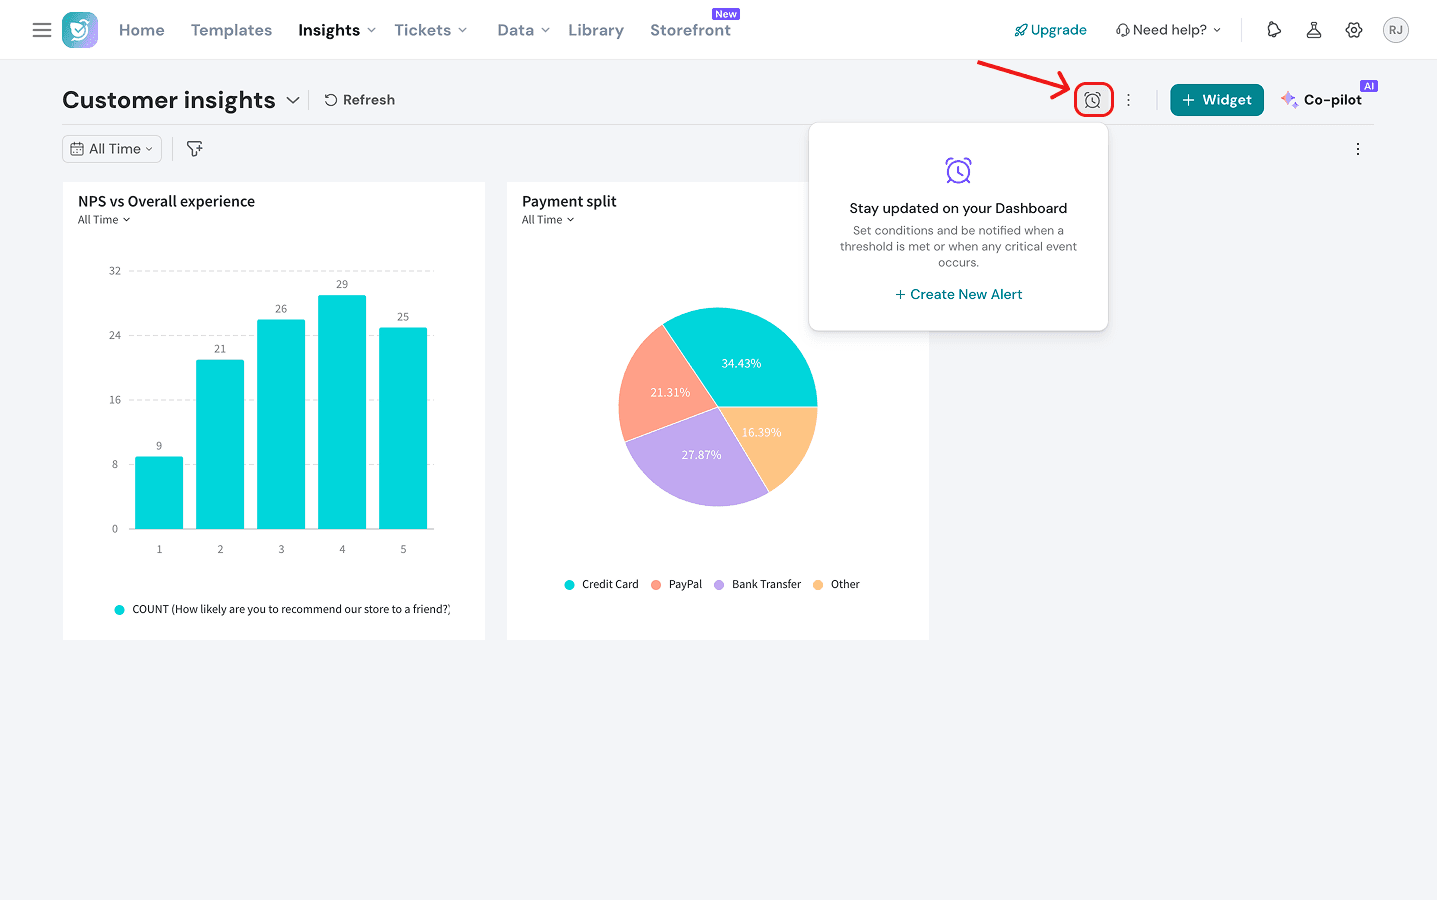
19. Finally, to create a new dashboard or switch between dashboards, click on the dashboard title. A drop-down menu will appear with all the existing dashboards. You can click on any title to switch to that dashboard, or click on New Dashboard to create a new one.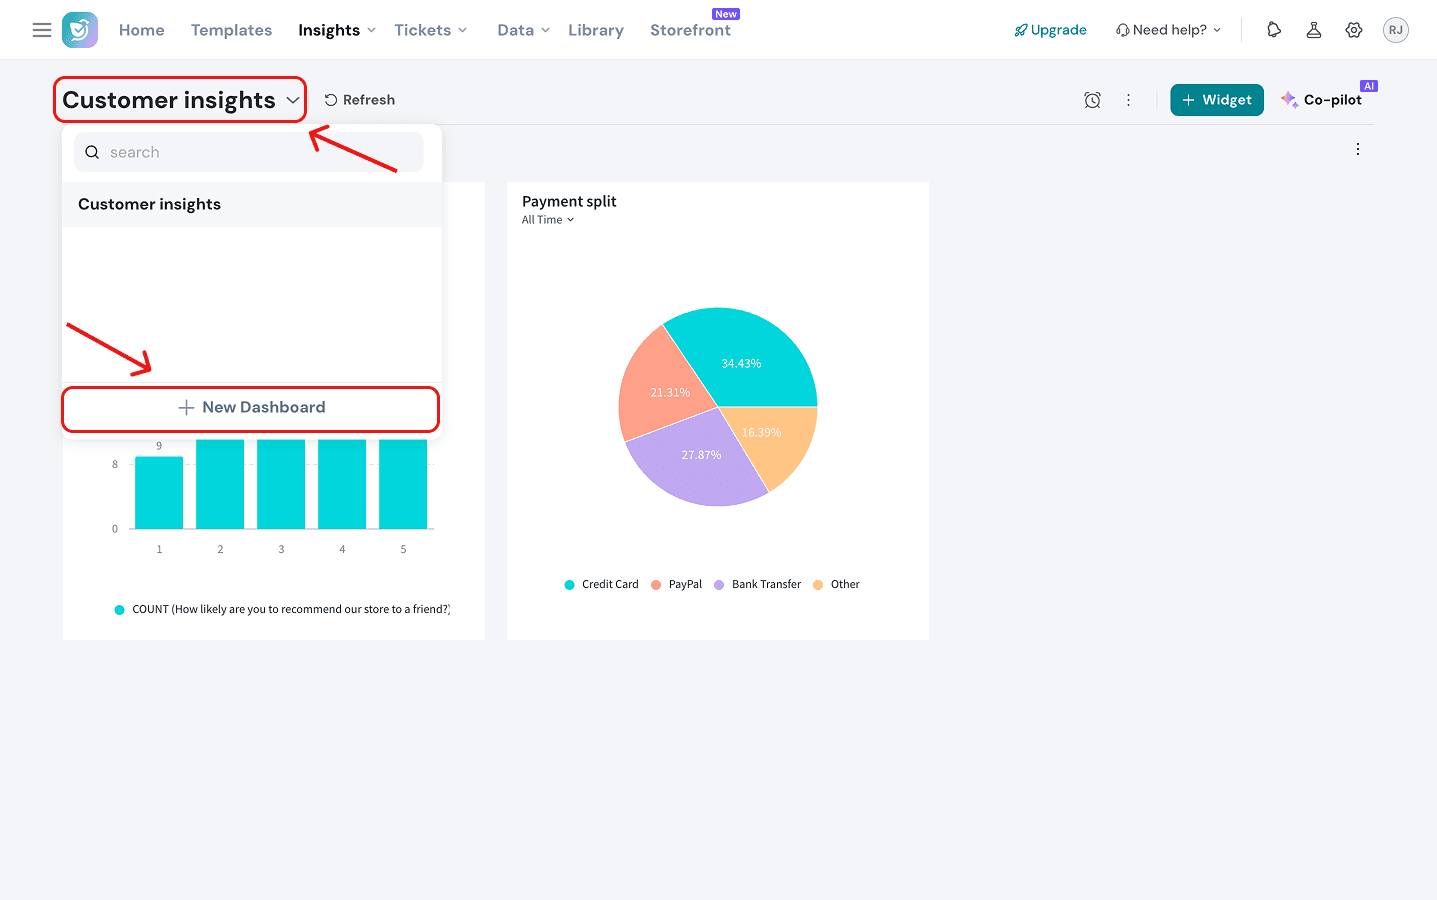
With this, we come to the end of this article. Before we close, here are a few advantages of Executive Dashboard that you must know:
- Compare, correlate & visualise survey data
- Slice & dice survey data with multiple dashboards
- Create and customise widgets to represent information effectively
Reach out to us anytime if you have questions. We are more than happy to help you :)