
Foresight
What is Foresight?
Foresight helps you identify customers who may be at risk early.
It analyses signals across feedback, usage, CRM data, and interactions to highlight which customers need attention, why, and what you can do next.
Why use Foresight?
Customer issues don’t start when they become visible; they build up over time.
Foresight helps you:
- Spot risk early
- Understand what’s changing
- Take action before it impacts your business
How does Foresight work?
Foresight turns multiple signals into clear actions:
Signals → Risk → Insight → Action
- Detects early changes in customer behavior
- Assigns a risk score
- Highlights key drivers
- Recommends next steps
How to use Foresight?
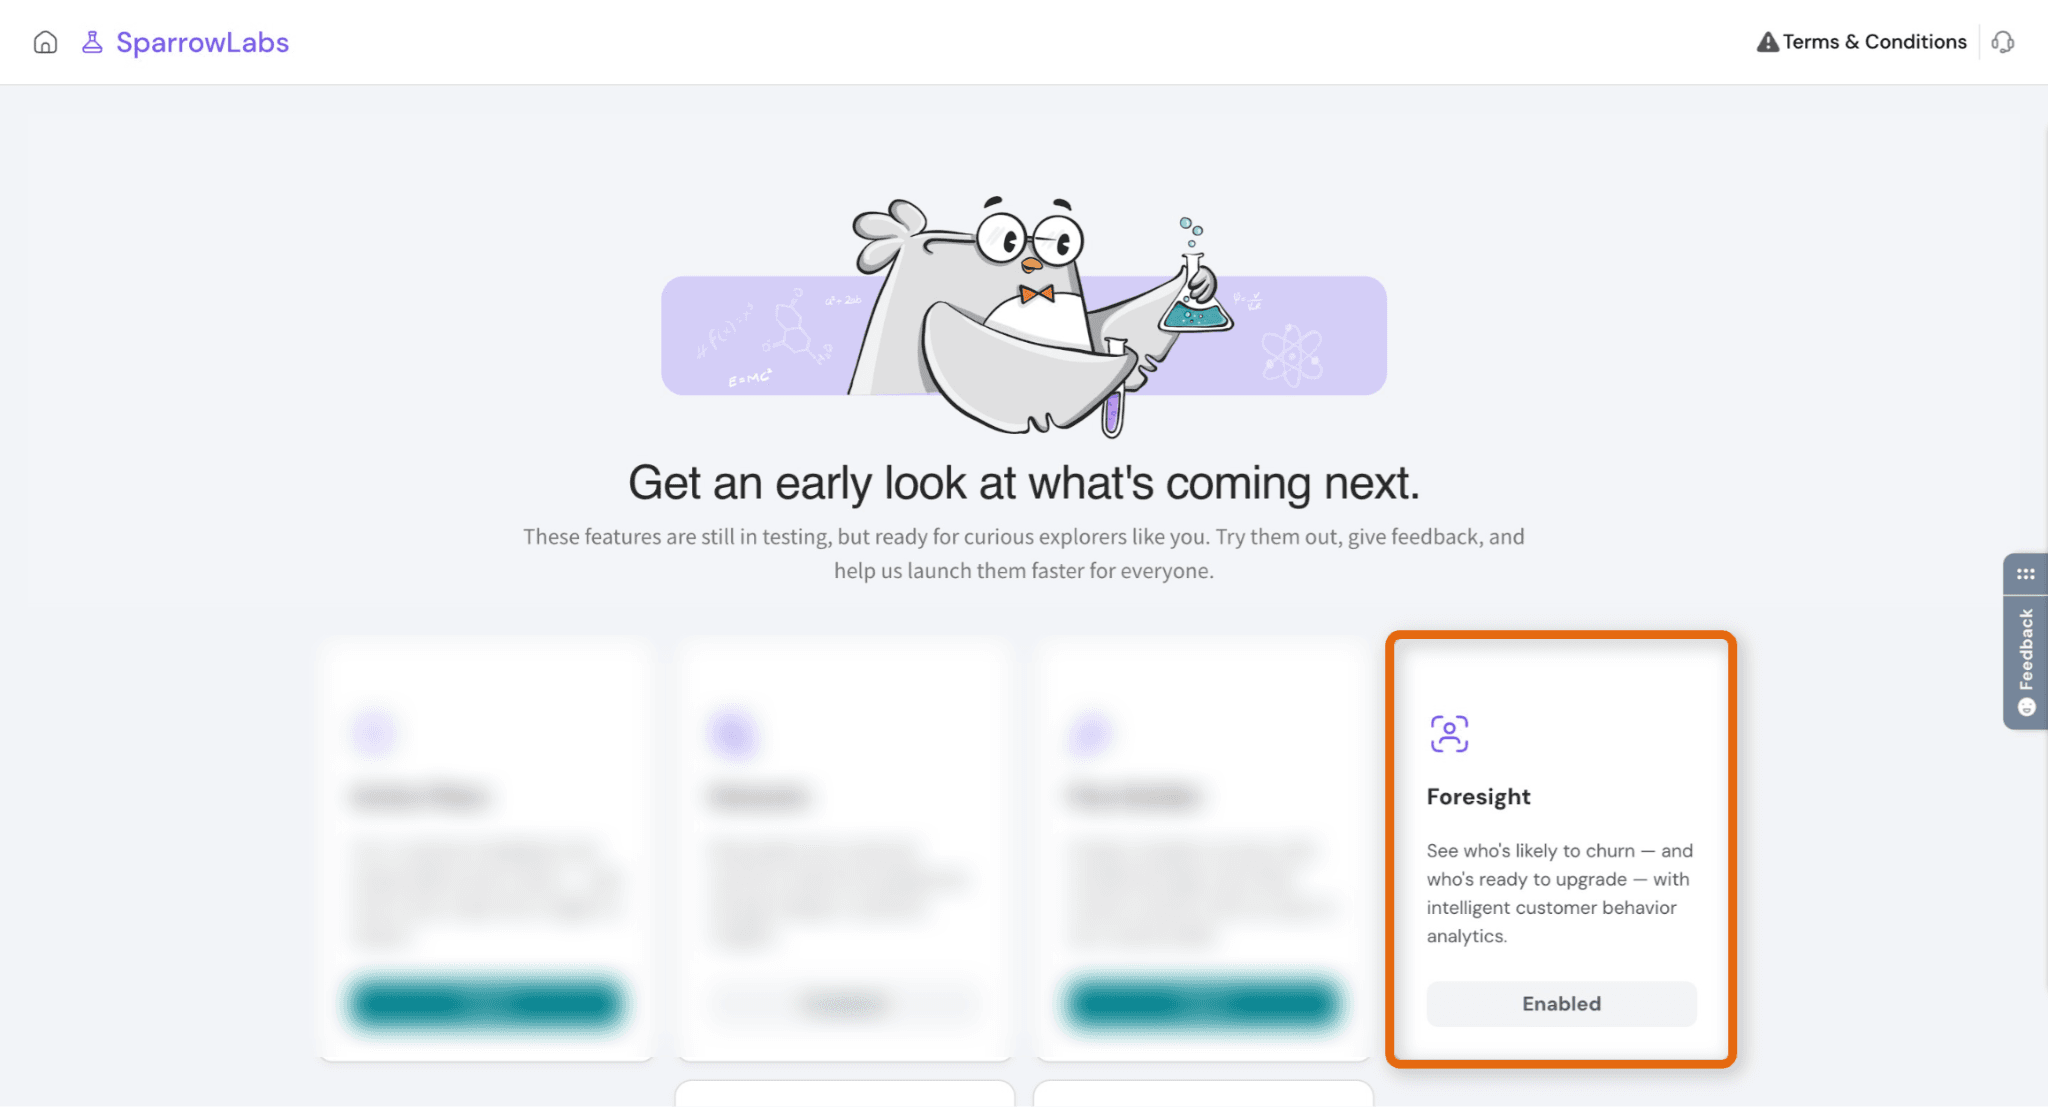
Step 1: Enable Foresight (if not enabled)
Click on the Labs (beaker icon)
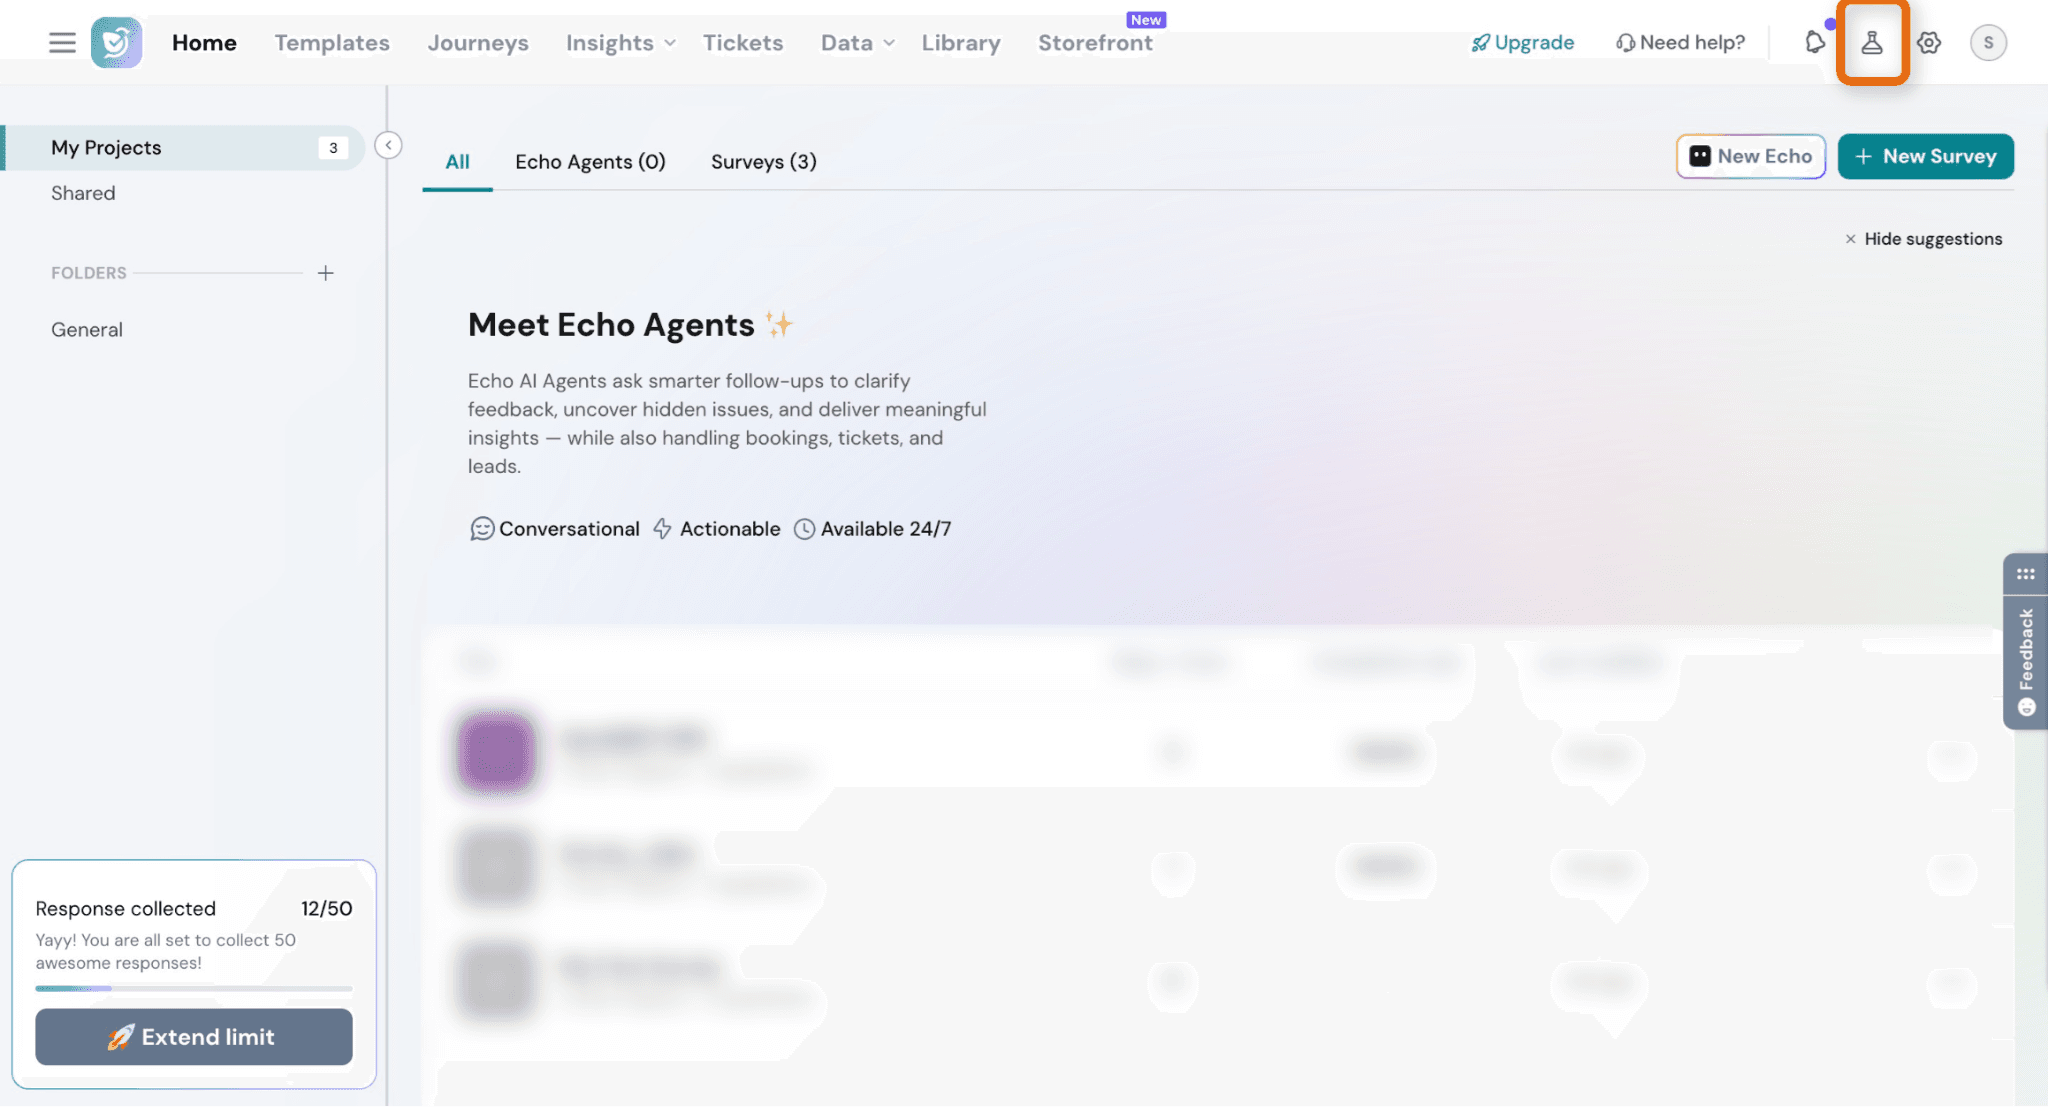
- Enable Foresight
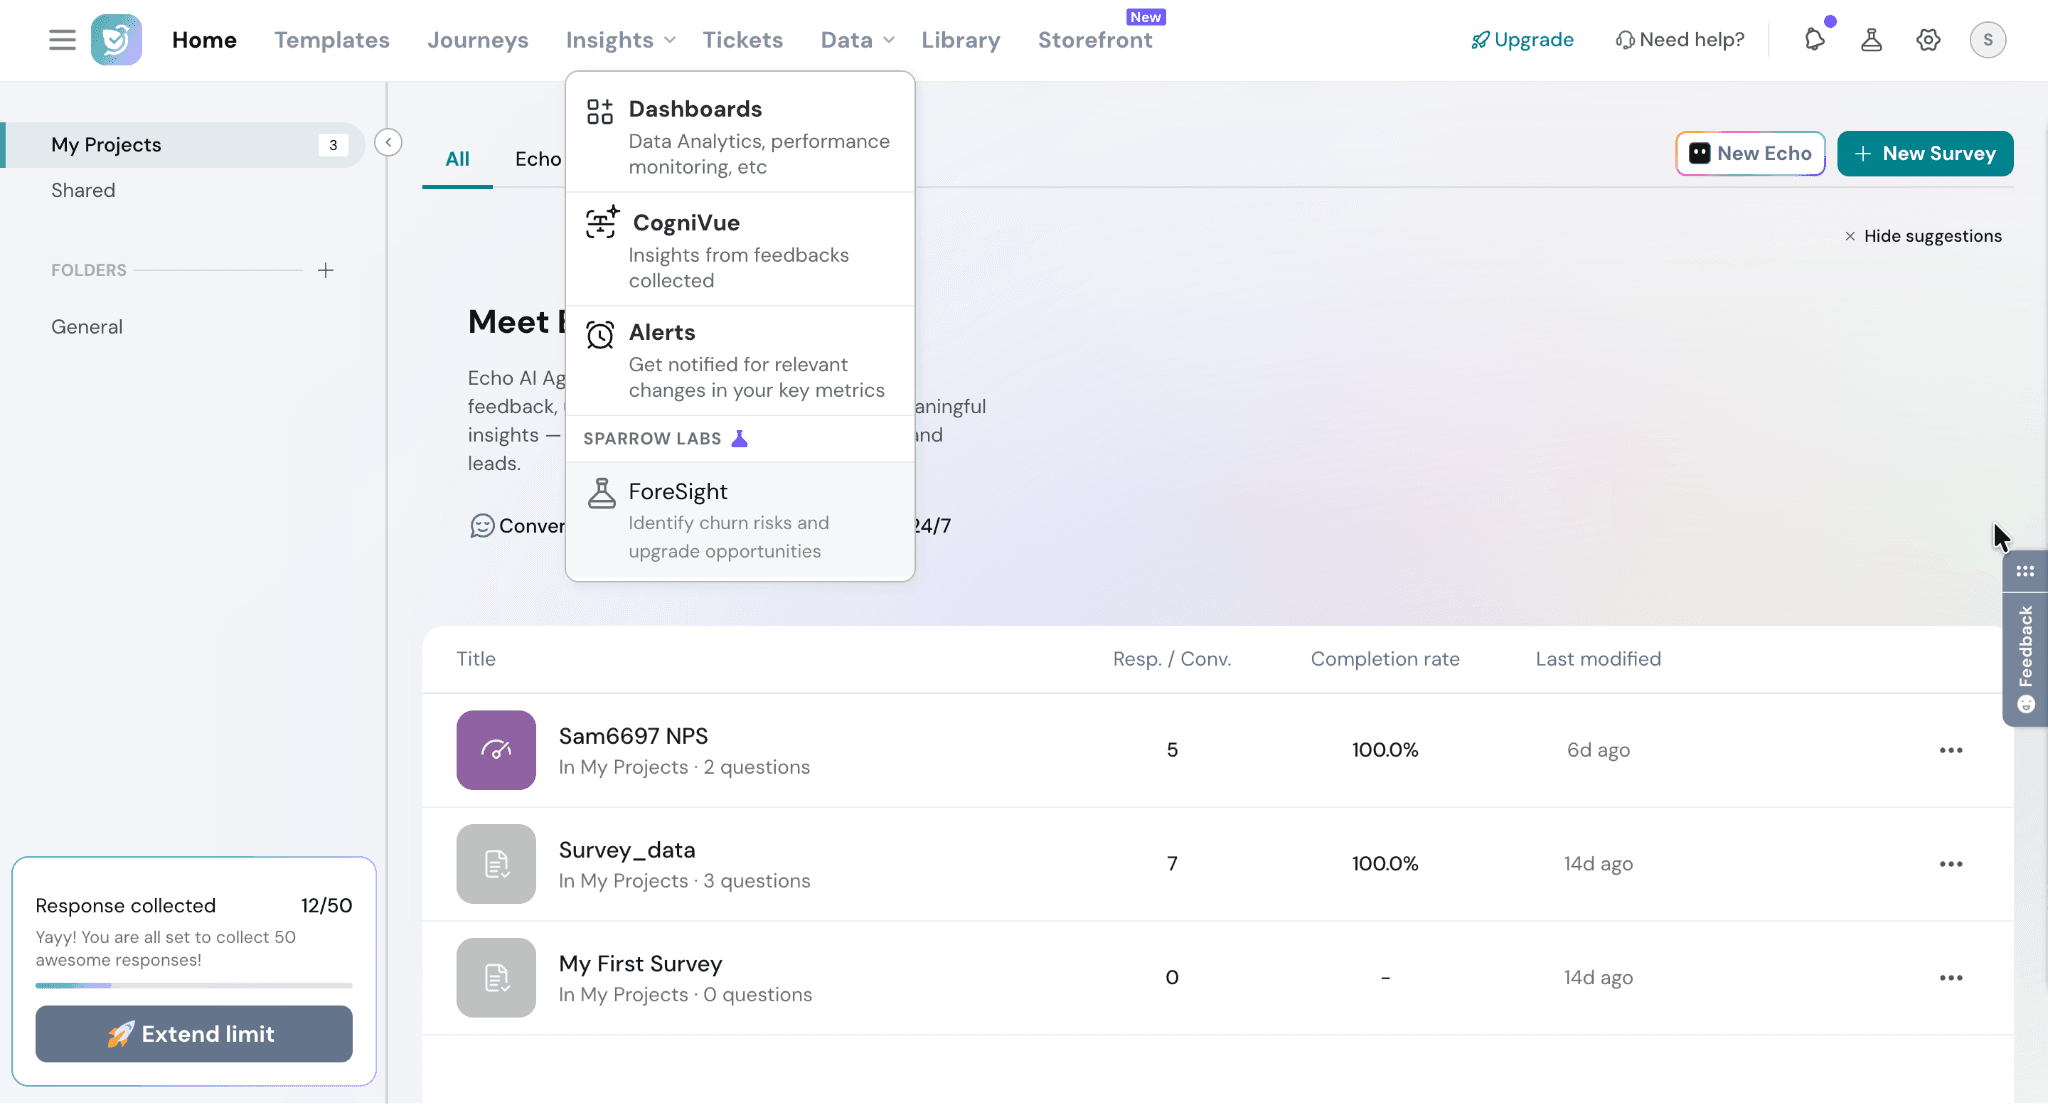
- Click on Insights and select Foresight
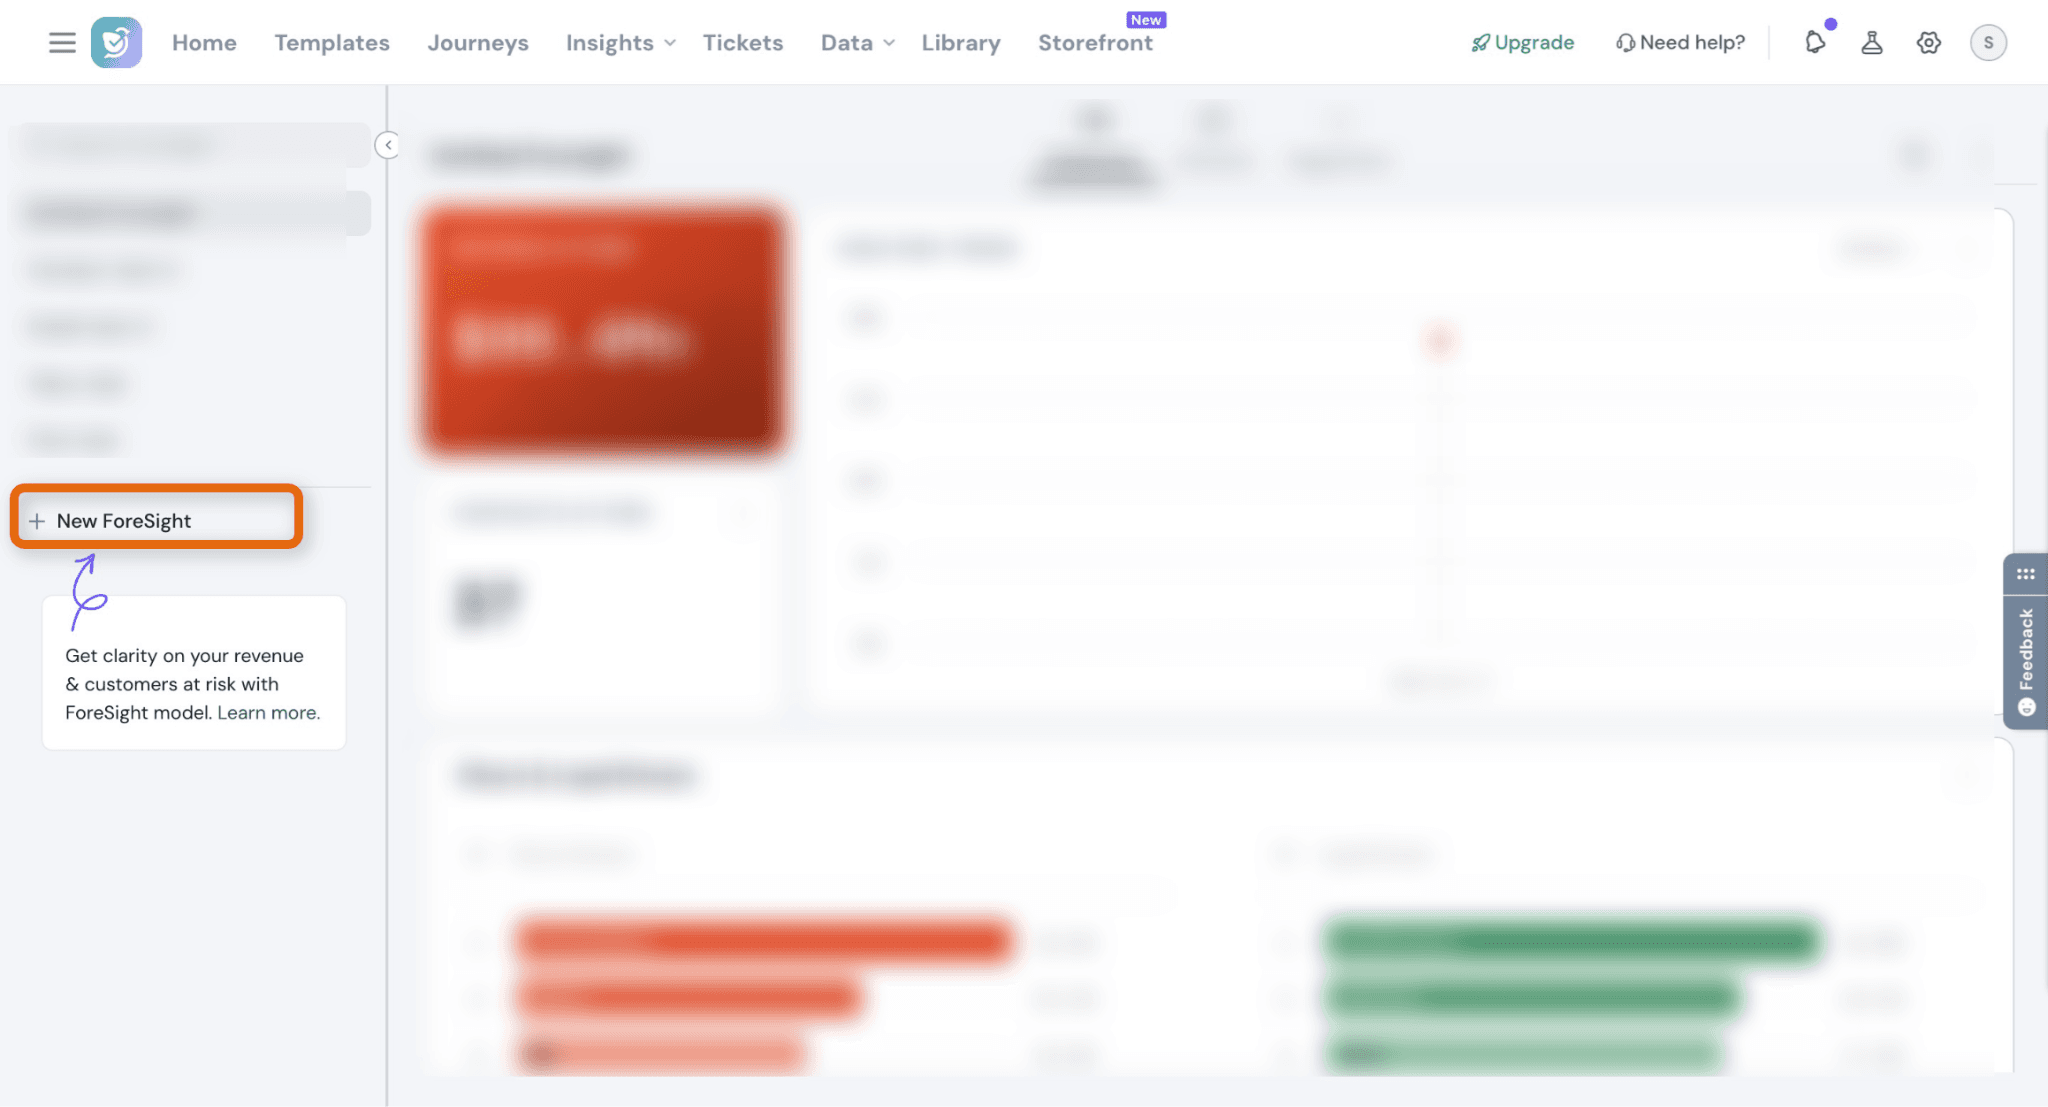
Step 2: Create a new Foresight model
- Click New Foresight
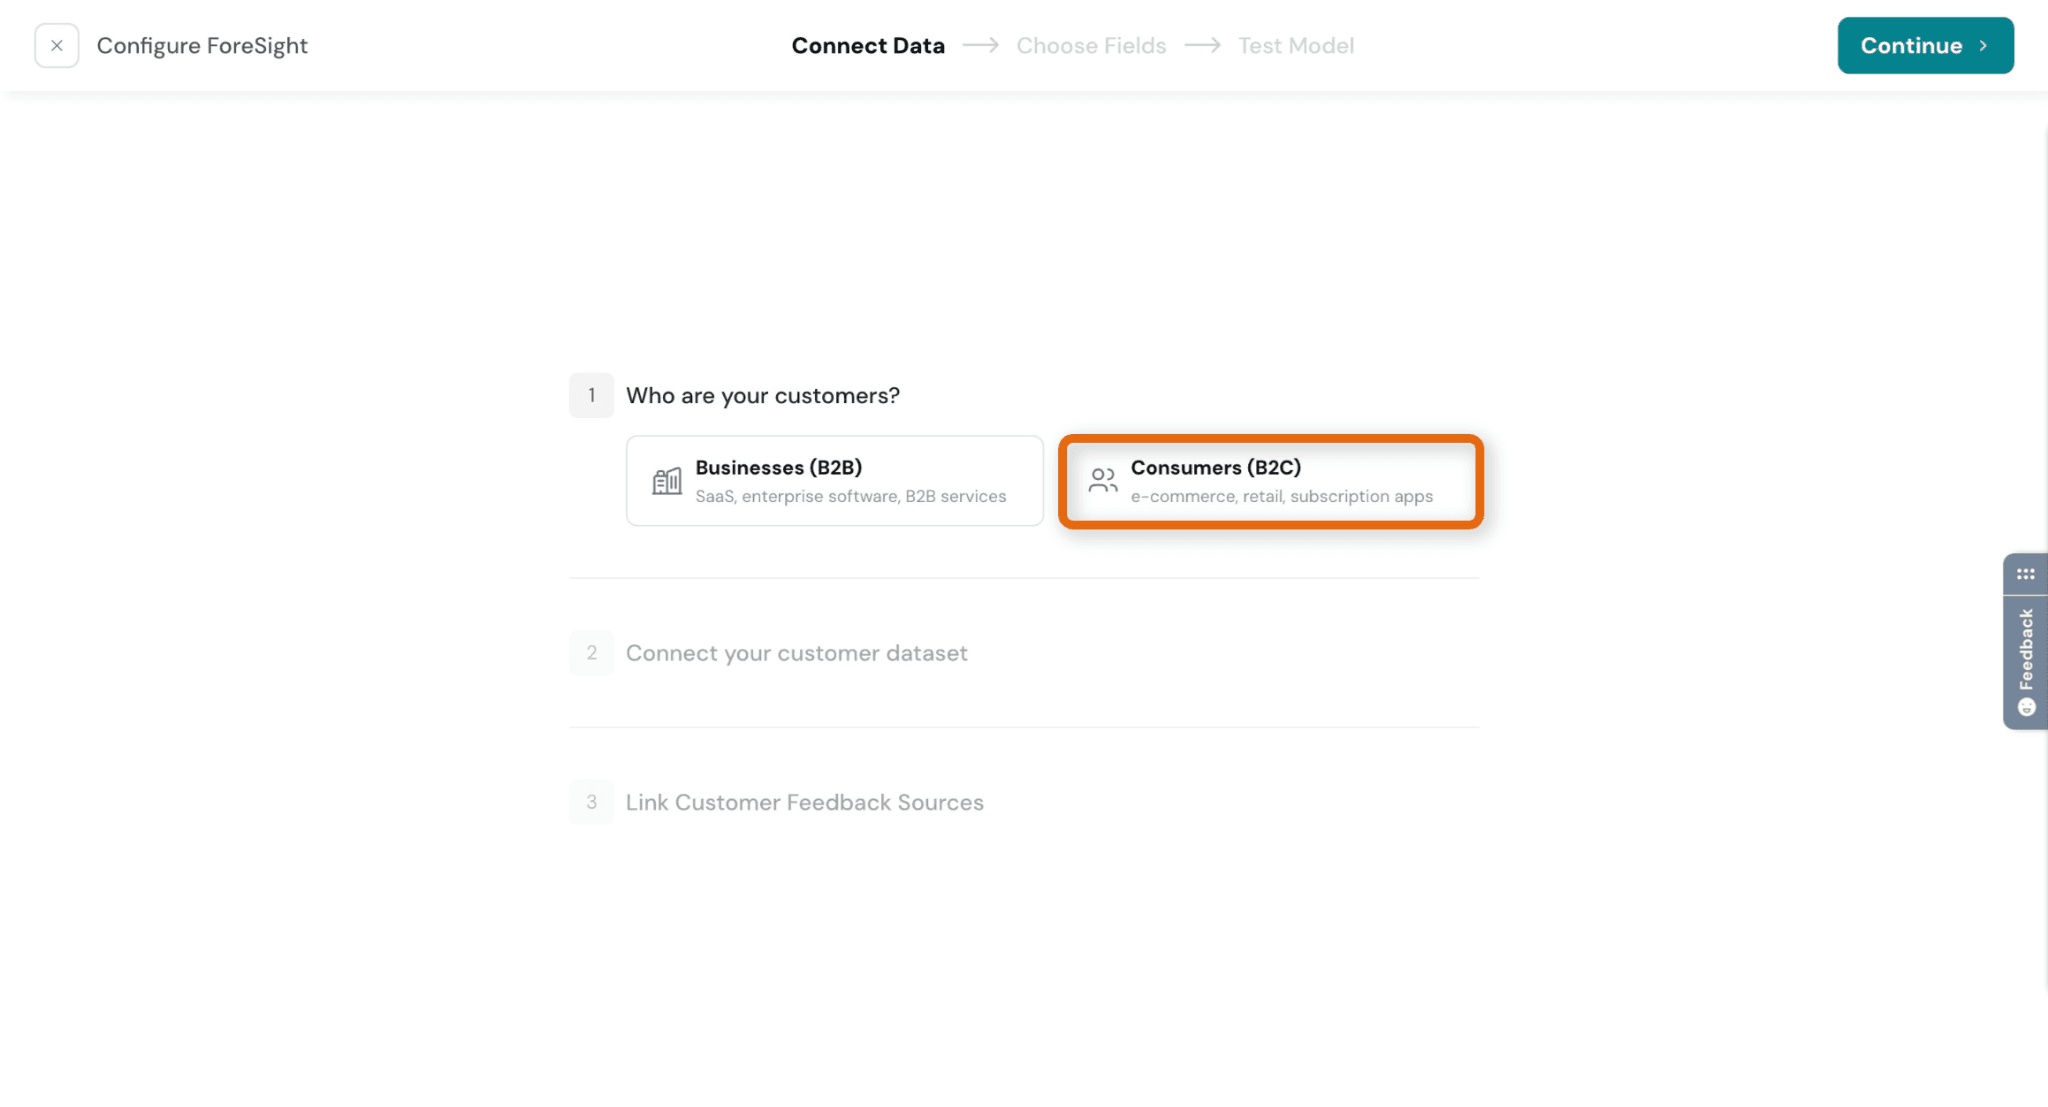
Step 3: Select customer type
Choose how you want to predict risk:
- Businesses (B2B) → account-level prediction
- Consumers (B2C) → individual-level prediction
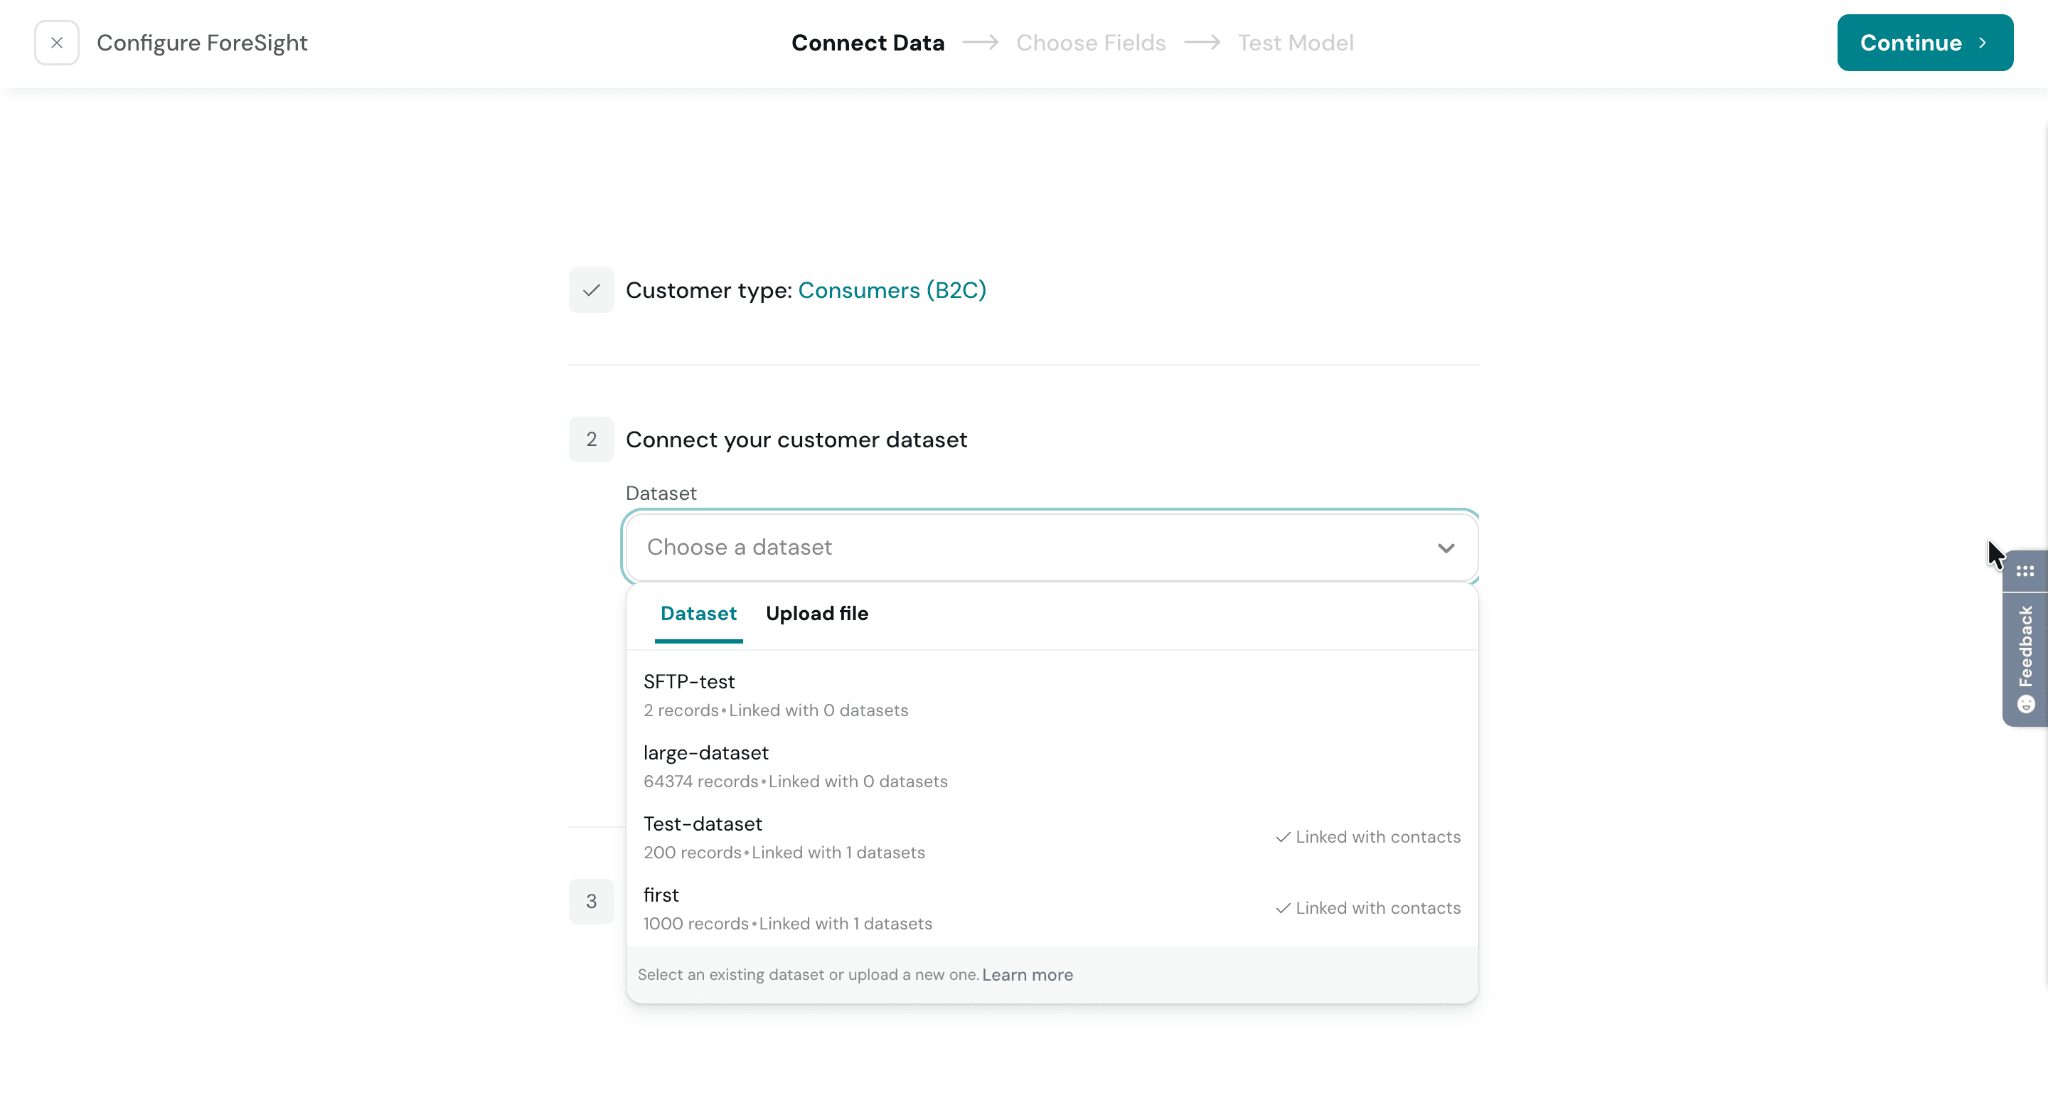
Step 4: Connect your dataset
- Ensure Datasets are enabled in Labs, as Foresight depends on it.
- Select an existing dataset or upload a new one
- Ensure your dataset contains relevant customer data
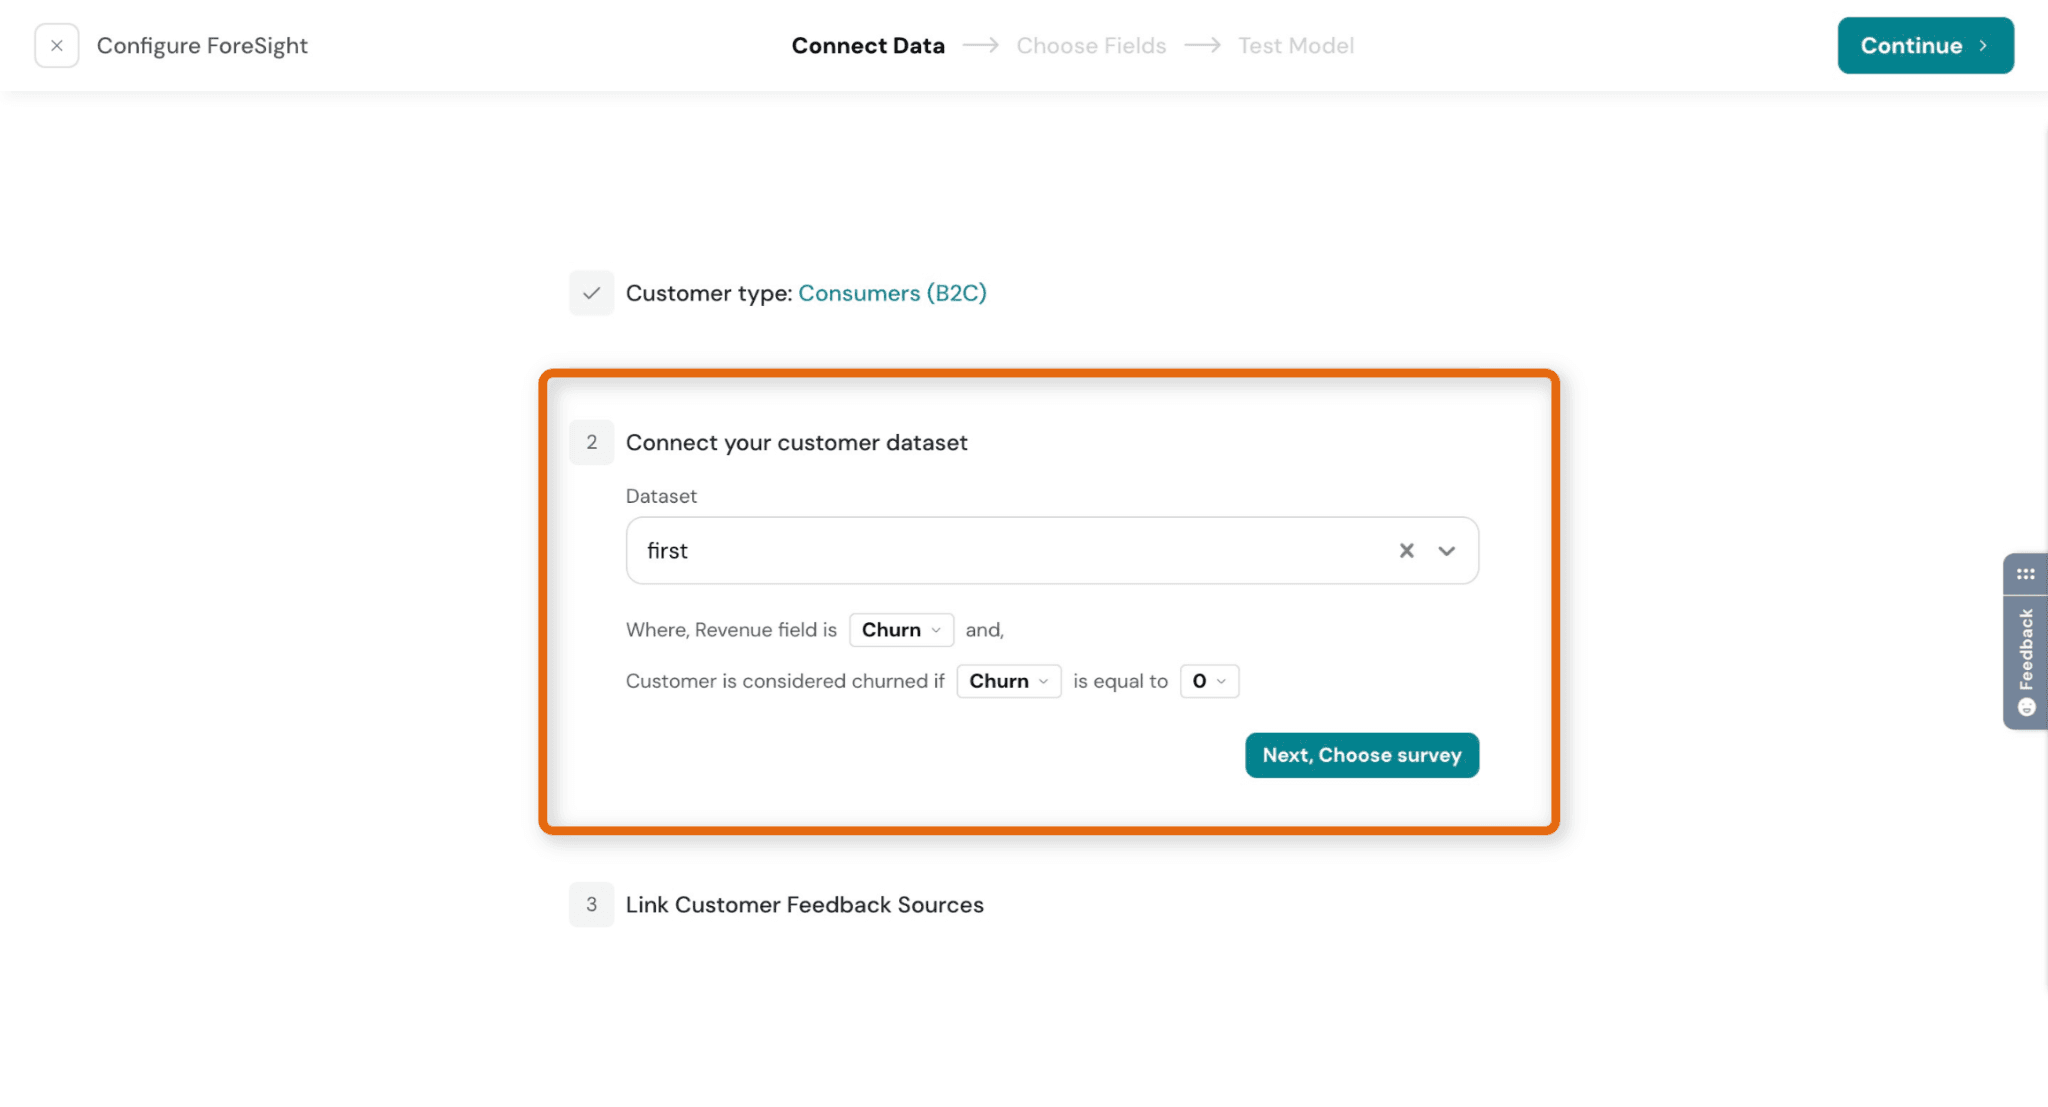
Step 5: Define outcome (target field)
- Select the field that represents the outcome (e.g., churn)
- Define what value indicates the outcome
👉 Example: “Churn = 0” - Select Next, Choose survey
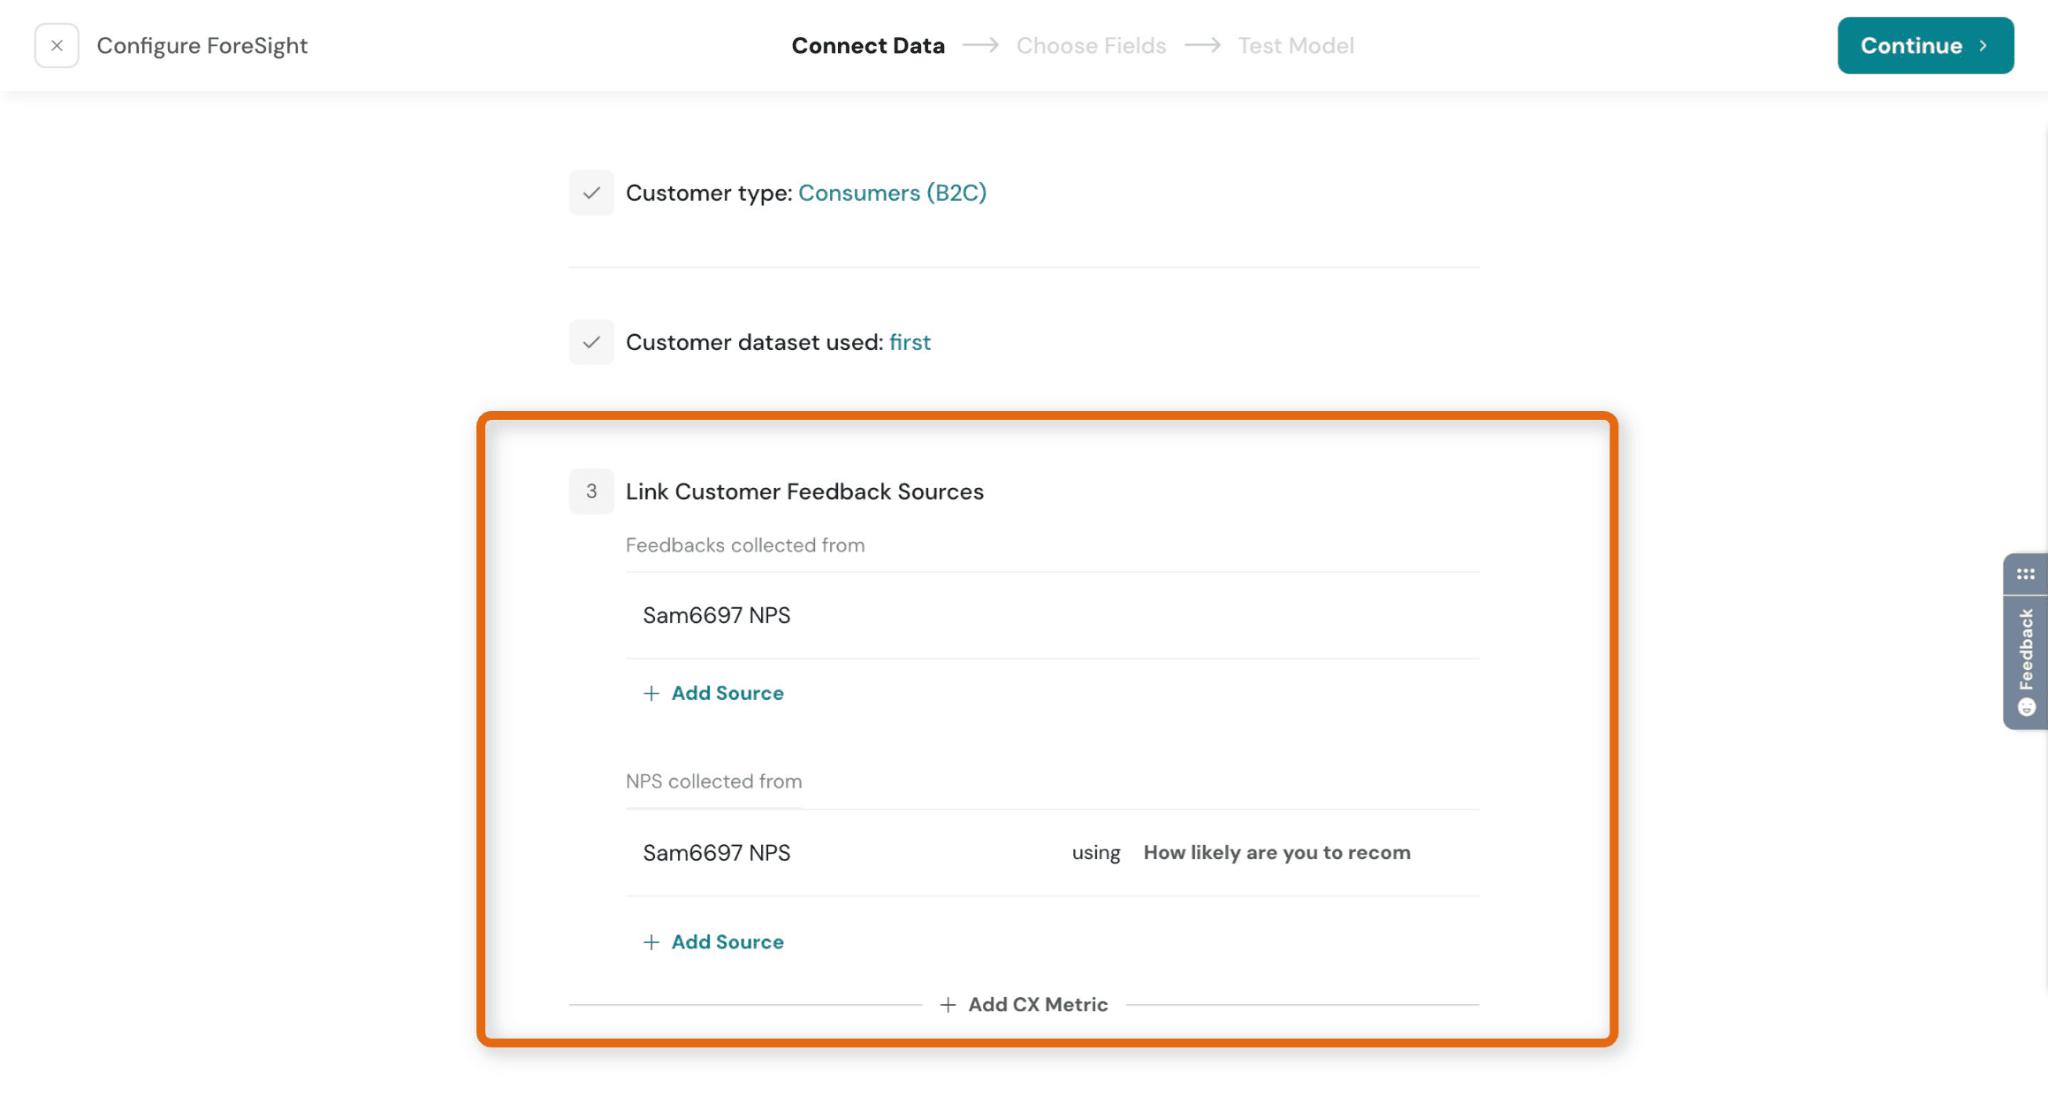
Step 6: Link feedback sources
- Add survey data or feedback sources
- Optionally map CX metrics like:
NPS
CSAT
CES
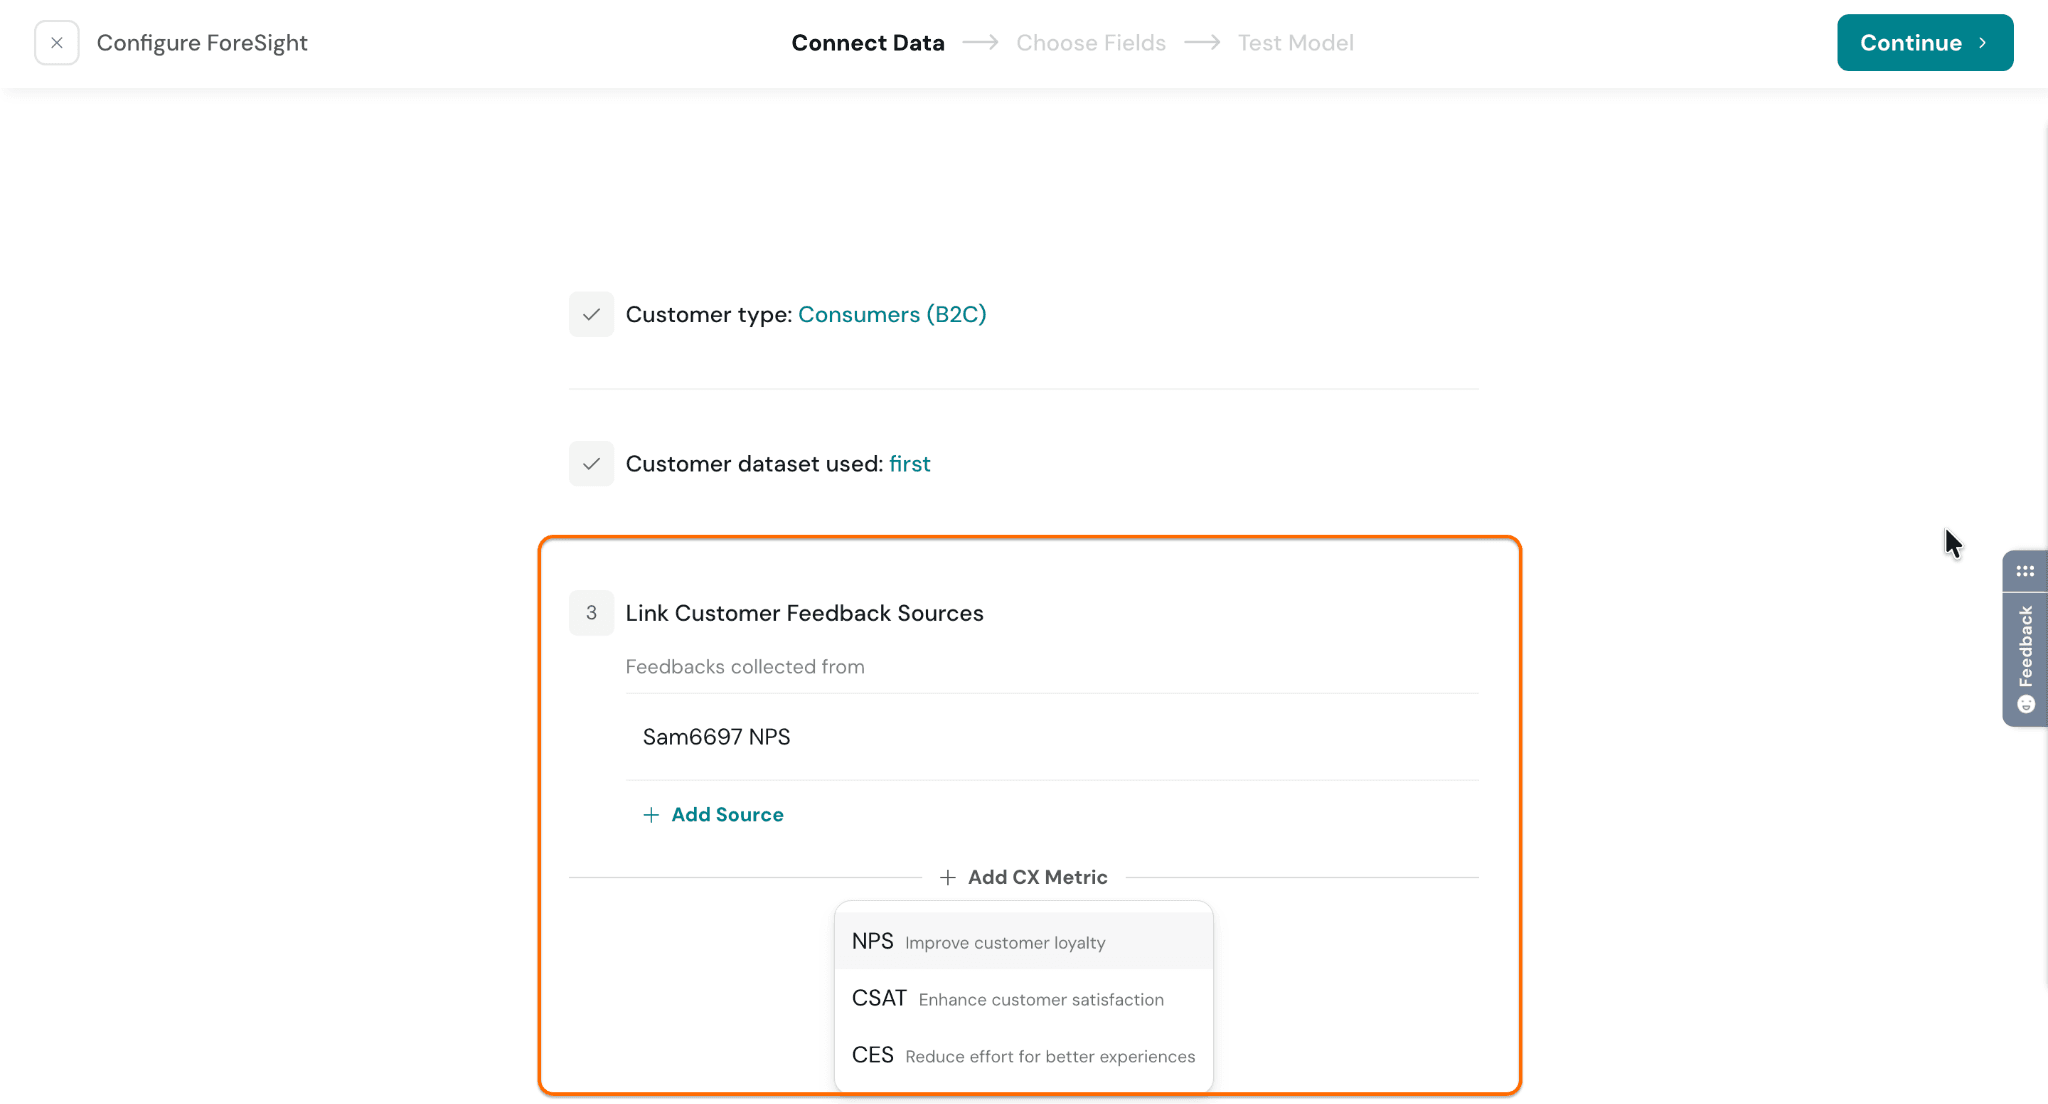
- Add a source, select the CX metric question, and click Continue
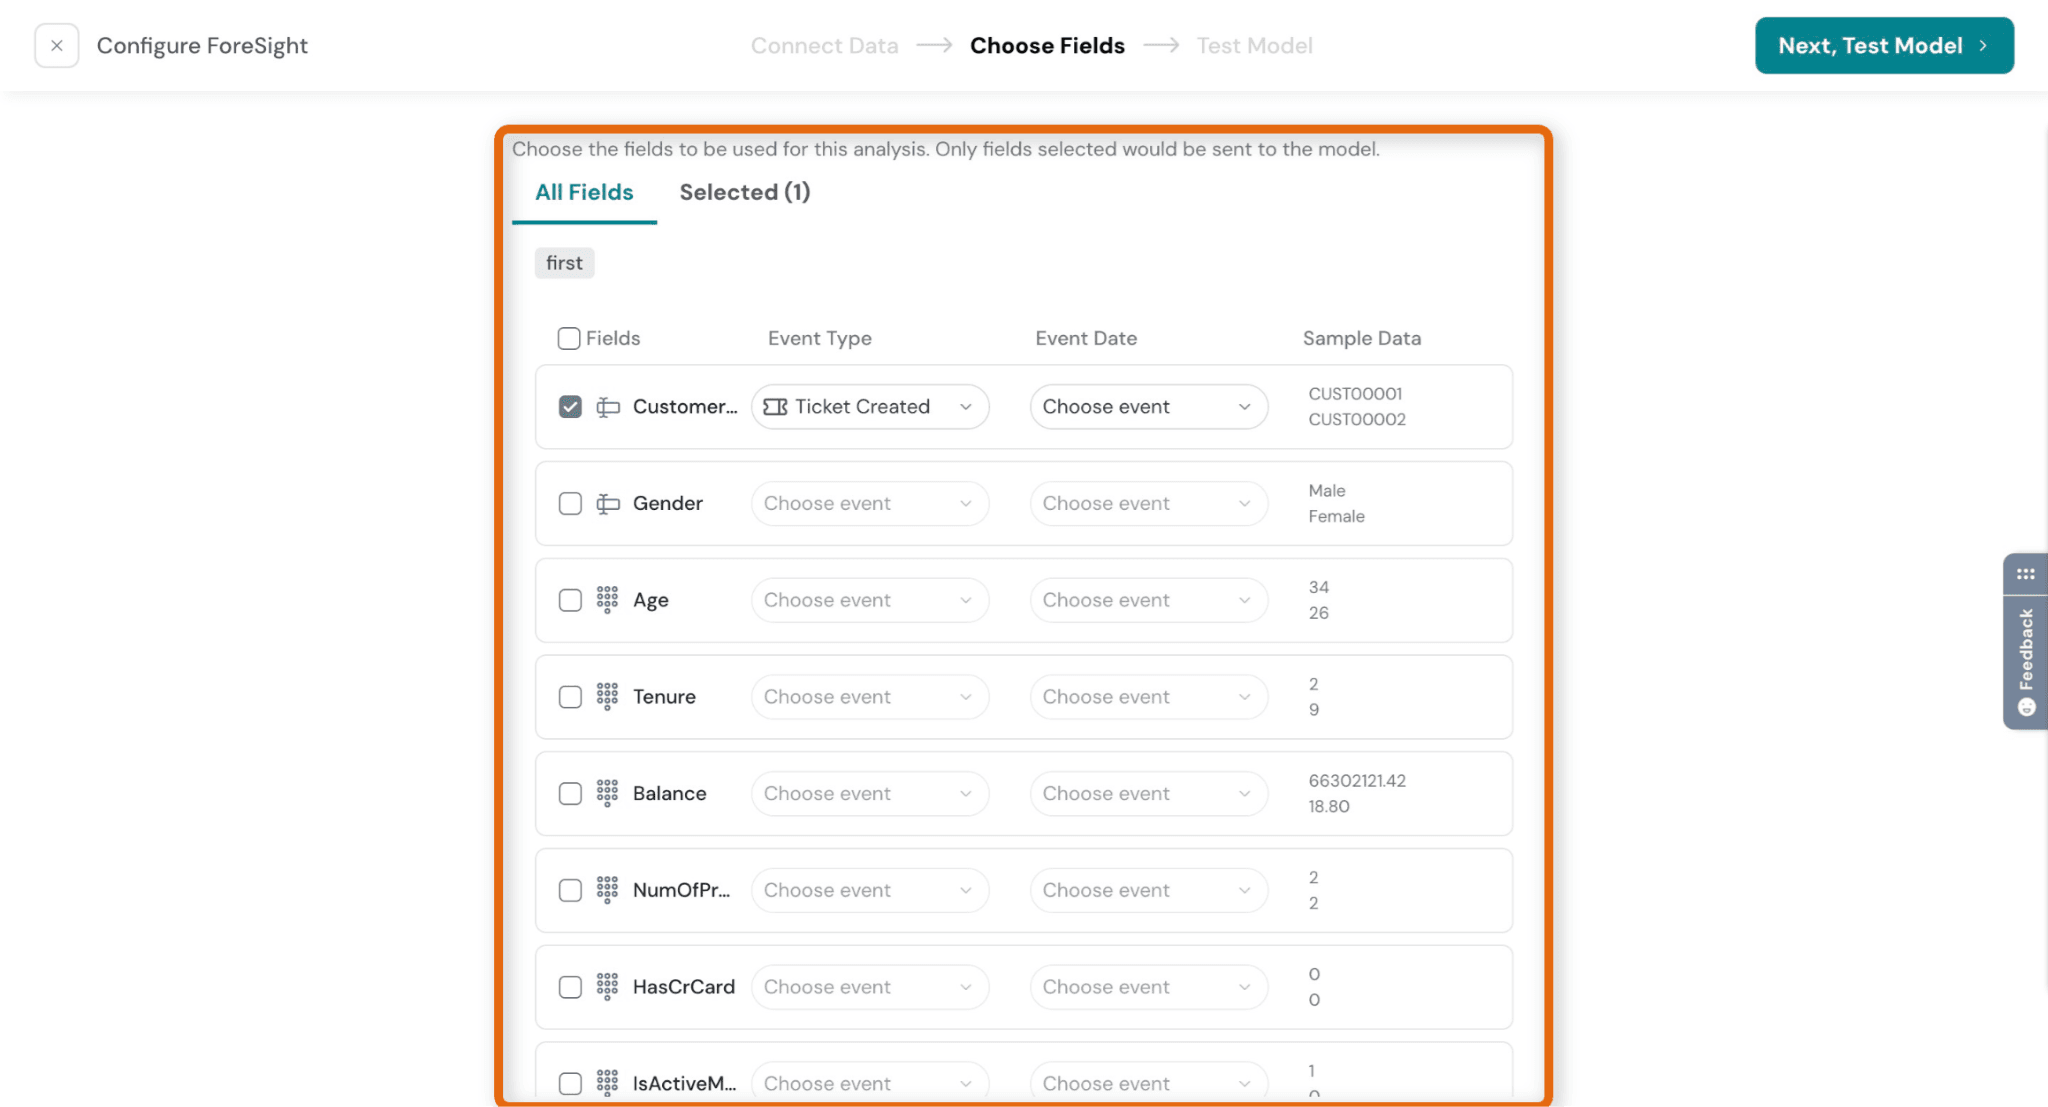
Step 7: Choose fields for prediction
- Select which fields should be used by the model
- Only selected fields will be used for analysis
- Map each field to an Event Type (e.g., Ticket Created, Purchase, Login)
- Select an Event Date to indicate when the activity occurred
- If no event date is available, Foresight will use the data upload time as the event date
- Select Next, Test Model
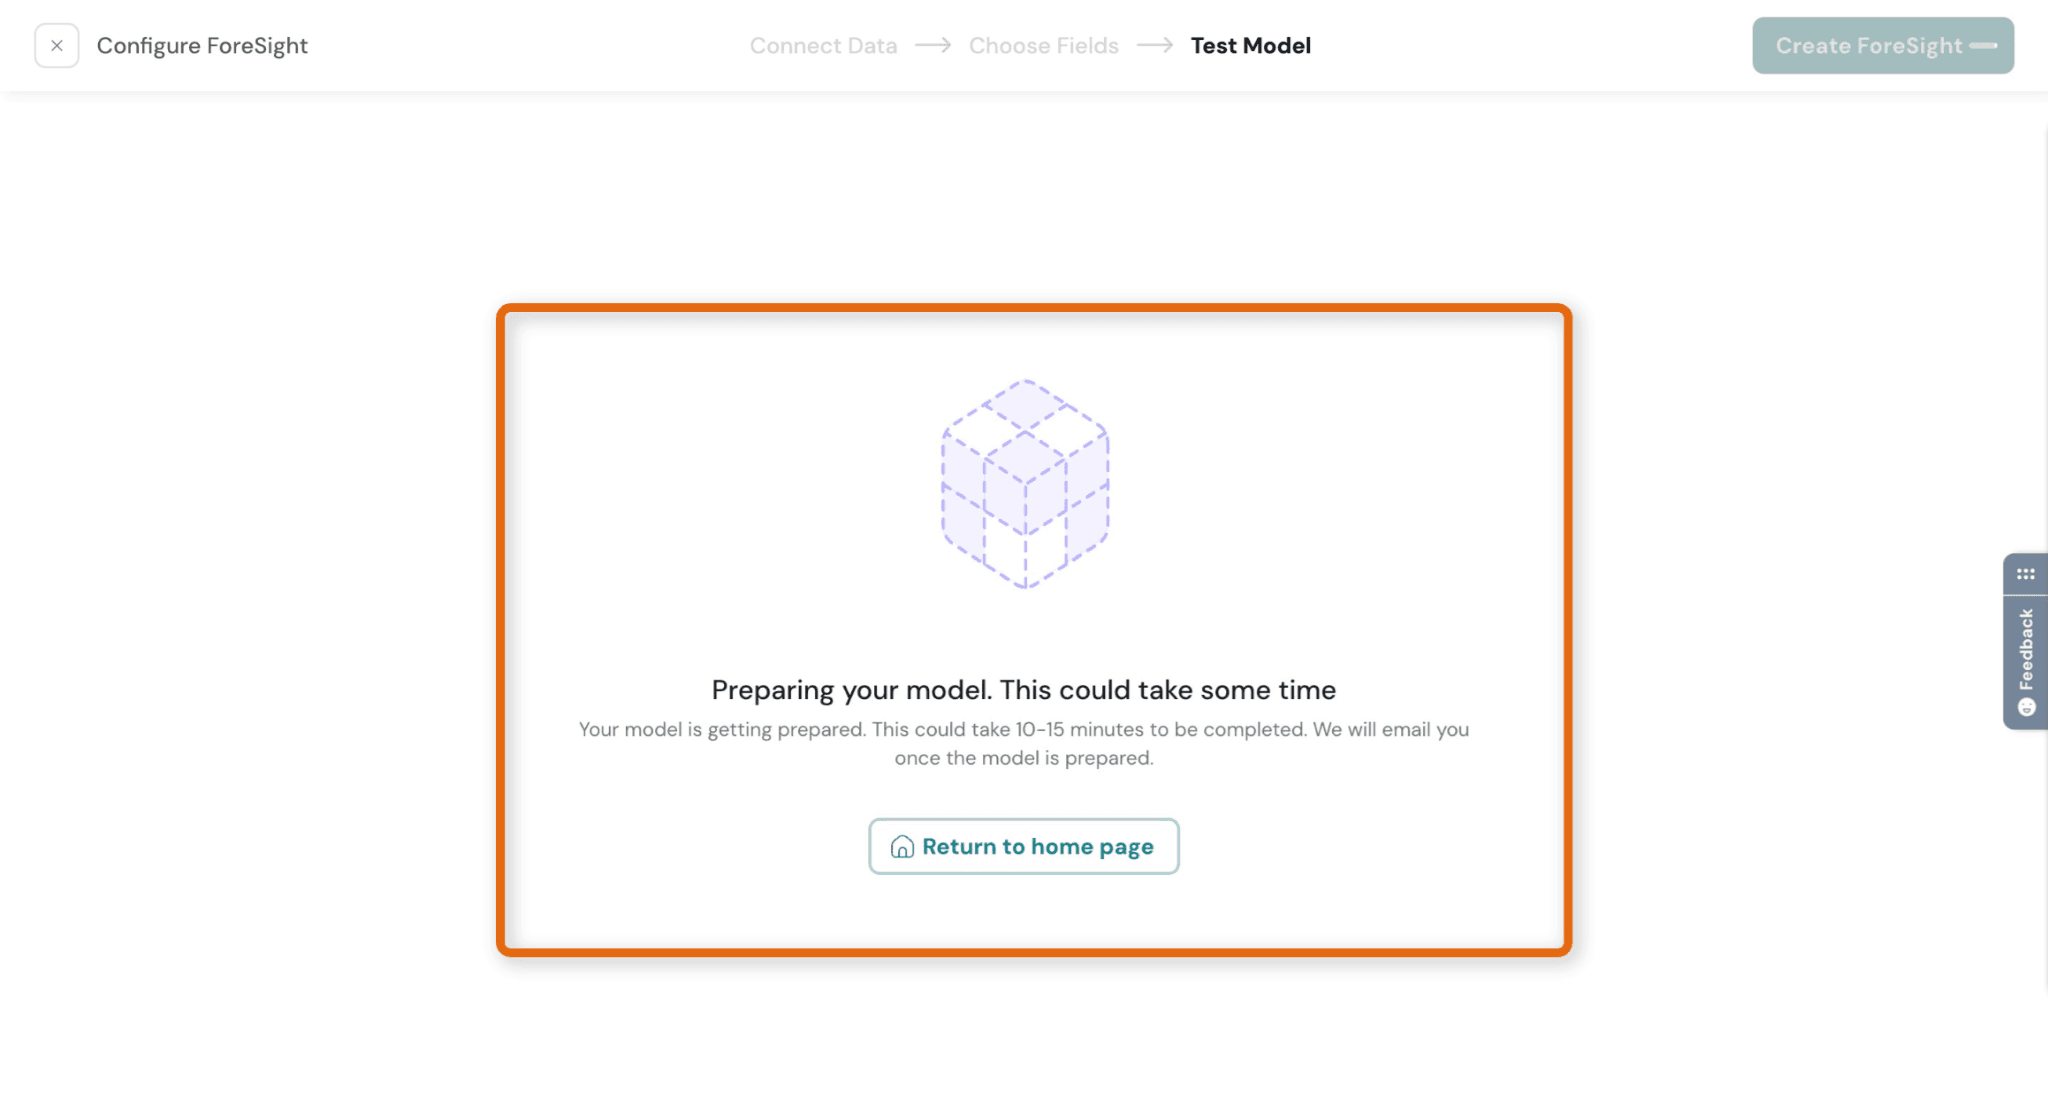
Step 8: Once you click Test Model, Foresight begins preparing your model.
- This can take a few minutes (or up to ~10–15 mins)
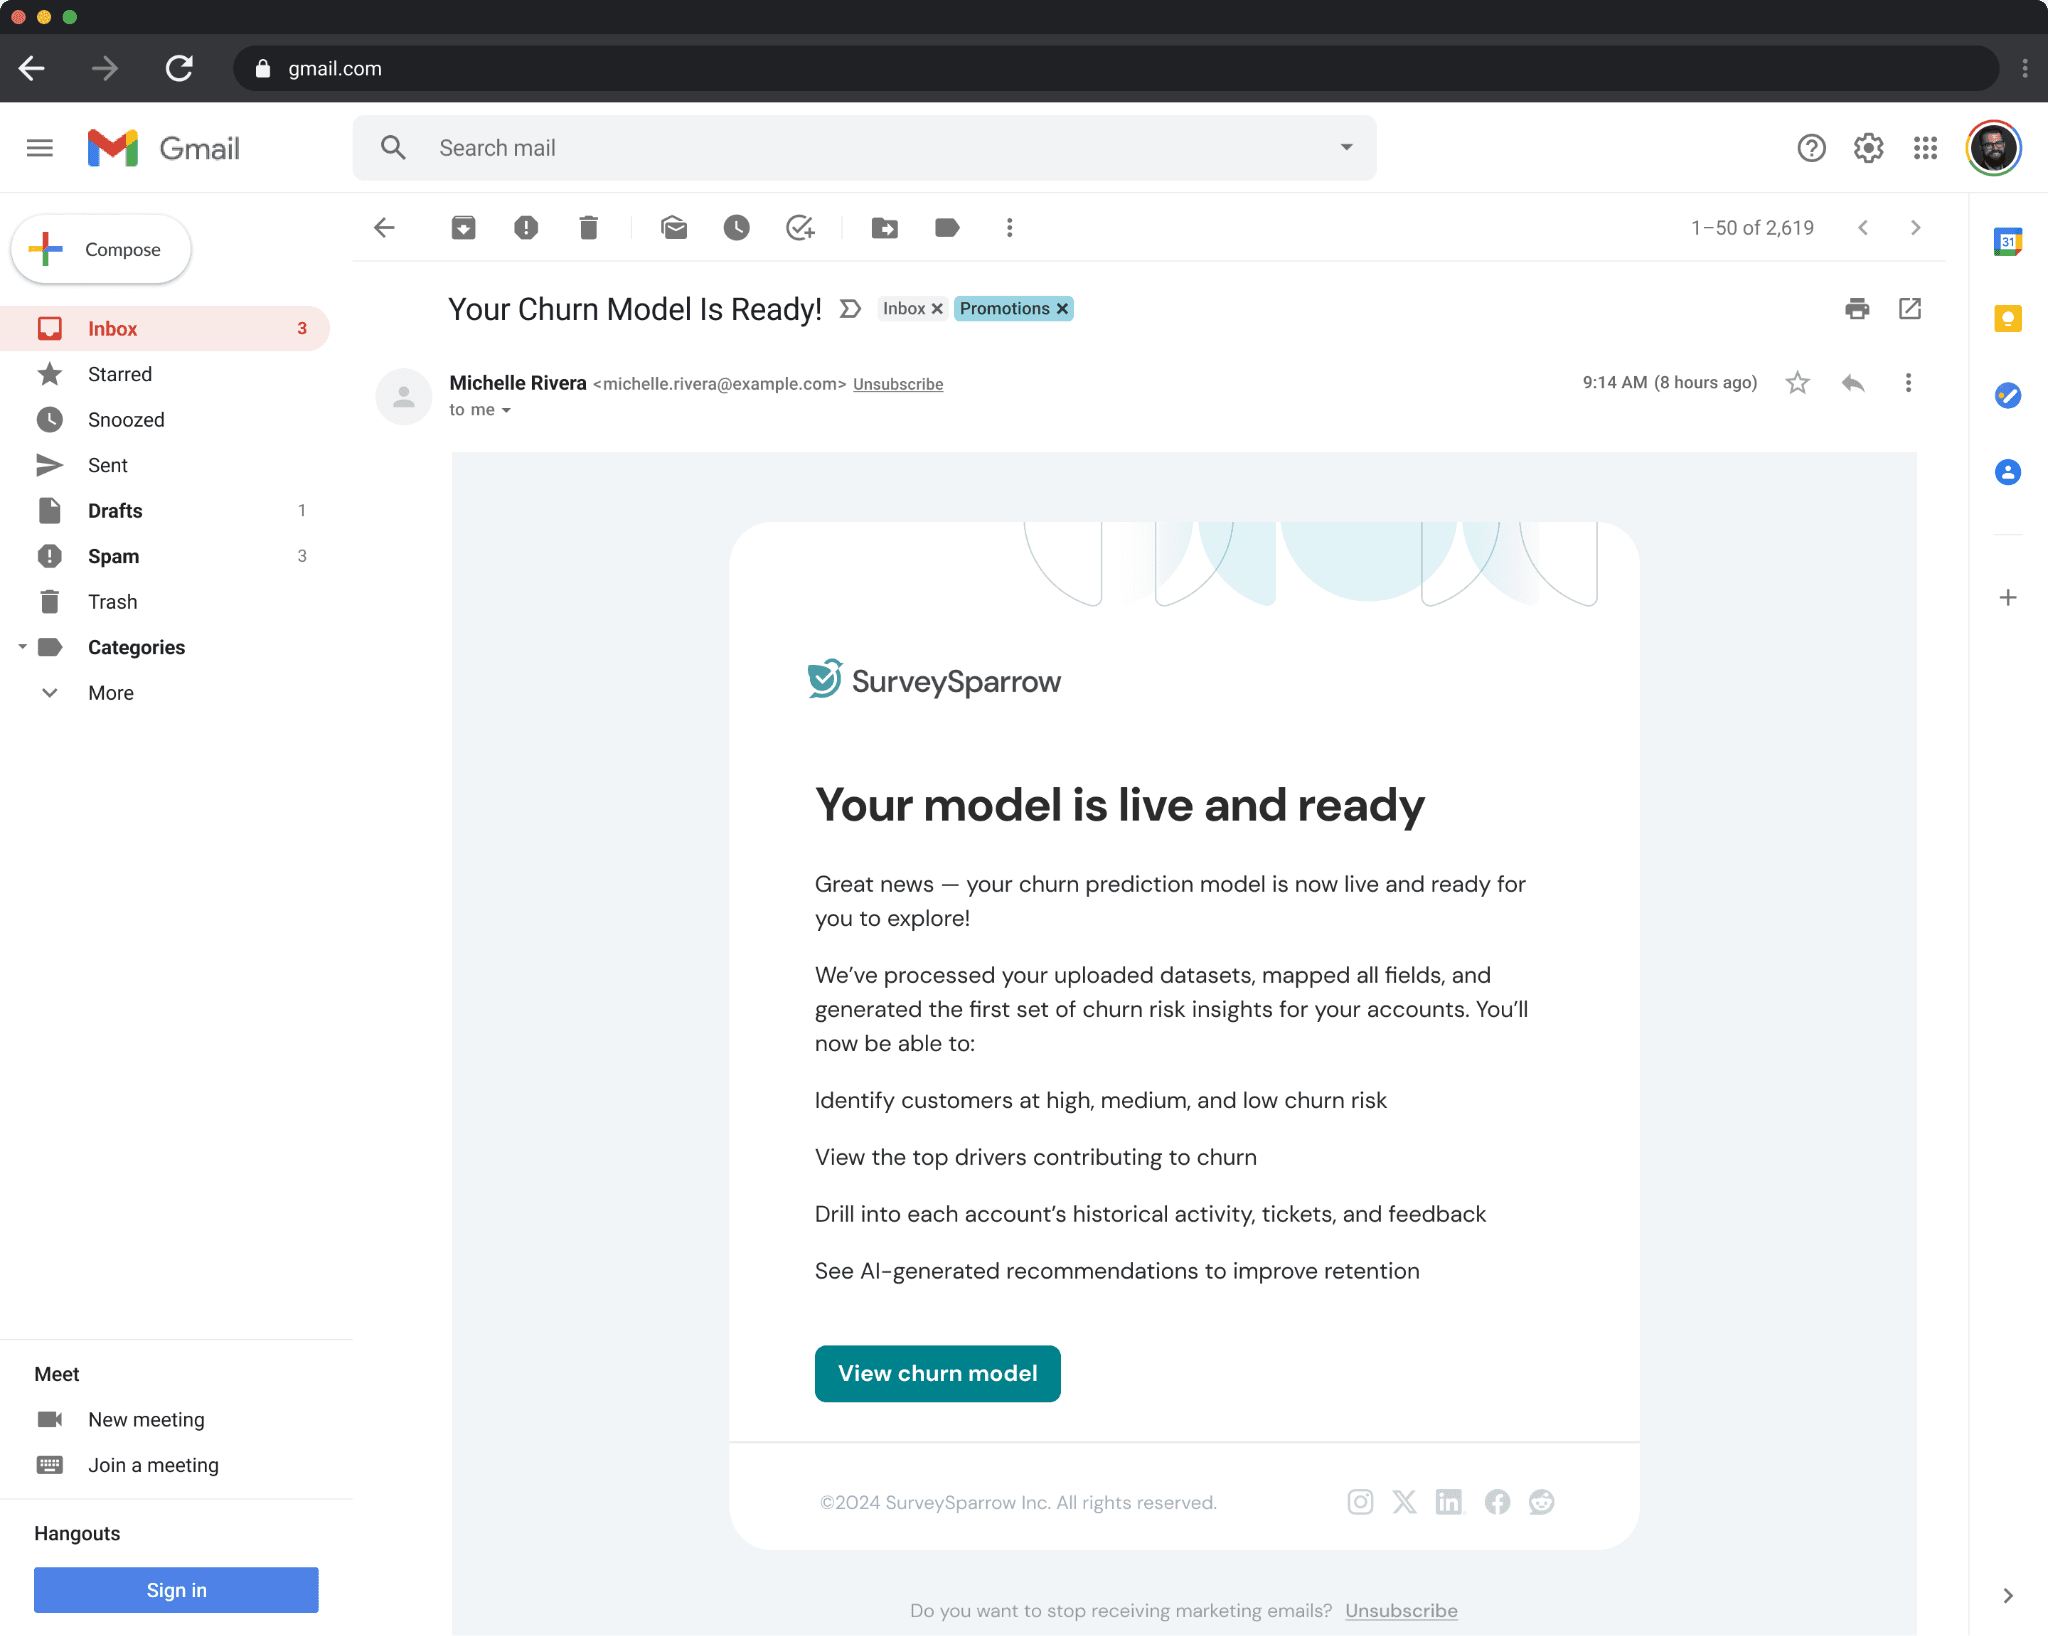
- You’ll receive an email notification once your model is ready.
👉 This step ensures your model is ready before going live.
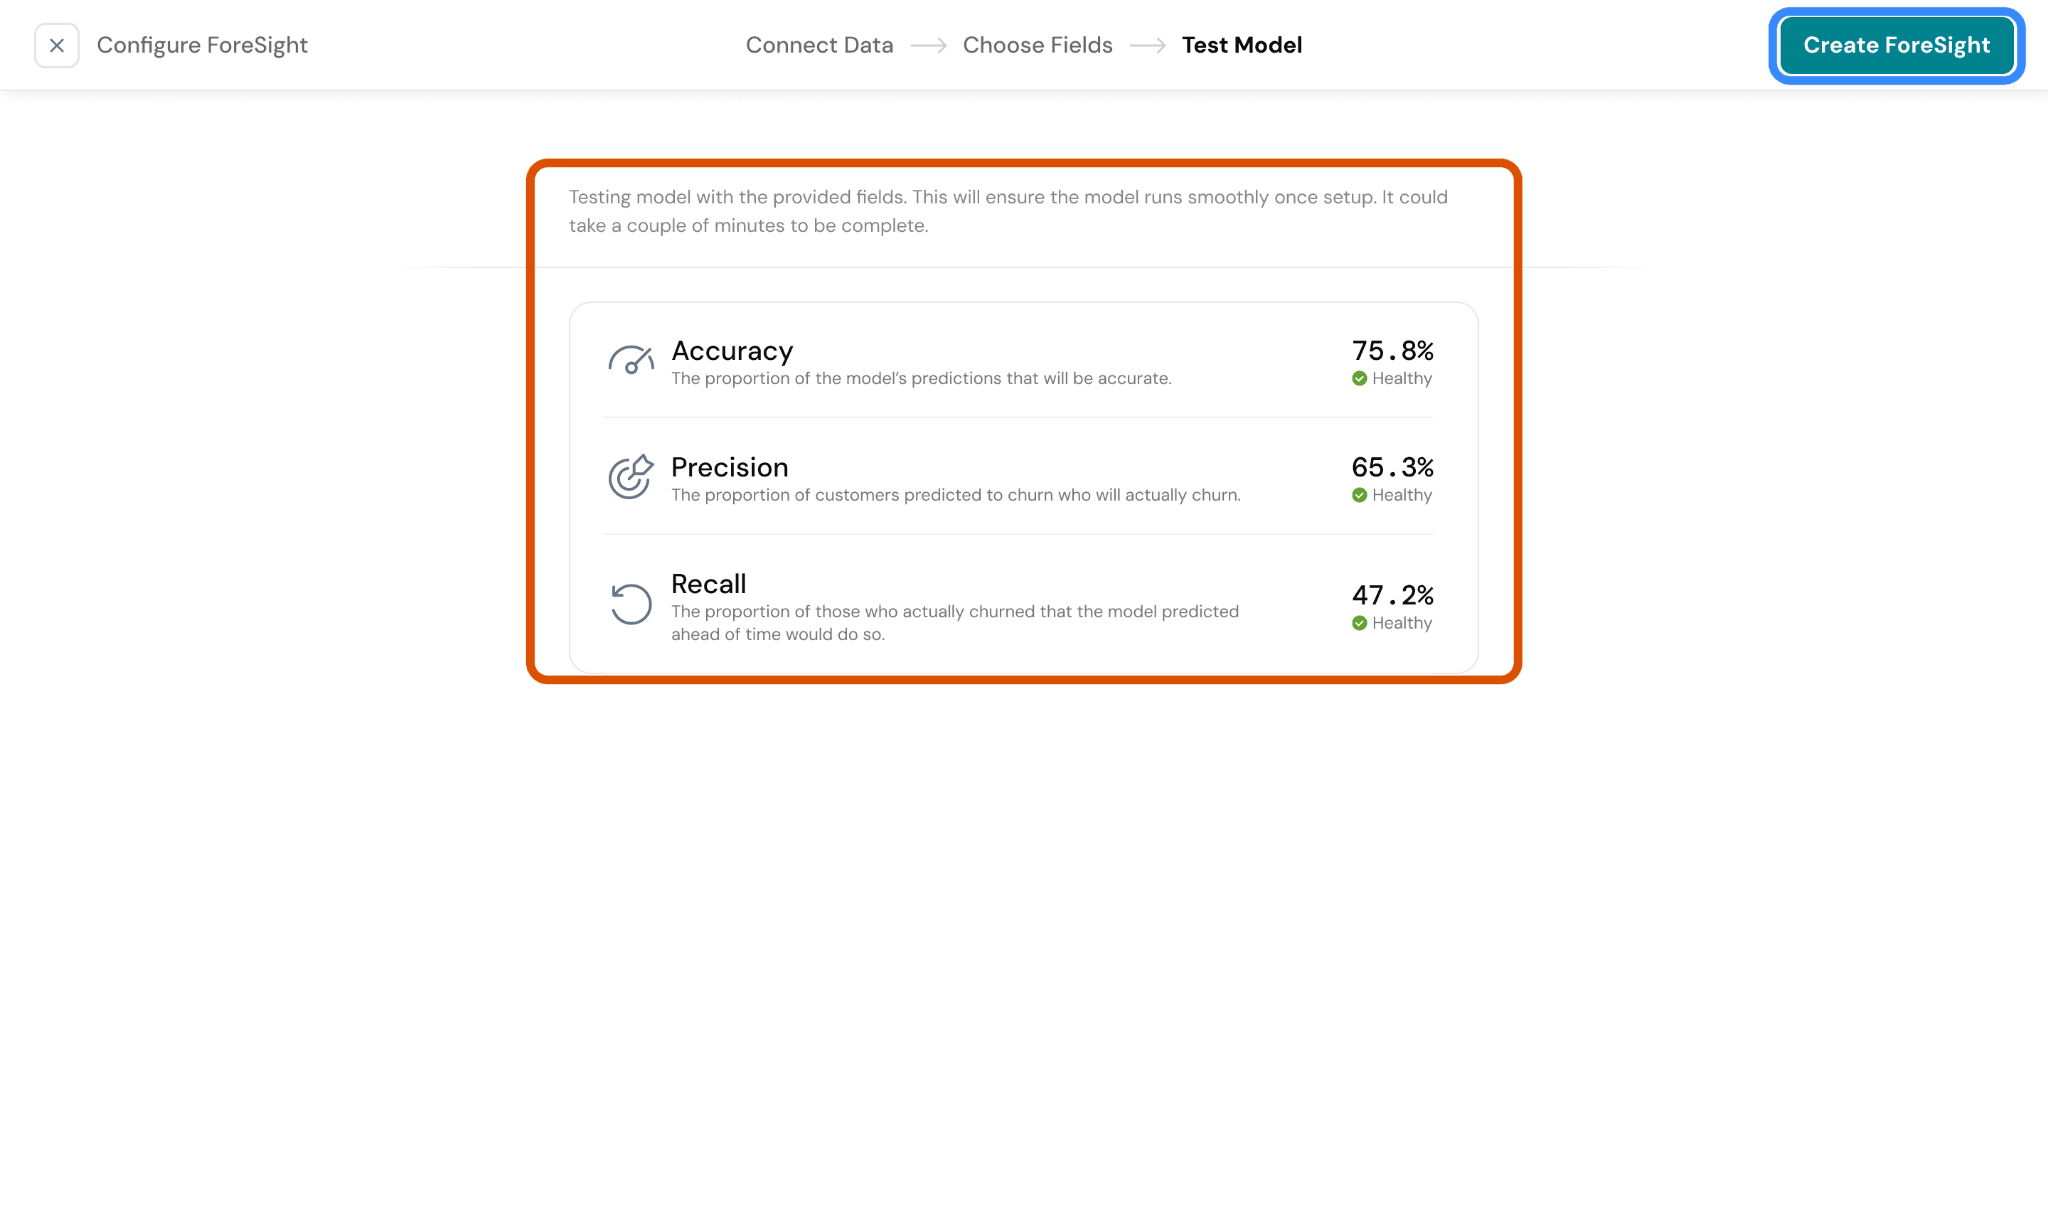
Step 9: Once testing is complete, you’ll see performance metrics:
- Accuracy → The proportion of predictions that are correct
- Precision → Of the customers predicted to churn, how many actually churn
- Recall → Of all customers who churned, how many were correctly identified
- Threshold → Sensitivity level for classifying churn risk
👉 If key metrics are low, consider:
- Improving dataset quality
- Selecting better fields
- Adjusting the target definition
- Select Create Foresight to finalize setup
Step 10: Your model now generates insights across multiple sections in the dashboard:
Revenue at Risk - Estimated revenue impacted by at-risk customers
Contacts at Risk - Total number of high-risk customers
High Risk Trend - Track how risk evolves over time
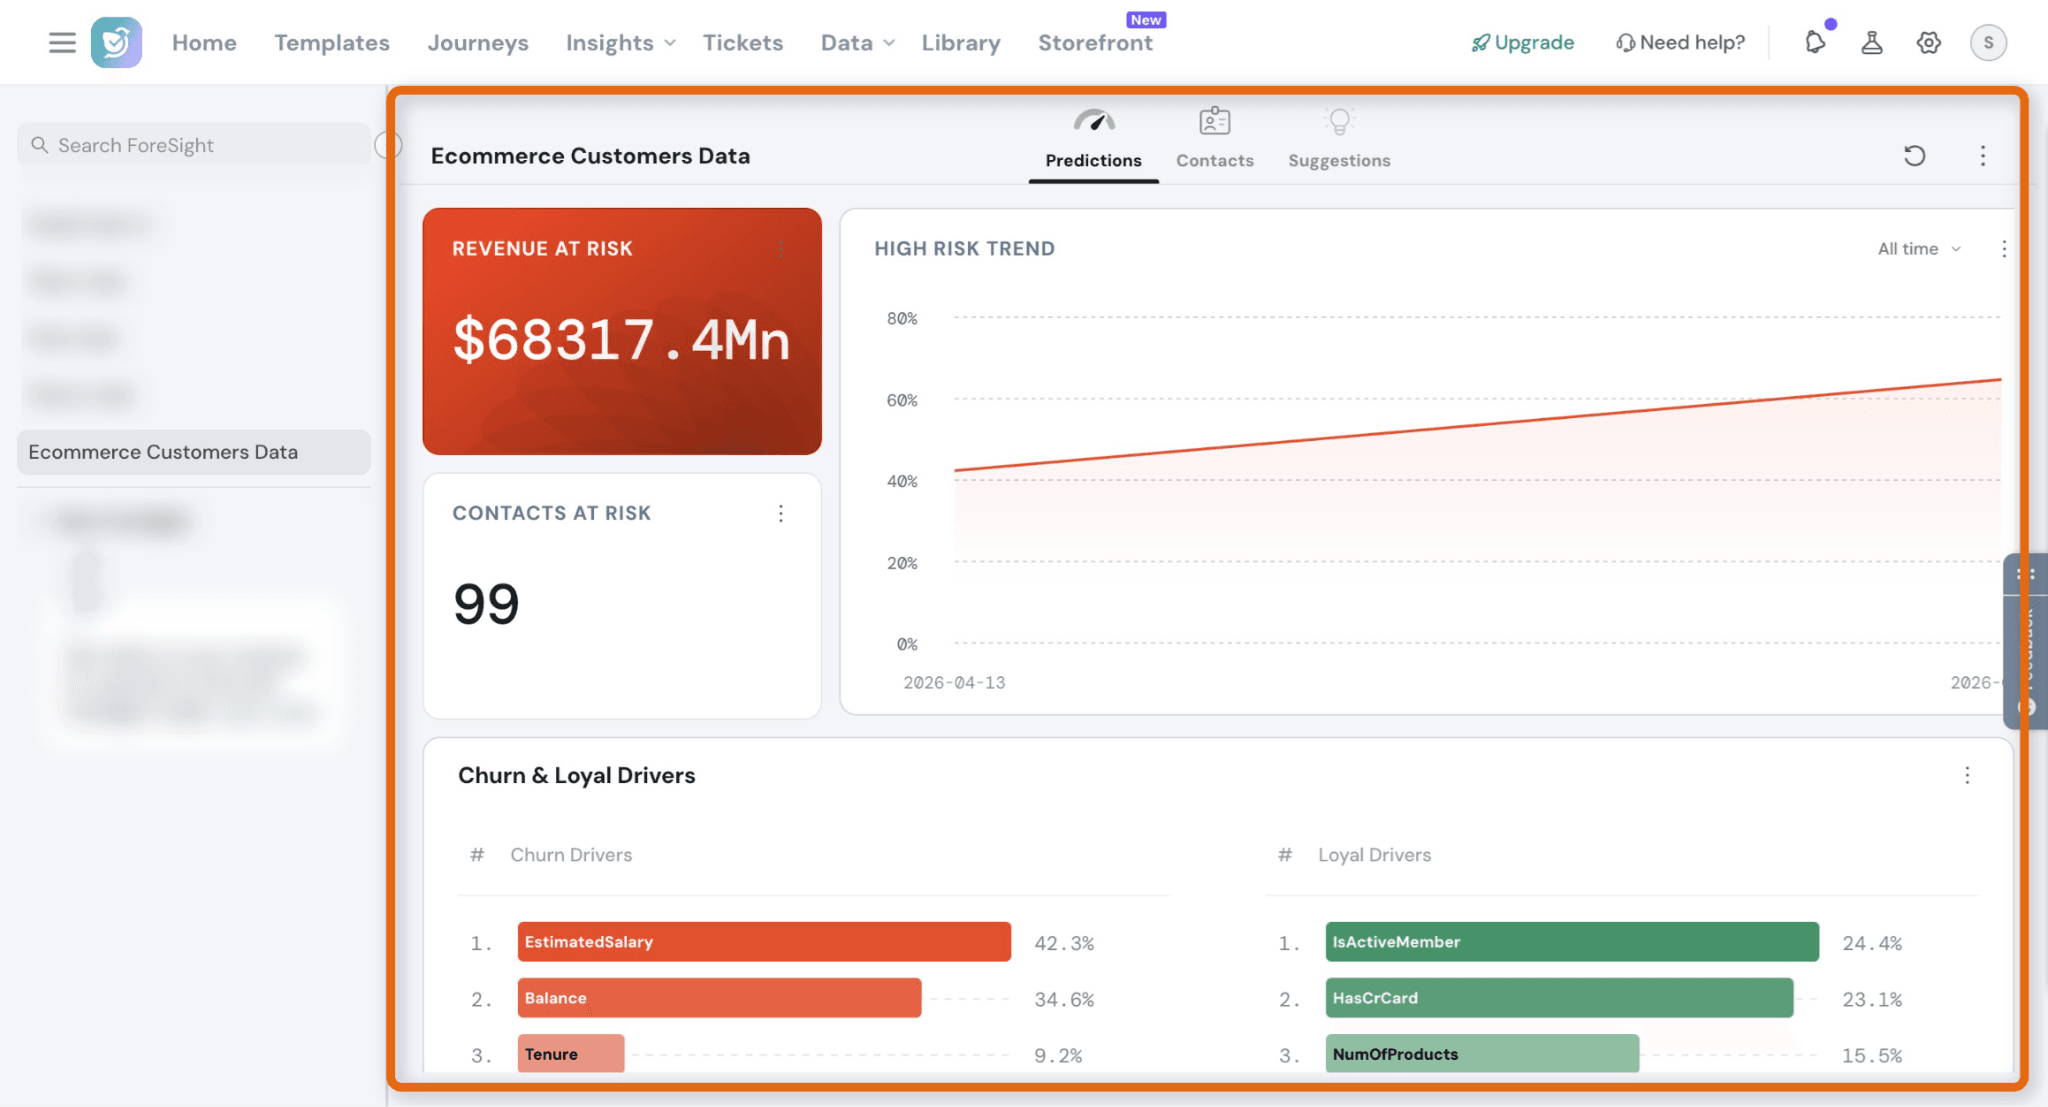
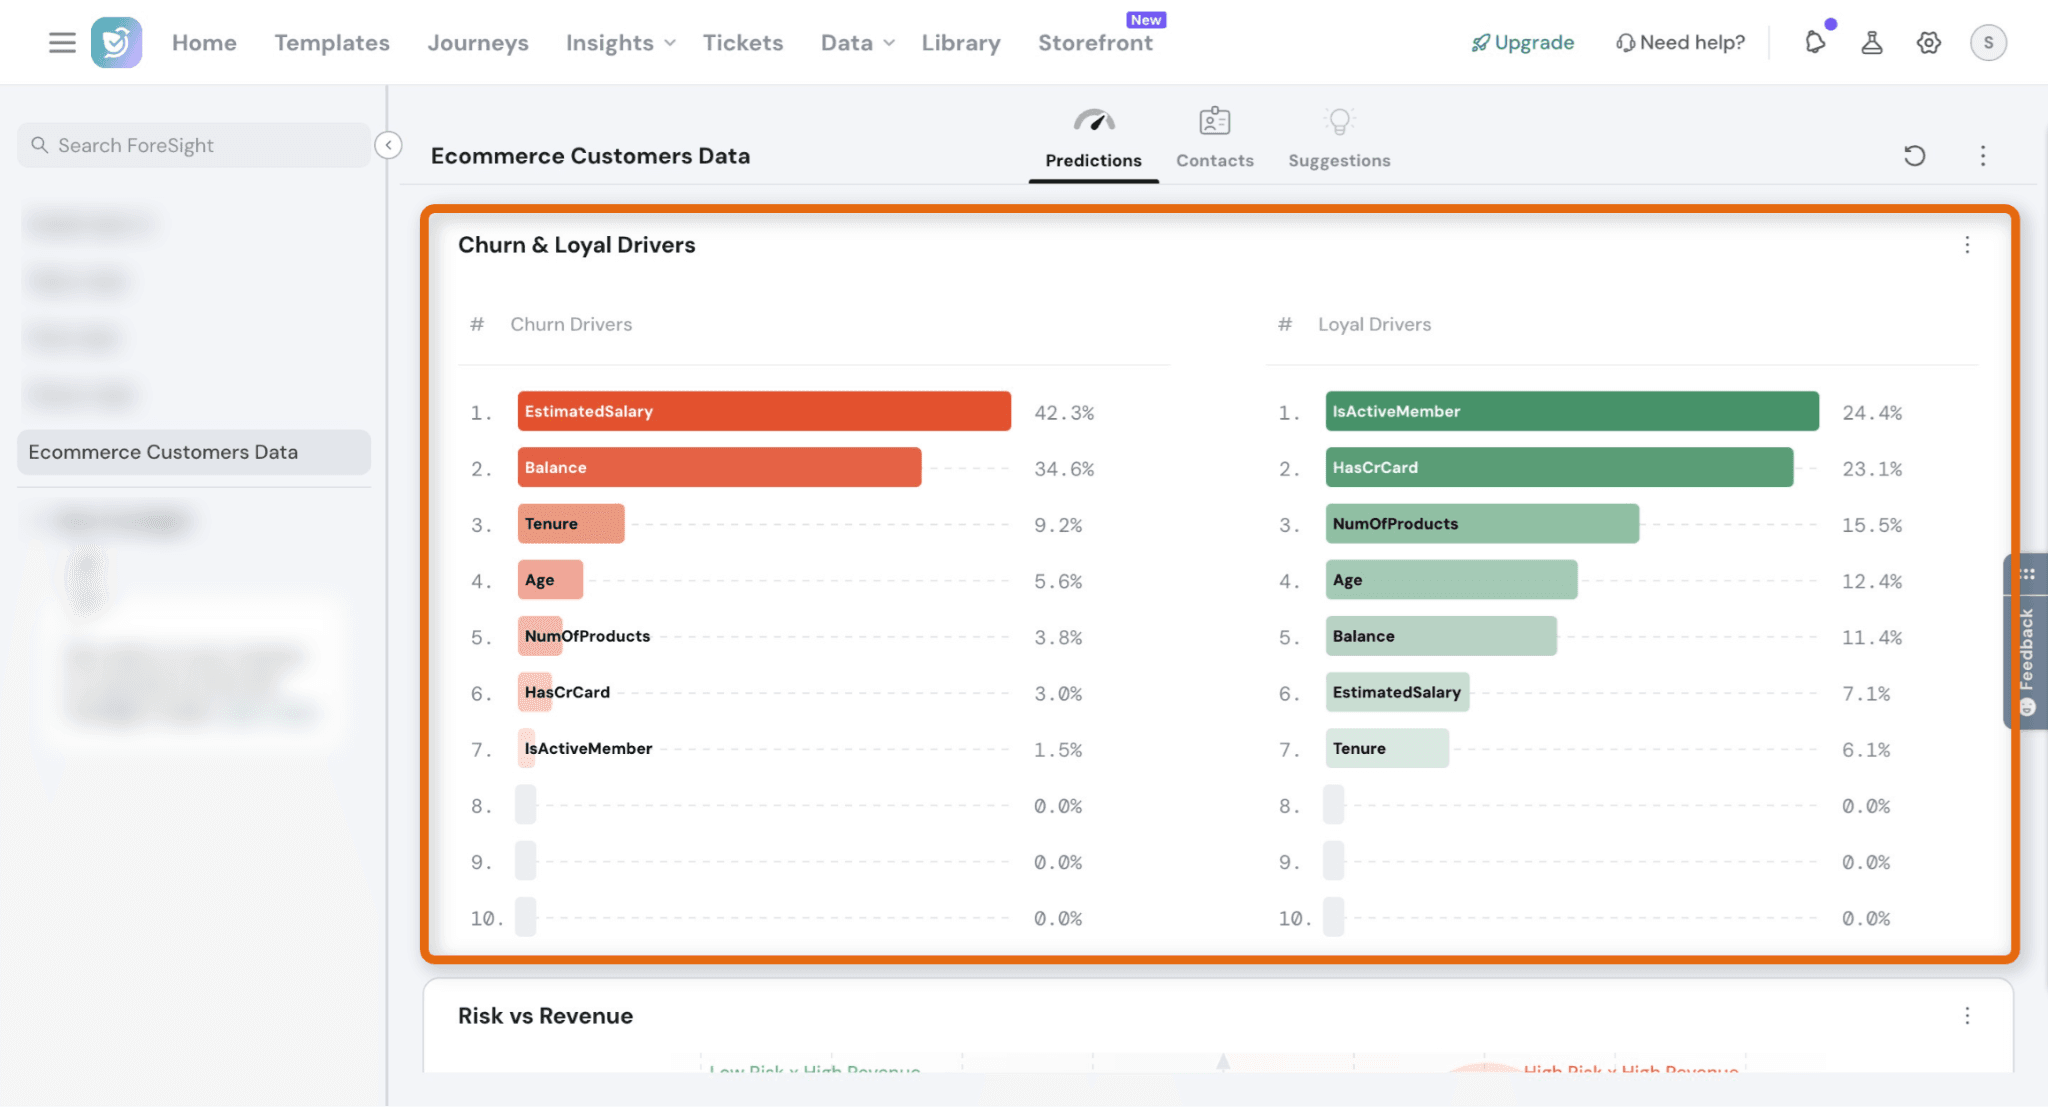
Step 11: See what influences customer behavior:
Churn Drivers - Factors increasing churn risk (e.g., low engagement, declining usage)
Loyal Drivers - Factors improving retention (e.g., active usage, product adoption)
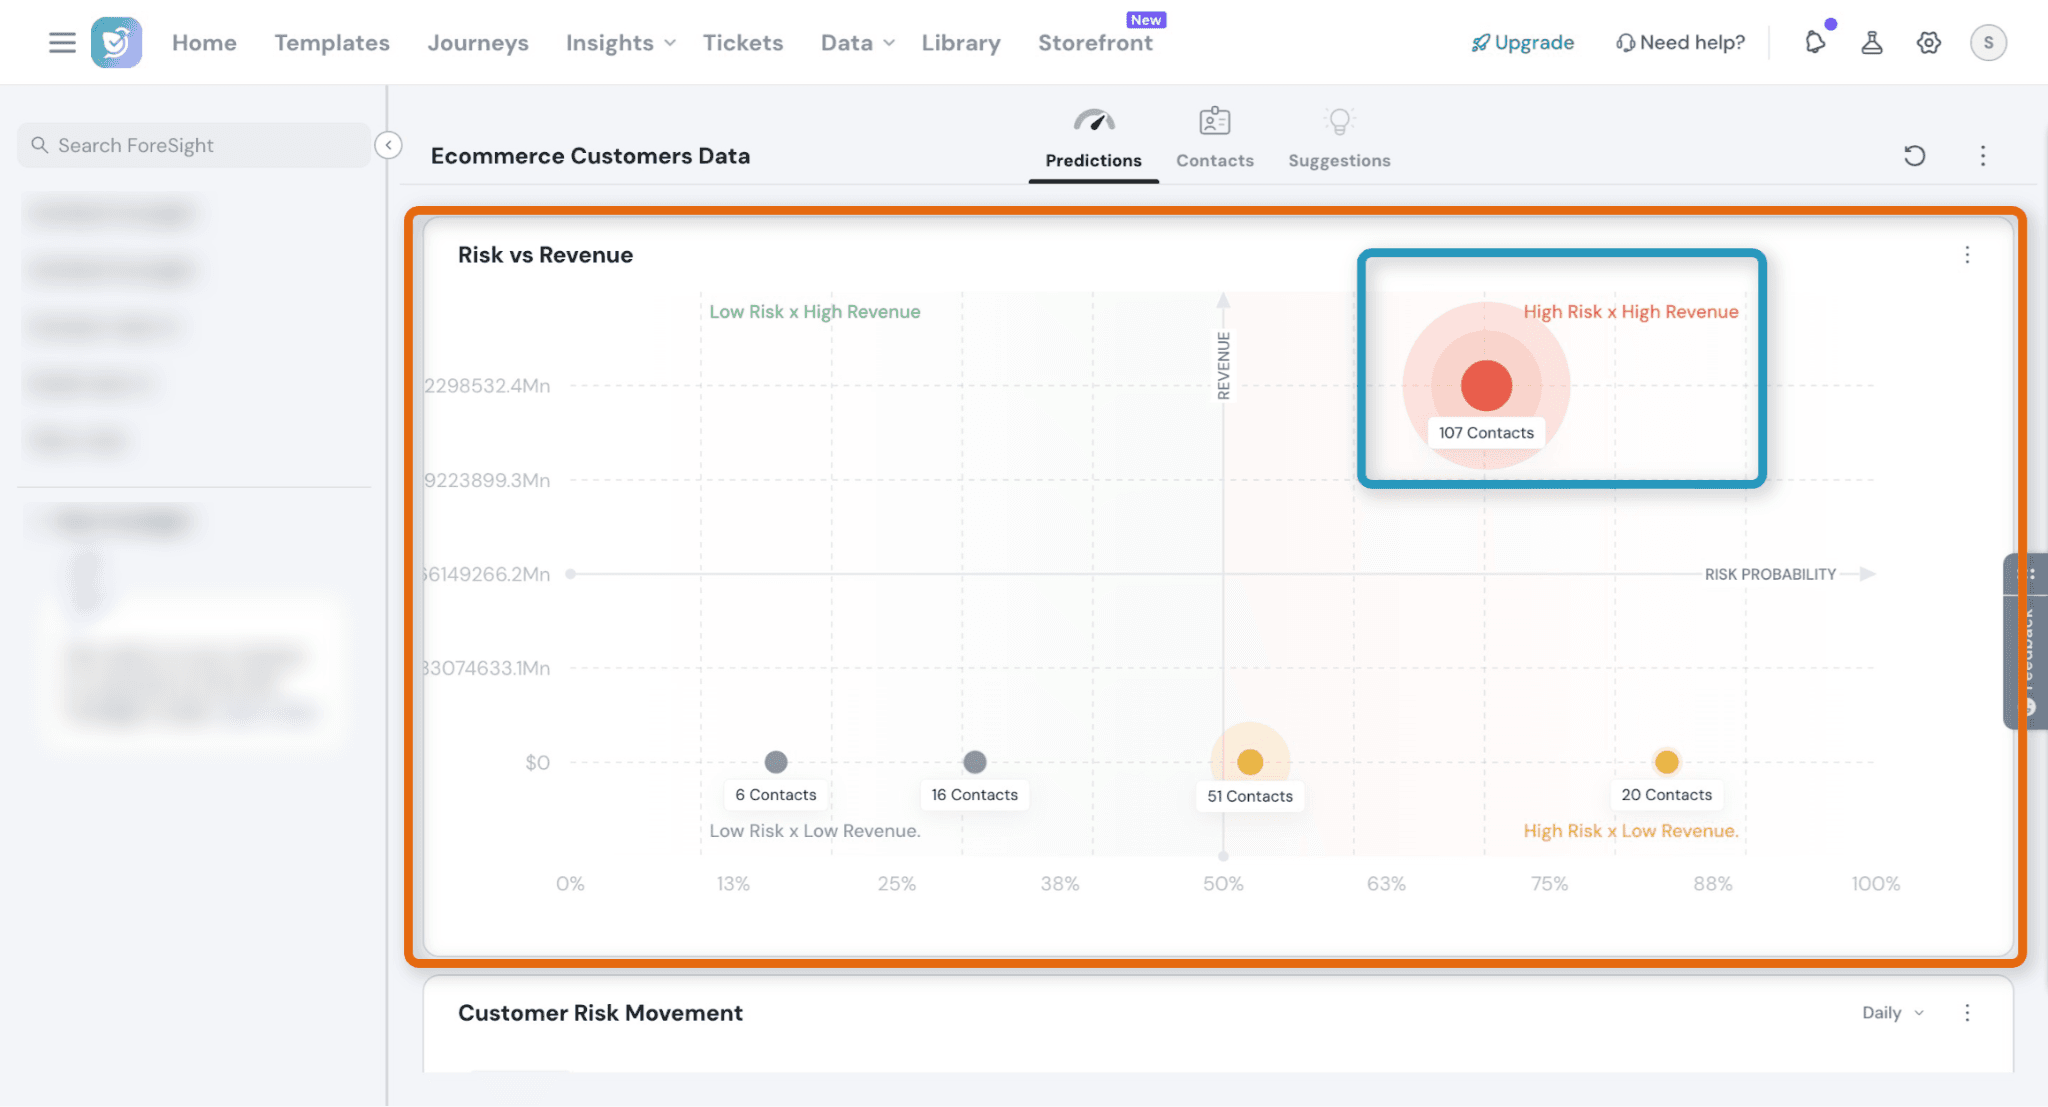
Step 12: This view helps you prioritize:
- High Risk + High Revenue → Act immediately
- High Risk + Low Revenue → Monitor
- Low Risk + High Revenue → Retain & upsell
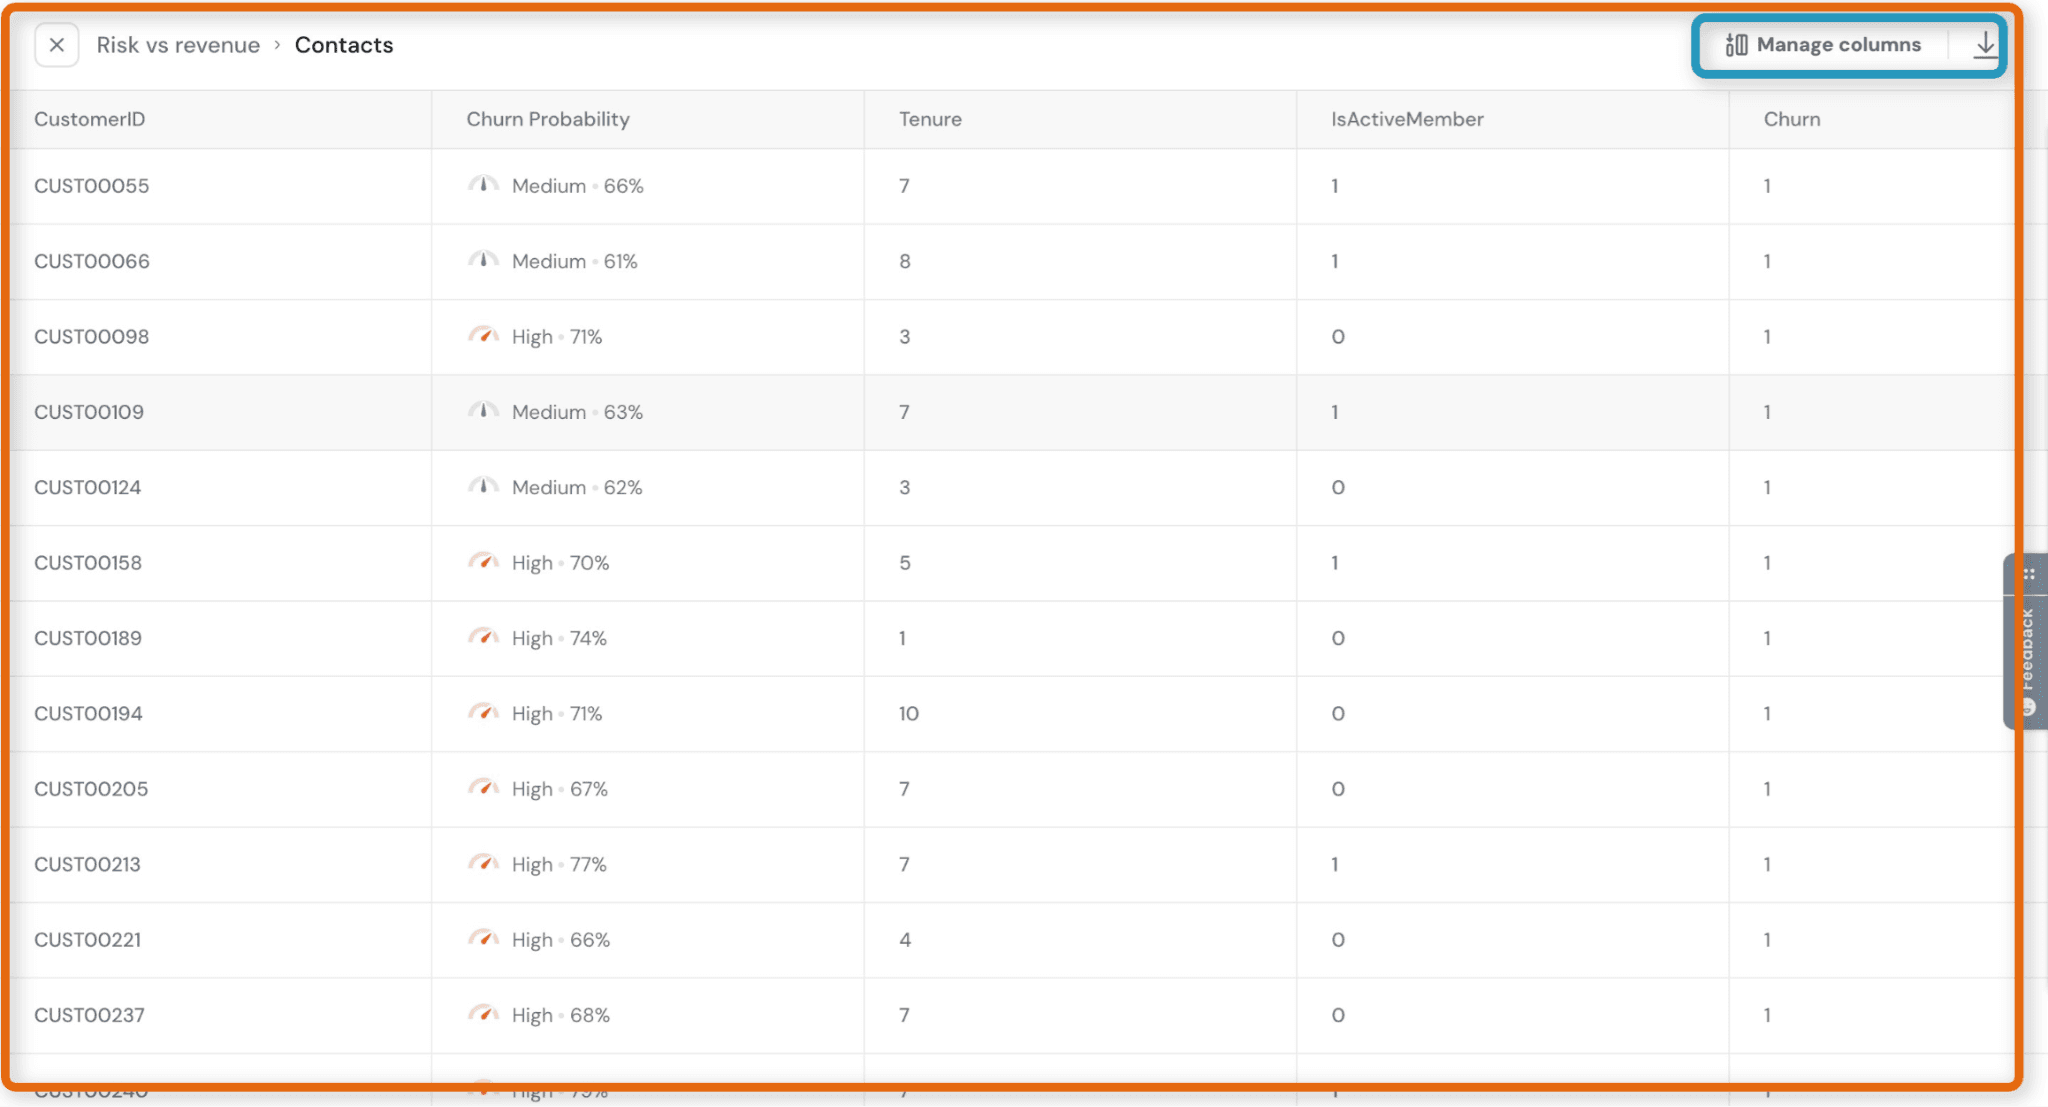
👉 Click any segment to drill down into customers
- Churn probability (Low / Medium / High)
- Customer attributes (tenure, activity, etc.)
- Customizable columns
👉 Use this to:
- Identify at-risk accounts
- Trigger outreach or workflows
- You can manage columns
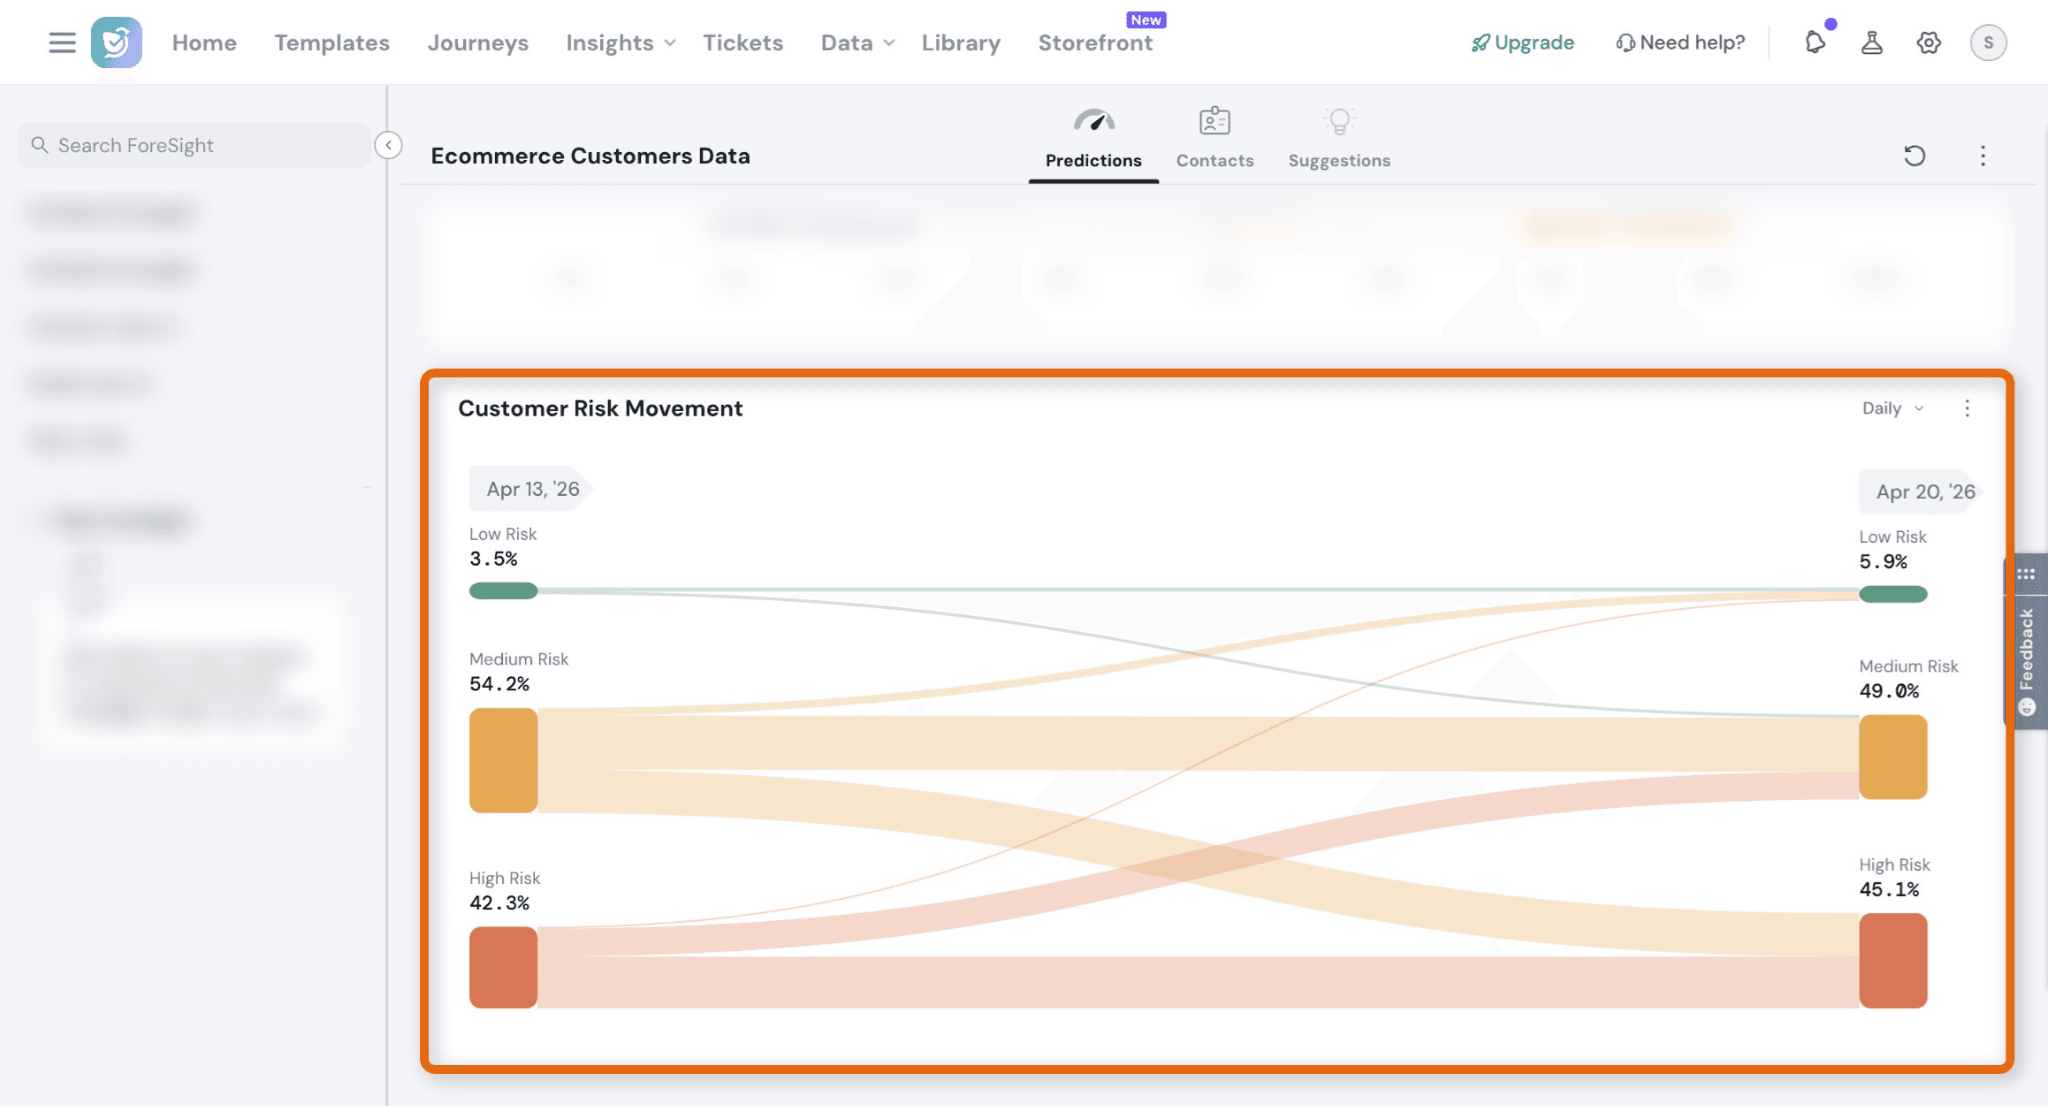
Step 13: Understand how customers shift over time:
Low → Medium → High risk
Improvements or deterioration
👉 Helps measure:
- Impact of your actions
- Changes in customer behavior
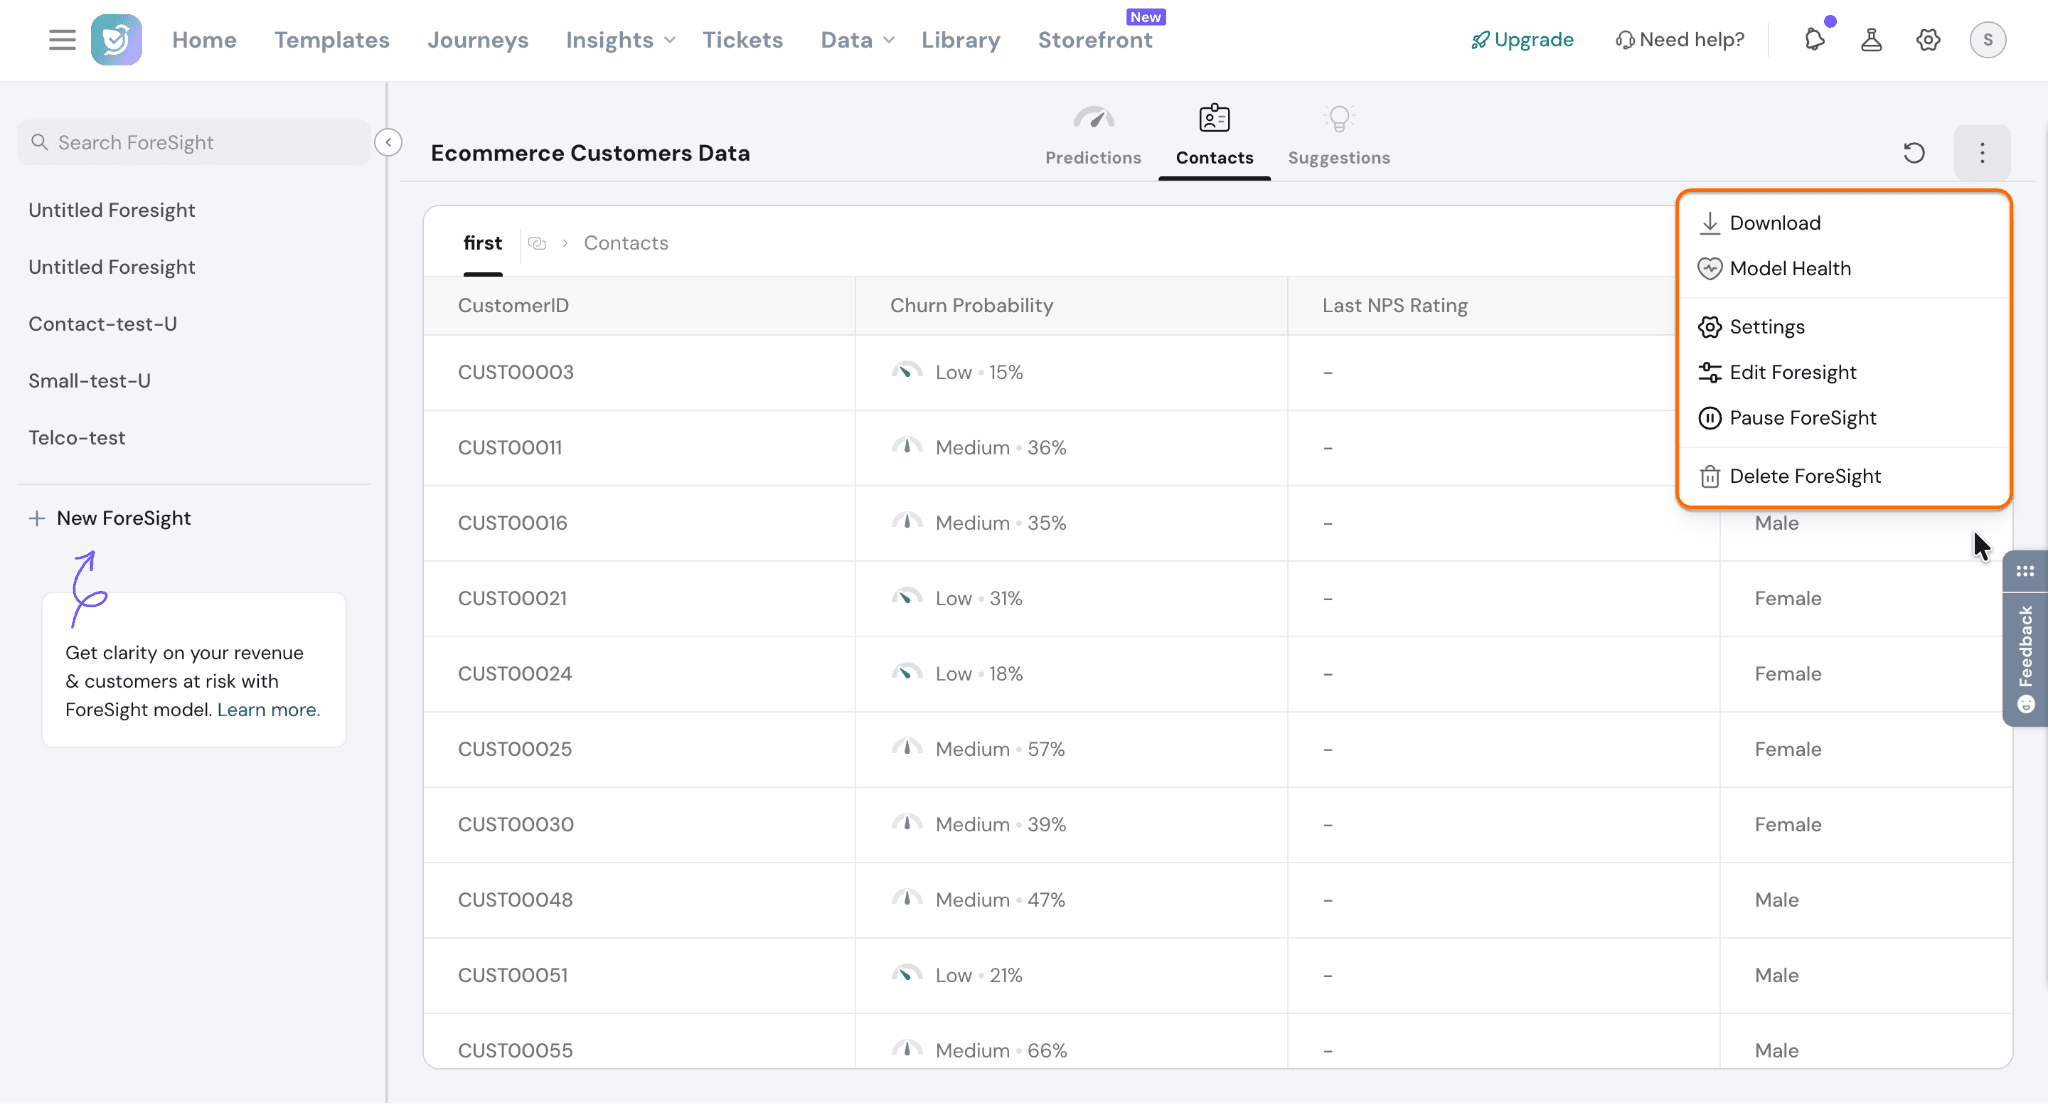
Step 14: Manage your Foresight model from the menu:
- Download → Export data
- Model Health → Check performance
- Settings → Configure model
- Edit Foresight → Update setup
- Pause Foresight → Stop predictions
- Delete Foresight → Remove model
Step 15: Switch to the Contacts tab to view individual customer predictions.
- Identify high-risk customers instantly
- Prioritize outreach and retention actions
- Analyze customer-level patterns
👉 This is where insights turn into actionable customer lists

That’s it — you’re live with Foresight
What to do next?
Foresight helps you identify customers at risk—but the real impact comes from acting on it.
Here’s how to get the most value:
- Prioritize high-risk, high-revenue customers
- Focus on accounts that impact your revenue the most - Trigger follow-ups or workflows
- Reach out with surveys, support, or personalized communication - Use drivers to fix root causes
- Improve product, onboarding, or experience based on churn drivers - Track changes over time
- Monitor how customer risk evolves after taking action
Pro tip:
Don’t treat this prediction as a report.
Treat it as a daily decision-making tool:
- Who needs attention today?
- Where is revenue at risk?
- What should we fix first?
FAQs:
1. How accurate are Foresight predictions?
Foresight provides model performance metrics like Accuracy, Precision, and Recall after testing. These help you evaluate how reliable your predictions are. Accuracy improves with better data quality and relevant fields.
2. What kind of data should I upload?
You should upload structured customer data that includes:
- Customer attributes (e.g., tenure, usage, demographics)
- A clear churn indicator field
- (Optional) Revenue data to calculate revenue at risk
3. Can I use Foresight for both B2B and B2C?
Yes.
- In B2C, predictions are at the individual customer level
- In B2B, predictions are at the account level using linked contacts
4. What does “churn probability” mean?
It represents the likelihood of a customer churning based on historical patterns in your data. Customers are grouped into Low, Medium, and High risk for easier prioritization.
5. How often are predictions updated?
Predictions are updated whenever the model is re-run or refreshed with new data. Regular updates help track changes in customer risk over time.
6. What should I do with high-risk customers?
You can:
- Reach out proactively
- Trigger surveys to understand issues
- Assign accounts to your CS or support team
- Launch retention campaigns
7. What happens if my model performance is low?
If metrics like accuracy or recall are low:
- Review your dataset quality
- Ensure the churn field is correctly defined
- Include more relevant behavioral or CX data