
Matrix Grid Question Type
Gather more insights with the enhanced matrix grid question type.
Keep surveys short and engaging while collecting detailed responses. With question types like the matrix grid, rank order, and drag & drop, you can capture more data efficiently without making long surveys.
To get more pertinent information in hand, respondents can:
- Select more than one option from the given choices
- Enter a custom input of their preference
There are four types of Matrix Types.
- Radio Button
- Checkbox
- Text
- Dropdown
Let's look at an example of each of these matrix types.
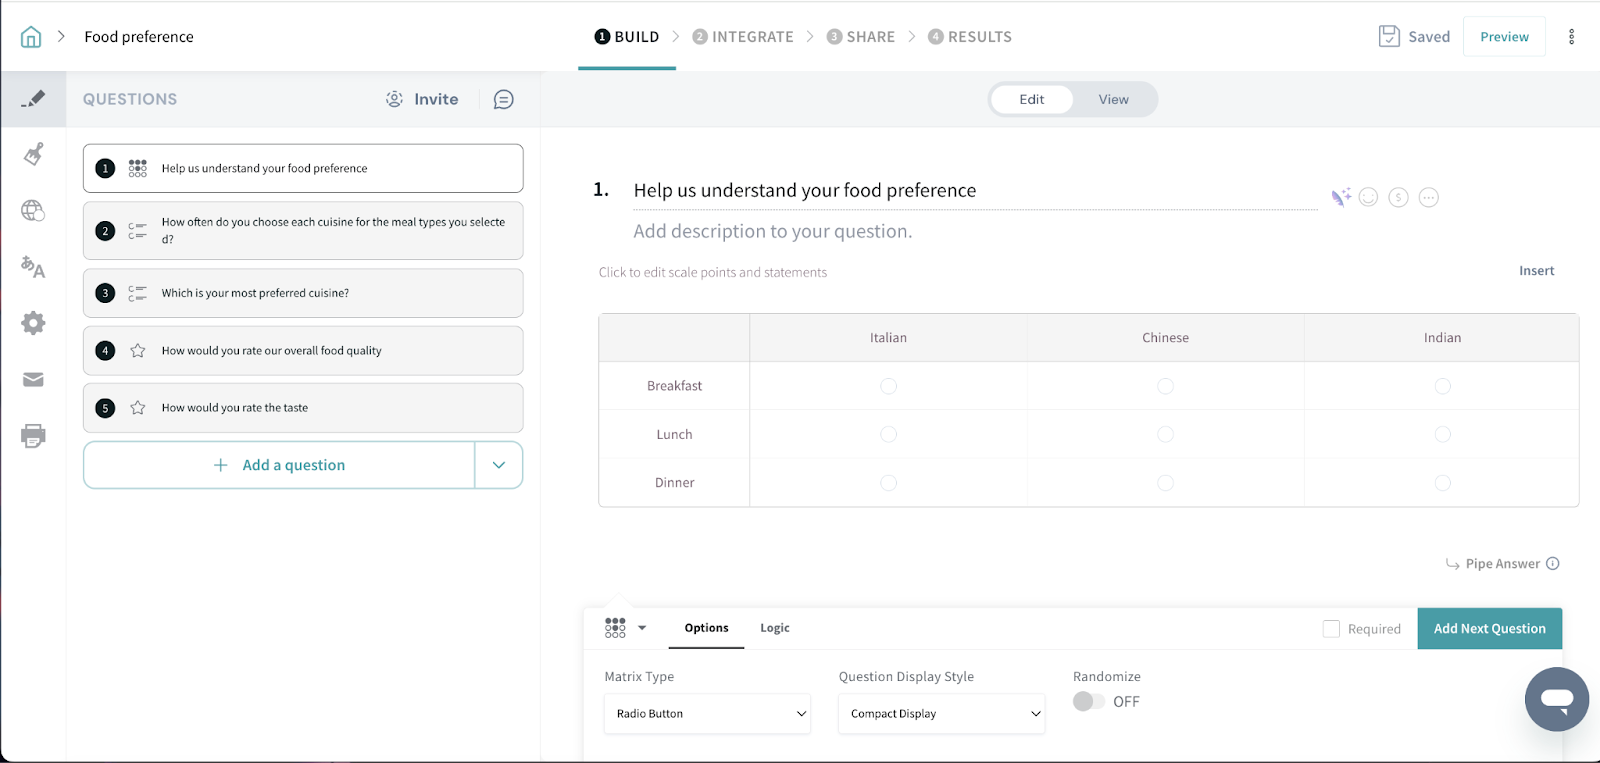
By default, the system creates a radio button matrix question type. You can change the Matrix Type from here:
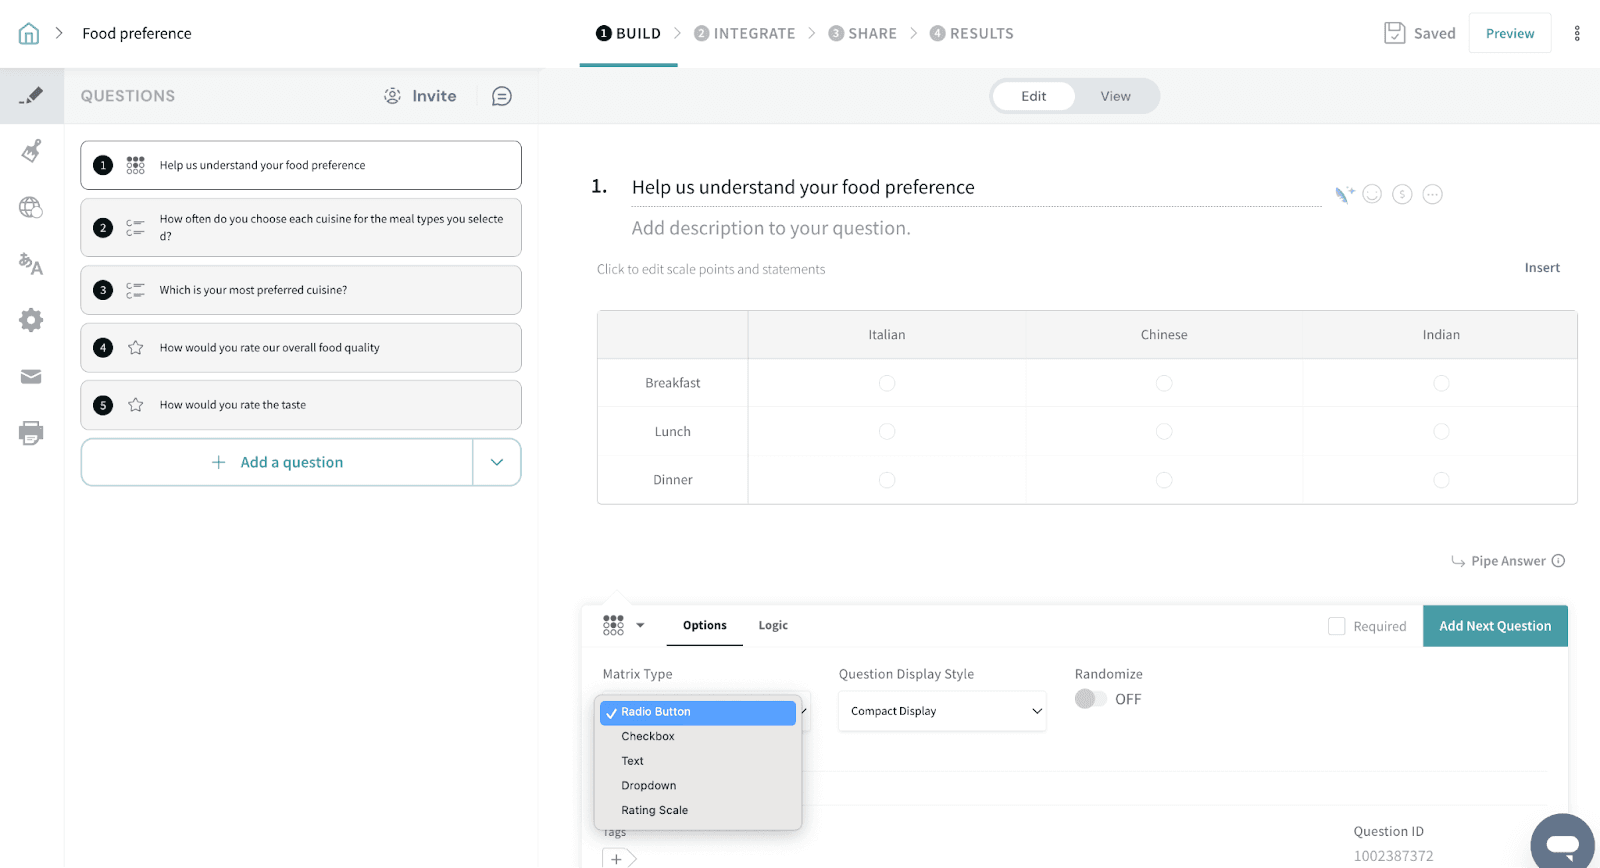
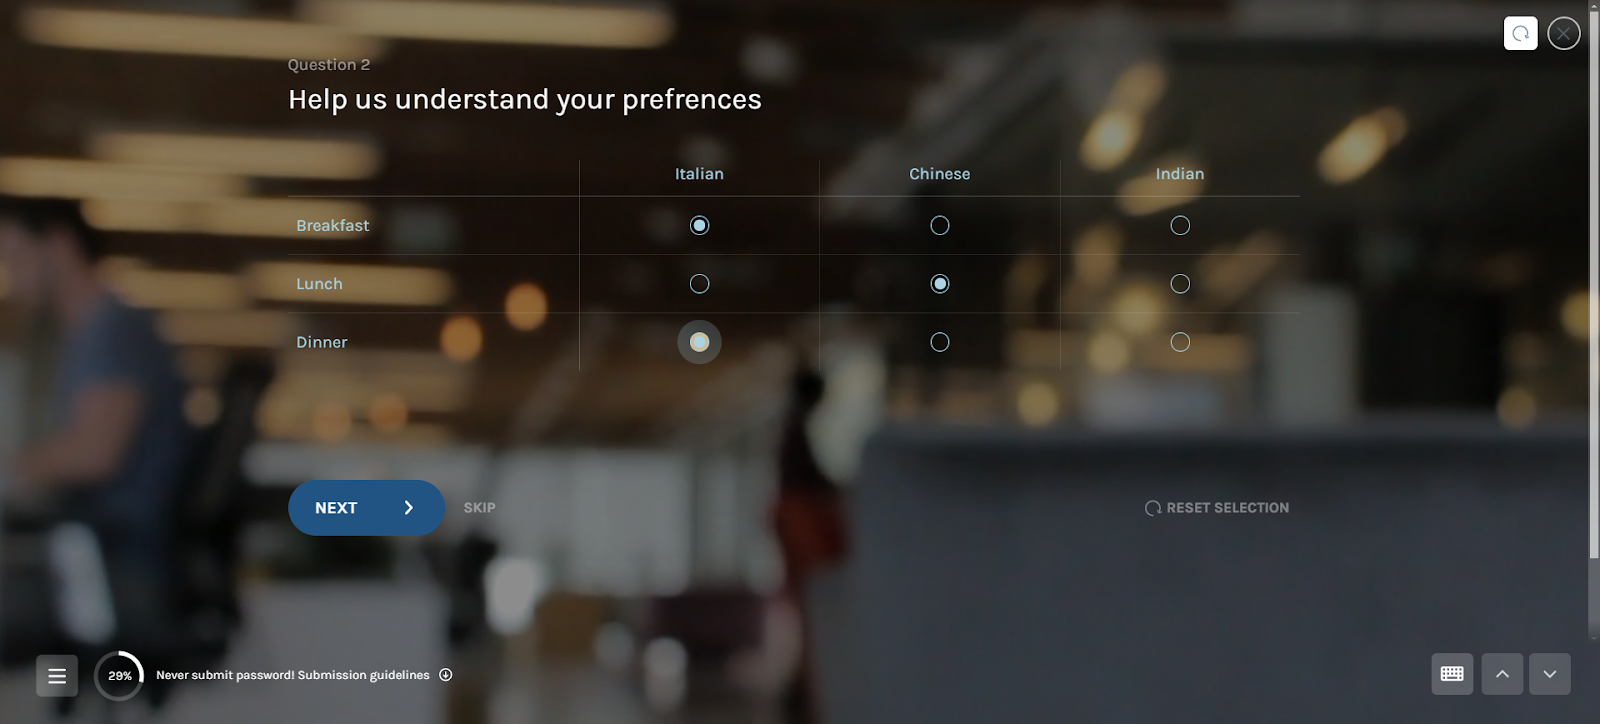
1. Radio Button
You can select only one option for a row.
Preview:
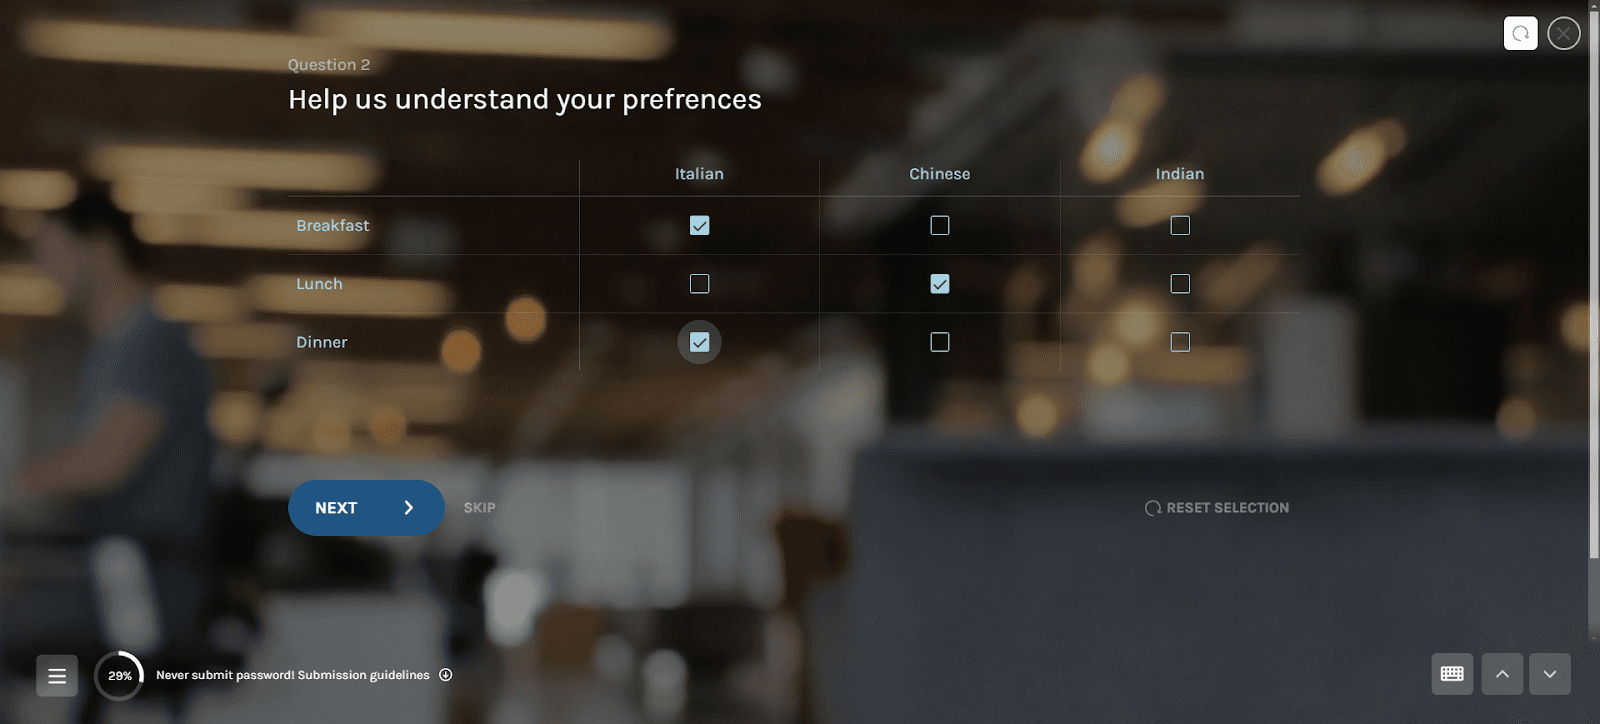
2. Check Box
You can select more than one option in a row.
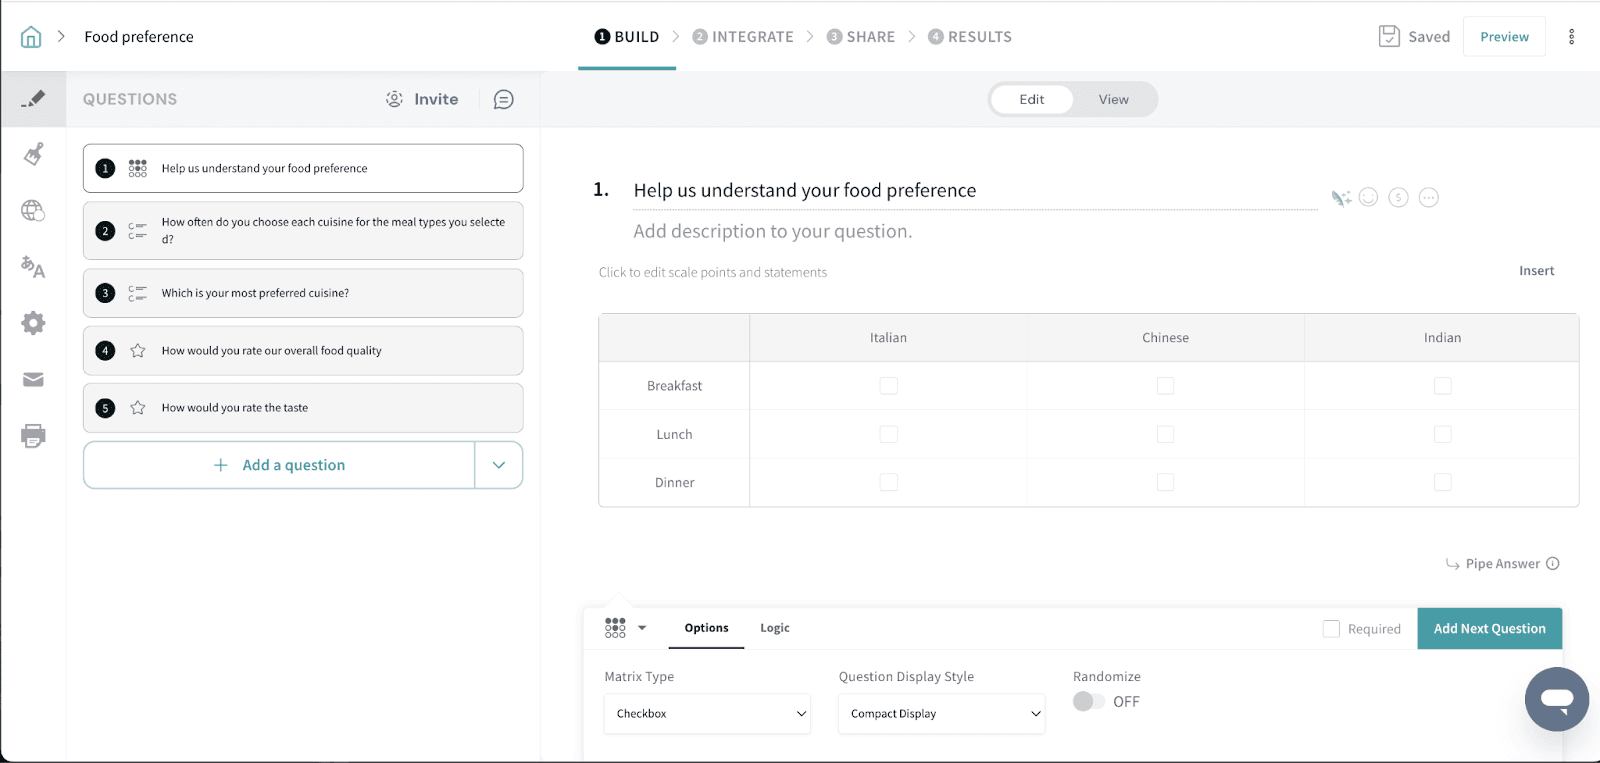
Preview:
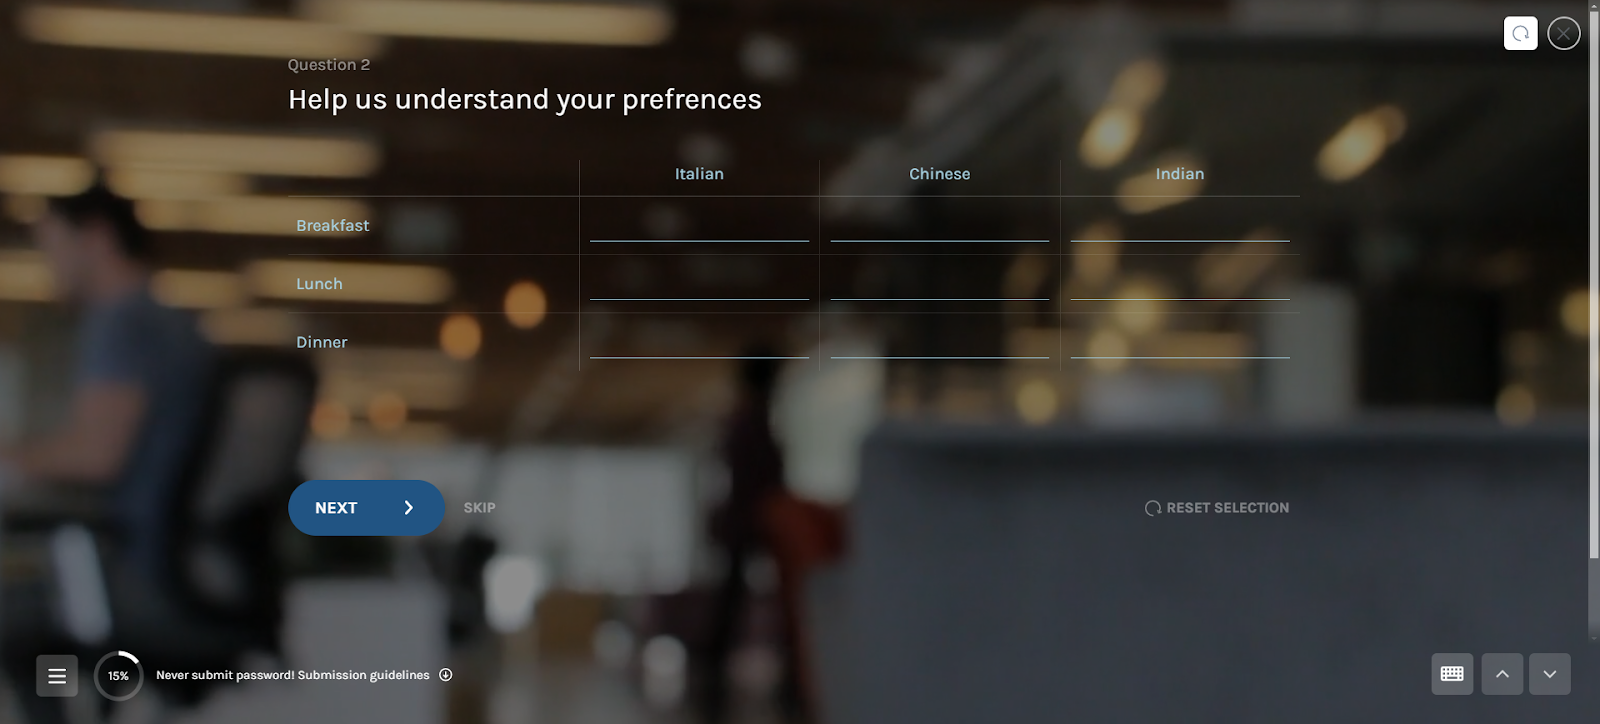
3. Text
Text matrix type allows the users to enter free text when they answer.
Preview:
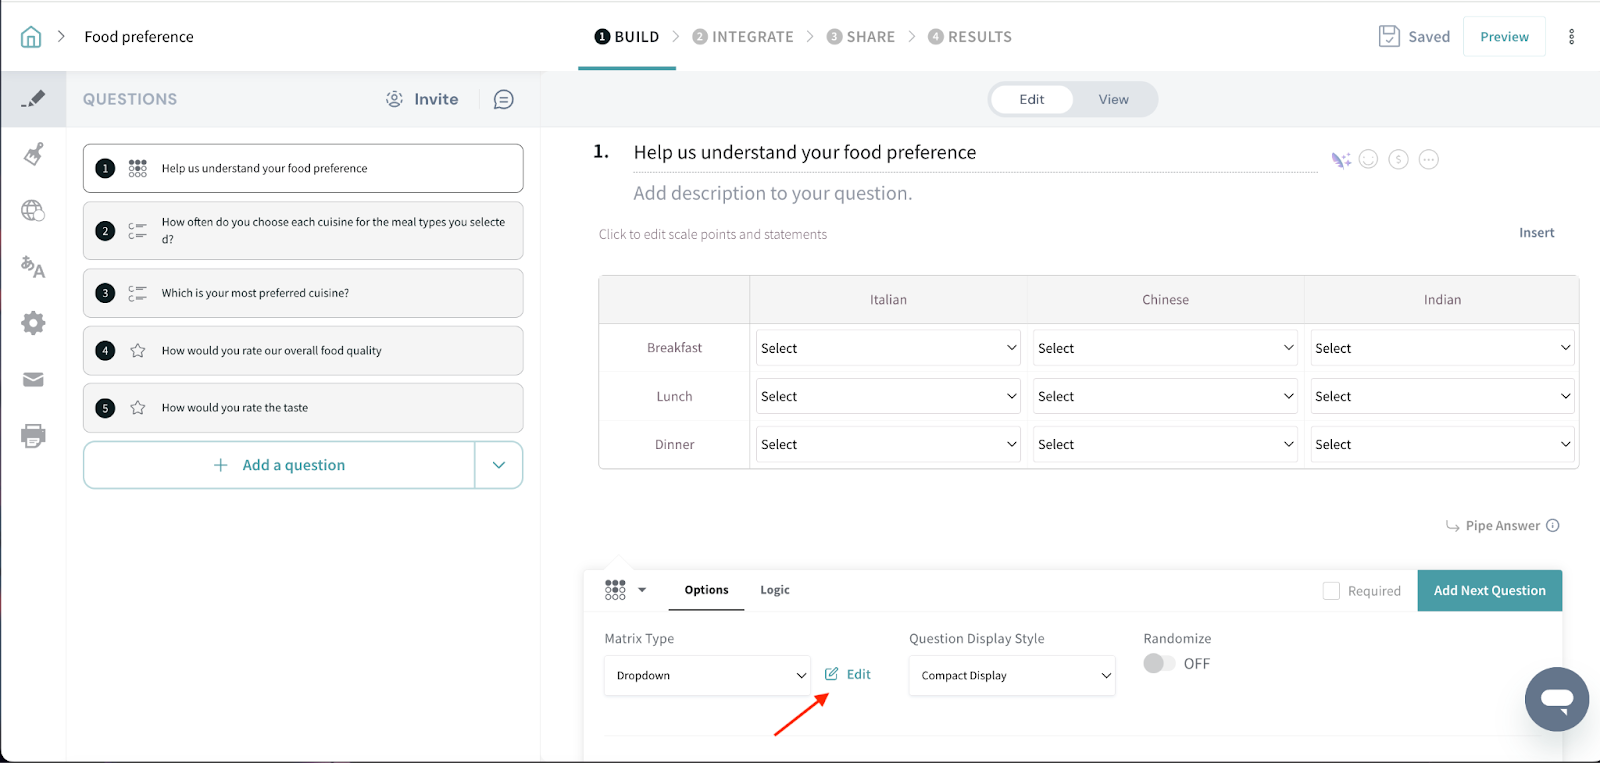
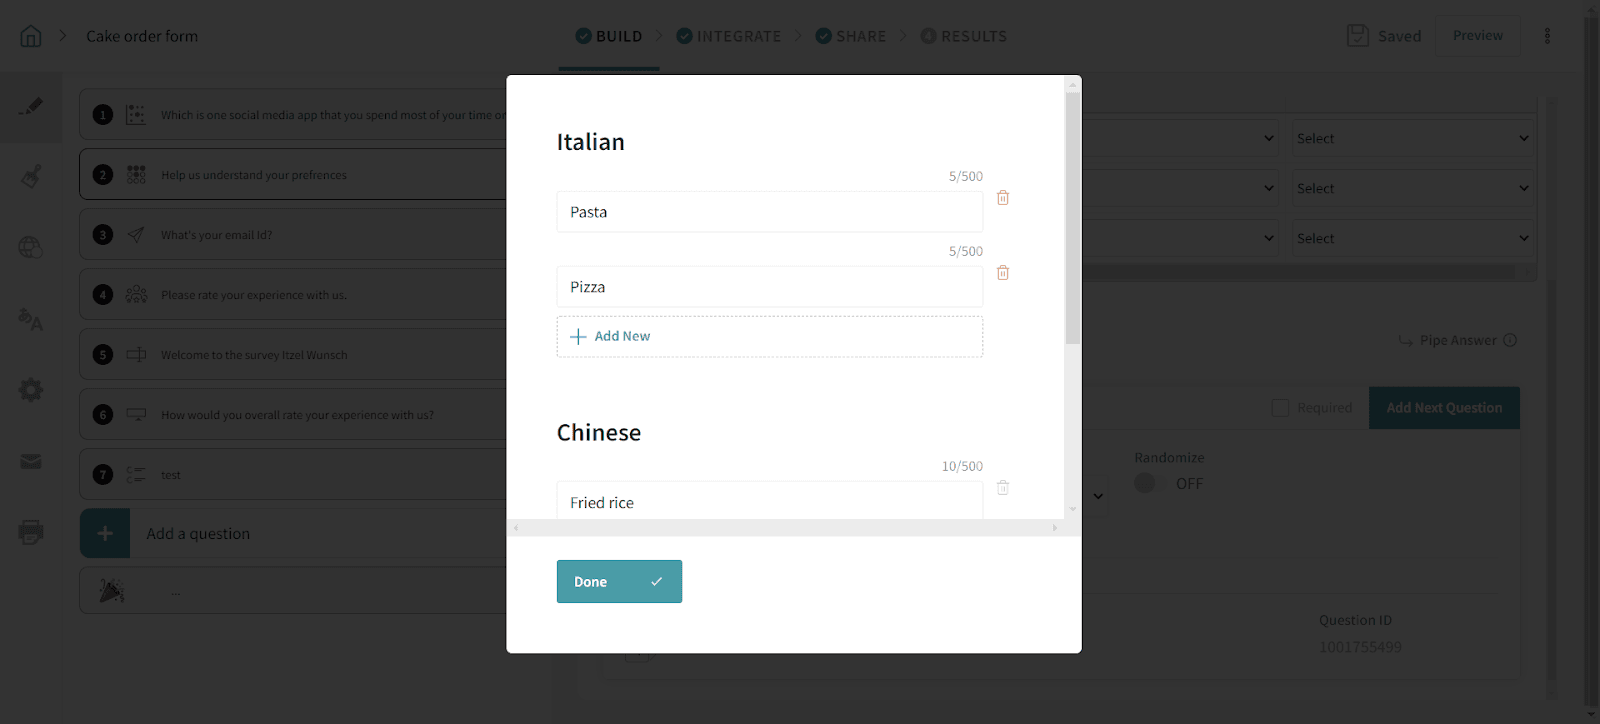
4. Dropdown
A list of options is shown in each cell of the matrix from which the respondents can choose their answers. To add or remove the values in the dropdown, click on the option highlighted.
Add options:
Preview:
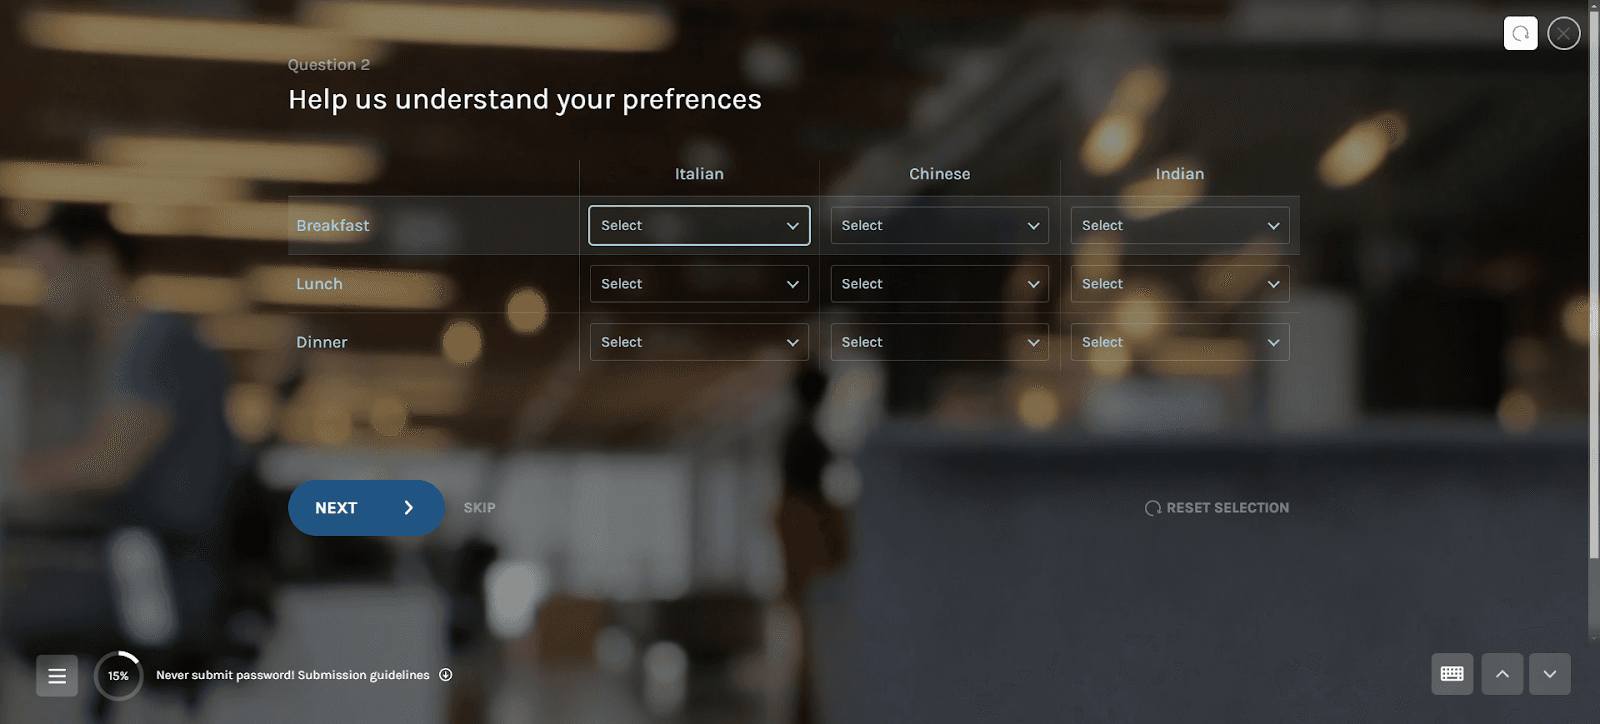
5. Rating Scale
Rating scale shows the rating in each cell of the matrix.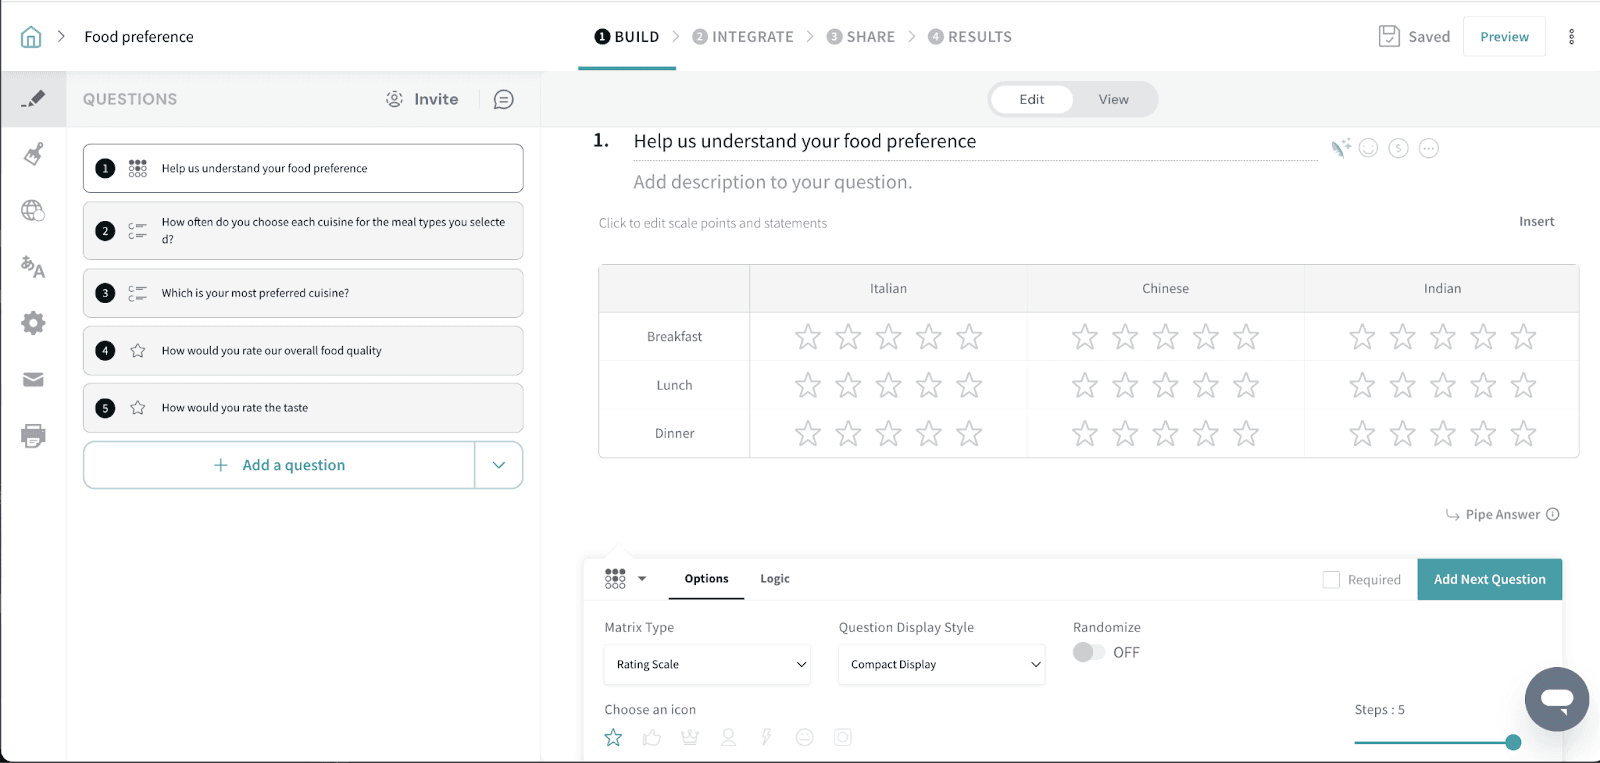
Preview:

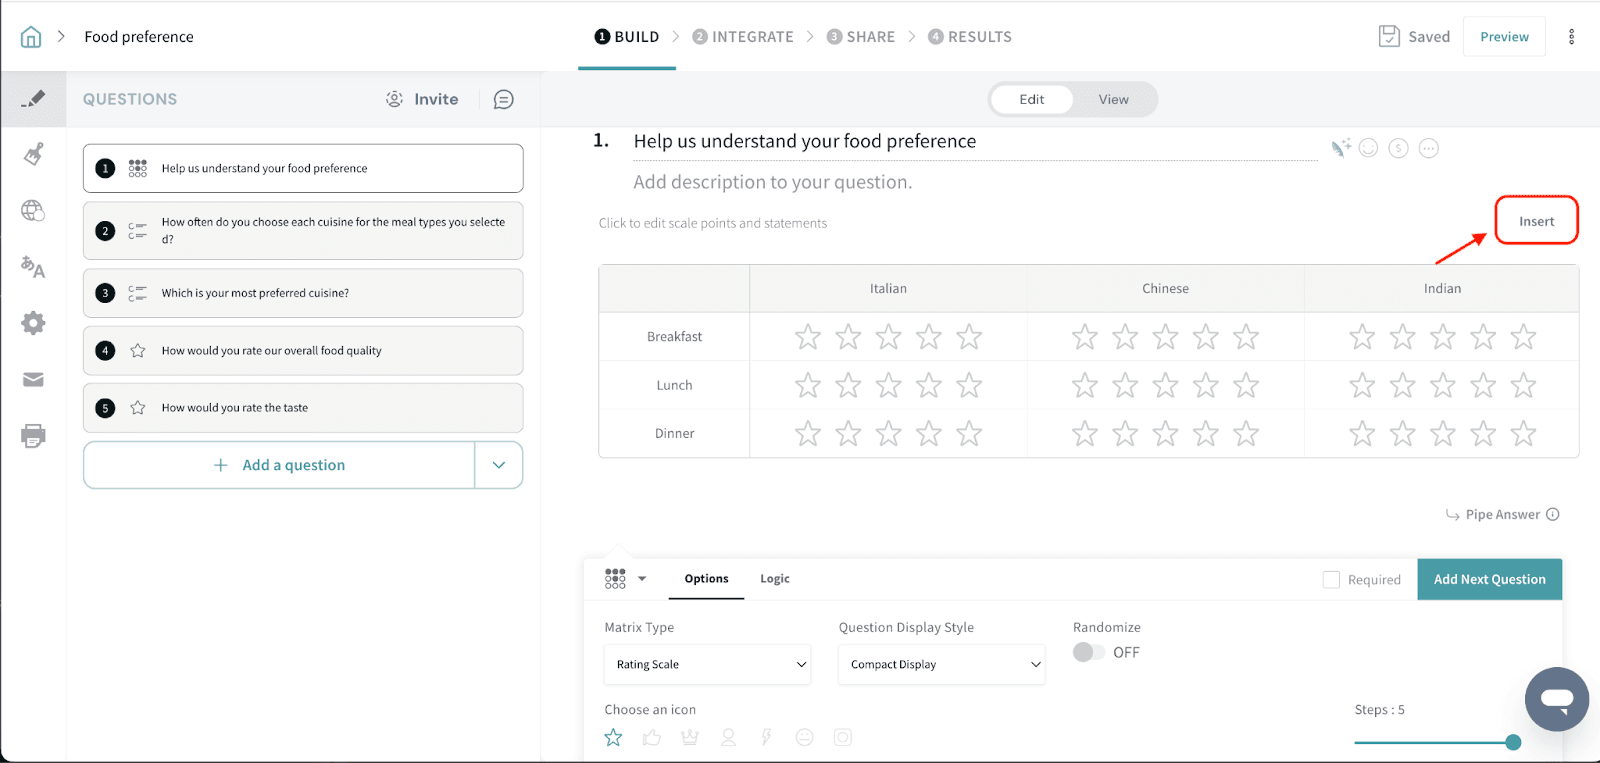
To insert/remove rows or columns, you can use the option highlighted in the screenshot below:
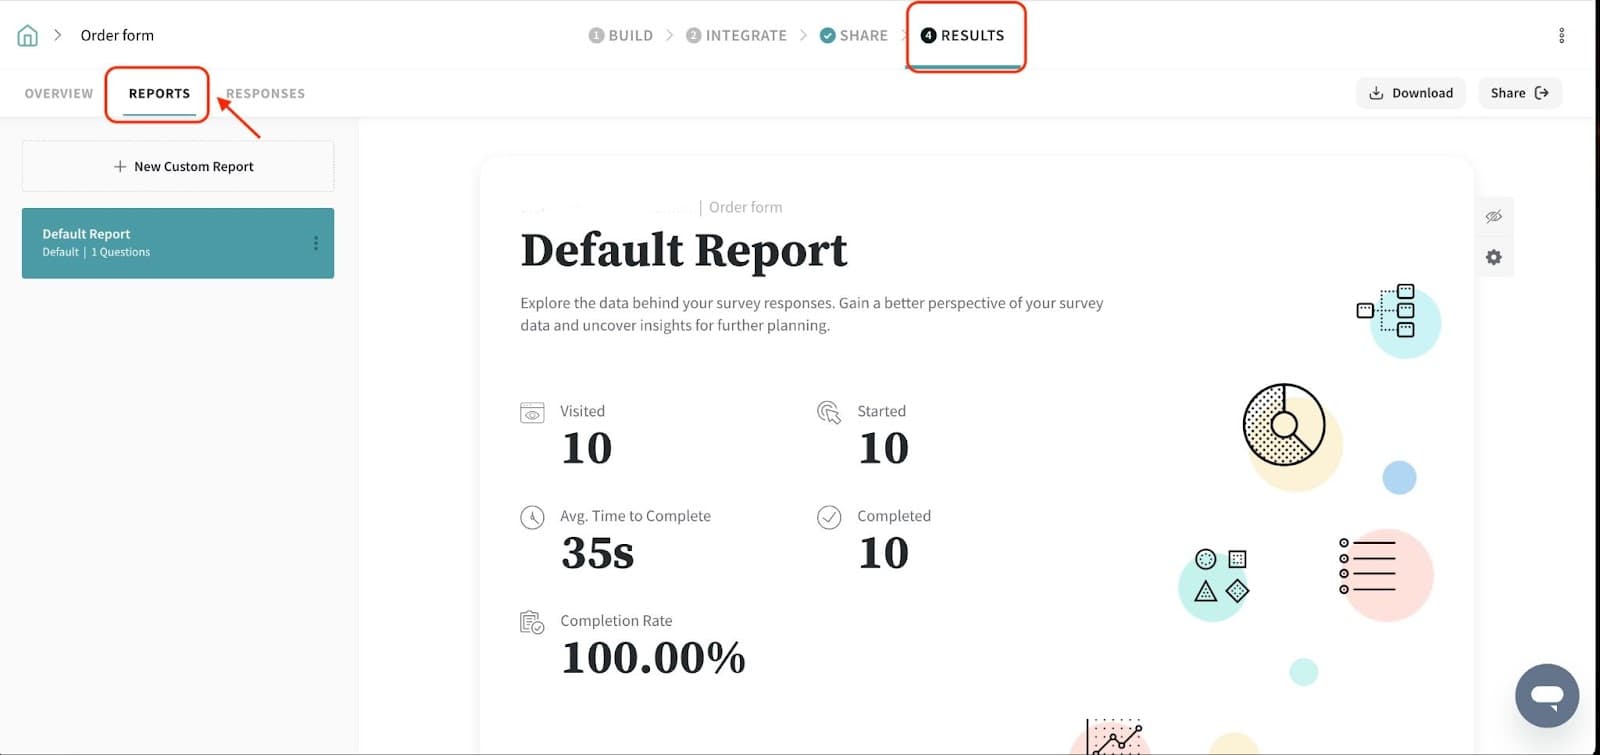
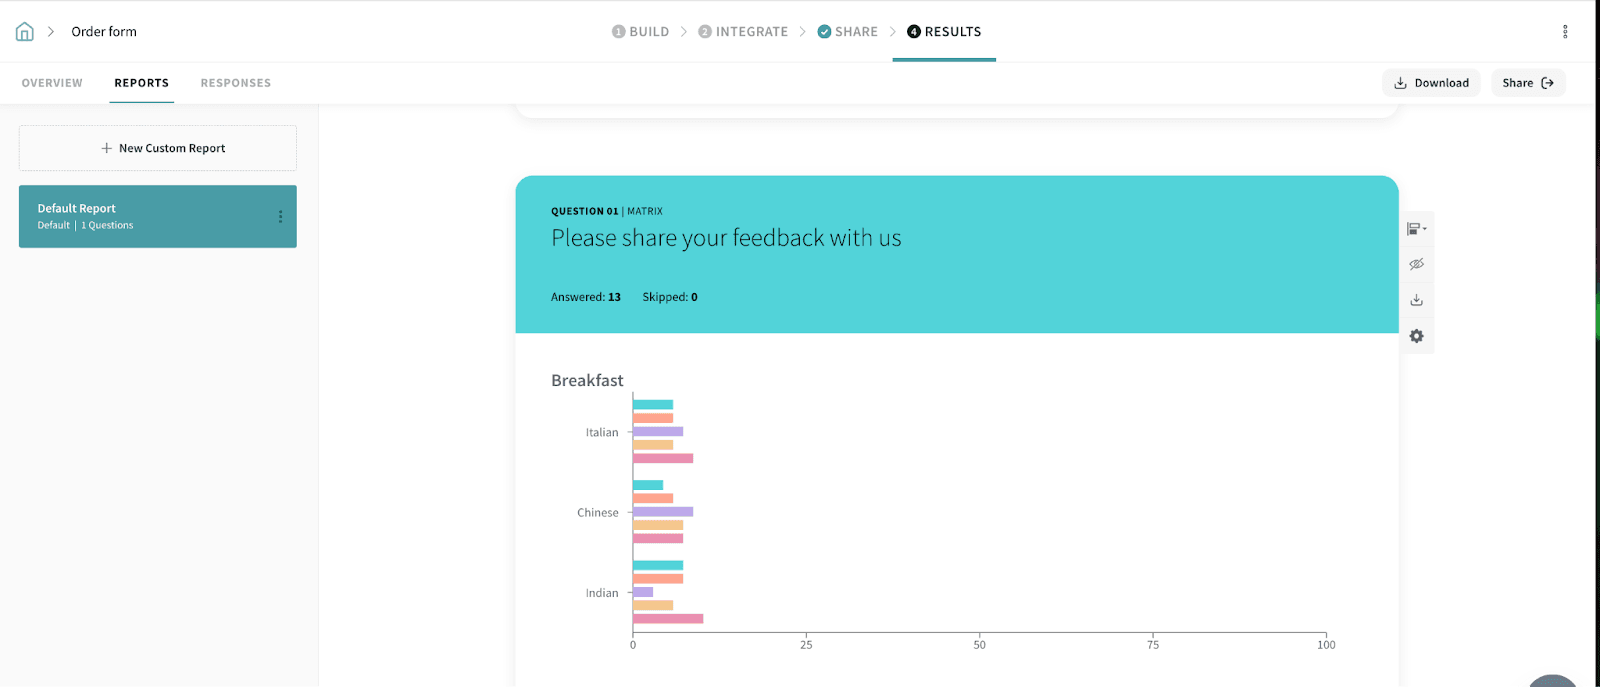
Now let’s look at the results section.
- Navigate to Results and go to Reports.
The reports will have a representation depending on the matrix type.
For Radio button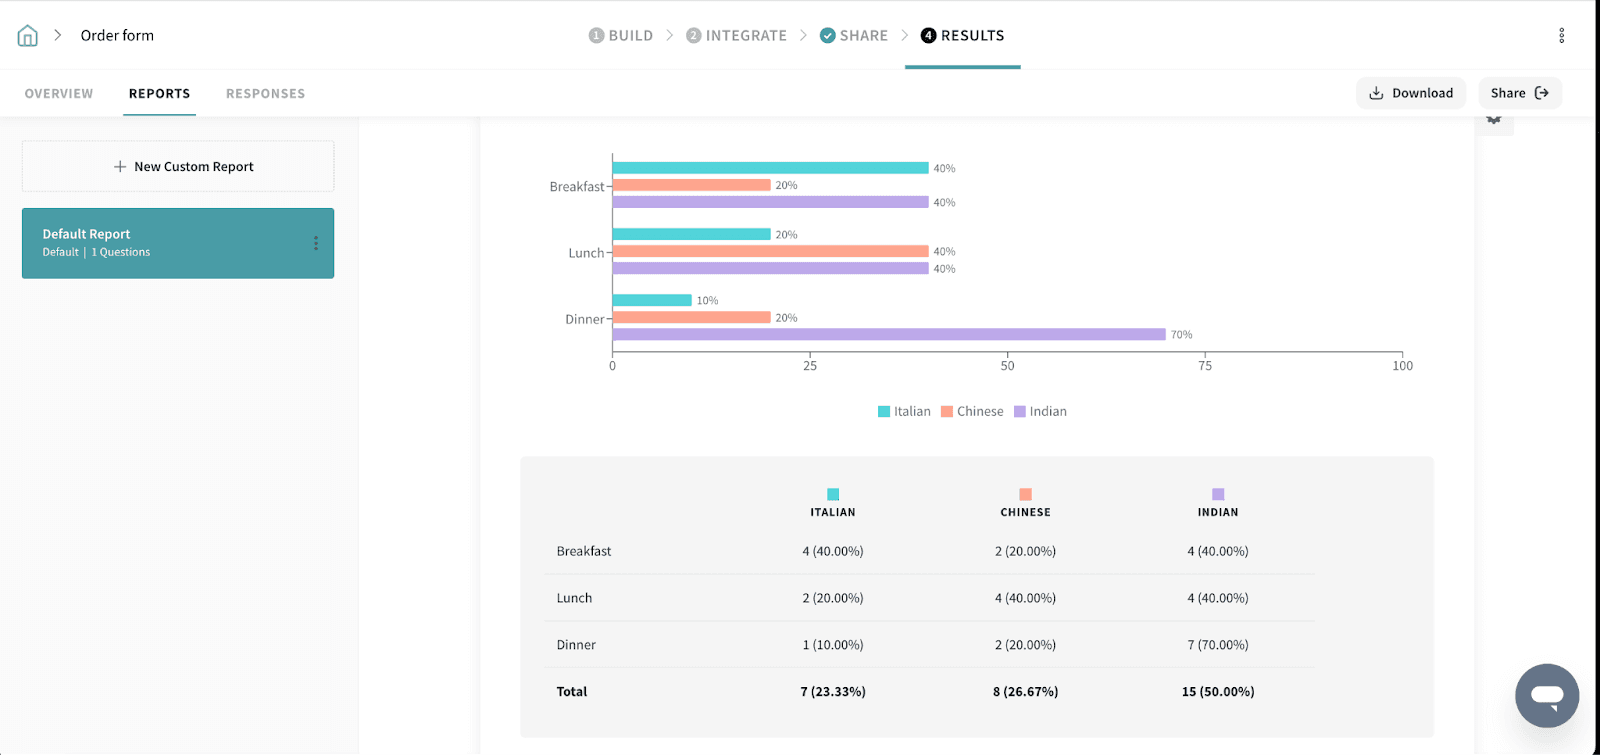
The bar graph shows the percentage of respondents who selected each option. The table displays the number of responses for each choice along with the percentage.
For example, if the question asks about breakfast preferences:
40% chose Italian
20% chose Chinese
40% chose Indian
This makes it easy to compare preferences and analyze trends at a glance.
For Checkbox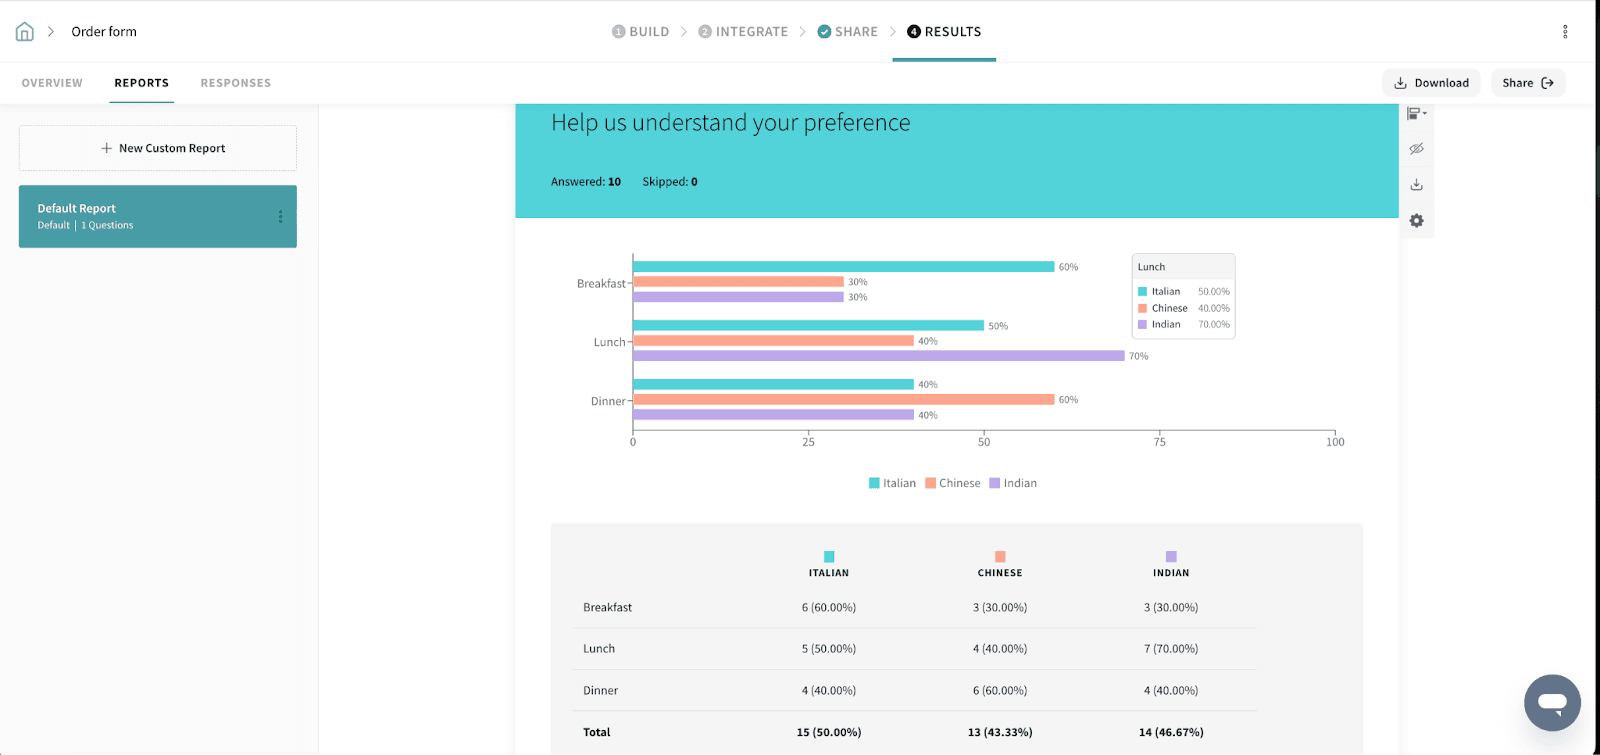
In a Checkbox Question, respondents can select multiple options for a single choice, meaning the total number of responses may be higher than the number of respondents.
For example, if 10 people were asked about their breakfast preferences:
- 6 (60%) selected Italian
- 3 (30%) selected Chinese
- 3 (30%) selected Indian
Since some respondents chose more than one option, the percentages reflect the proportion of total selections rather than individual respondents.
- The bar graph shows the percentage of times each option was selected.
- The table displays both the number of selections and their respective percentages.
For Dropdown
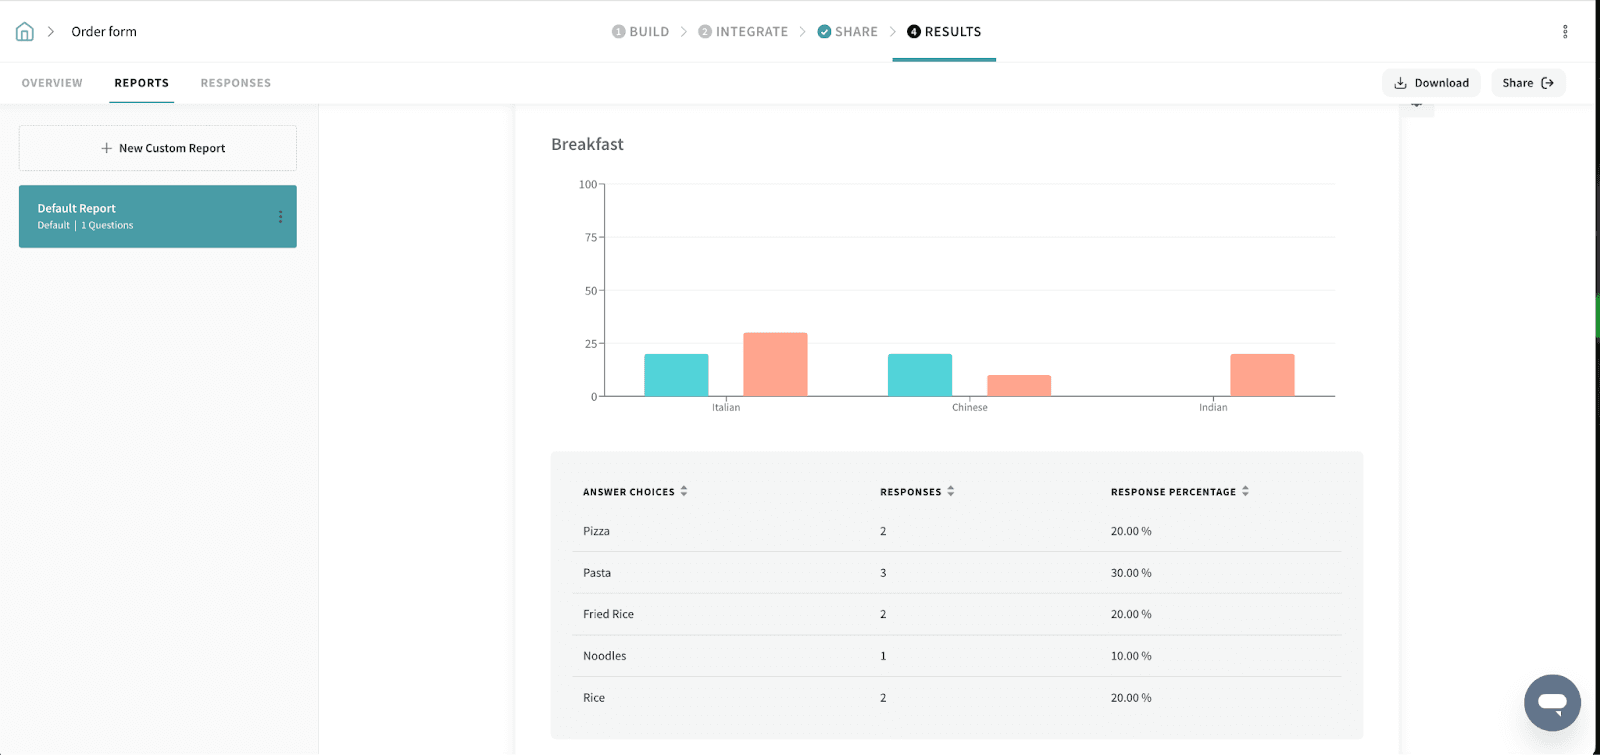
In a Dropdown Question, each row has a dropdown menu where respondents select one option. The results are displayed using both a bar graph and a table.
- The bar graph shows the percentage of respondents who selected each option within a category.
- The table displays the number of respondents for each choice along with the response percentage.
In our example, for breakfast
- Italian: 20% prefer Pizza, 30% prefer Pasta
- Chinese: 20% prefer Fried Rice, 10% prefer Noodles
- Indian: 20% prefer Rice
Since each respondent selects only one option per category, the percentages within a category add up based on respondent choices. The visualization helps in quickly analyzing preferences across different categories.
Rating scale
In a Matrix (Rating Scale) Question, respondents rate each item based on a given scale (e.g., 1 to 5). The results are displayed using both a bar graph and a table.
Bar Graph: Represents the percentage of respondents who selected each rating. Each bar corresponds to a specific rating option. The height of each bar reflects the proportion of respondents who chose that rating.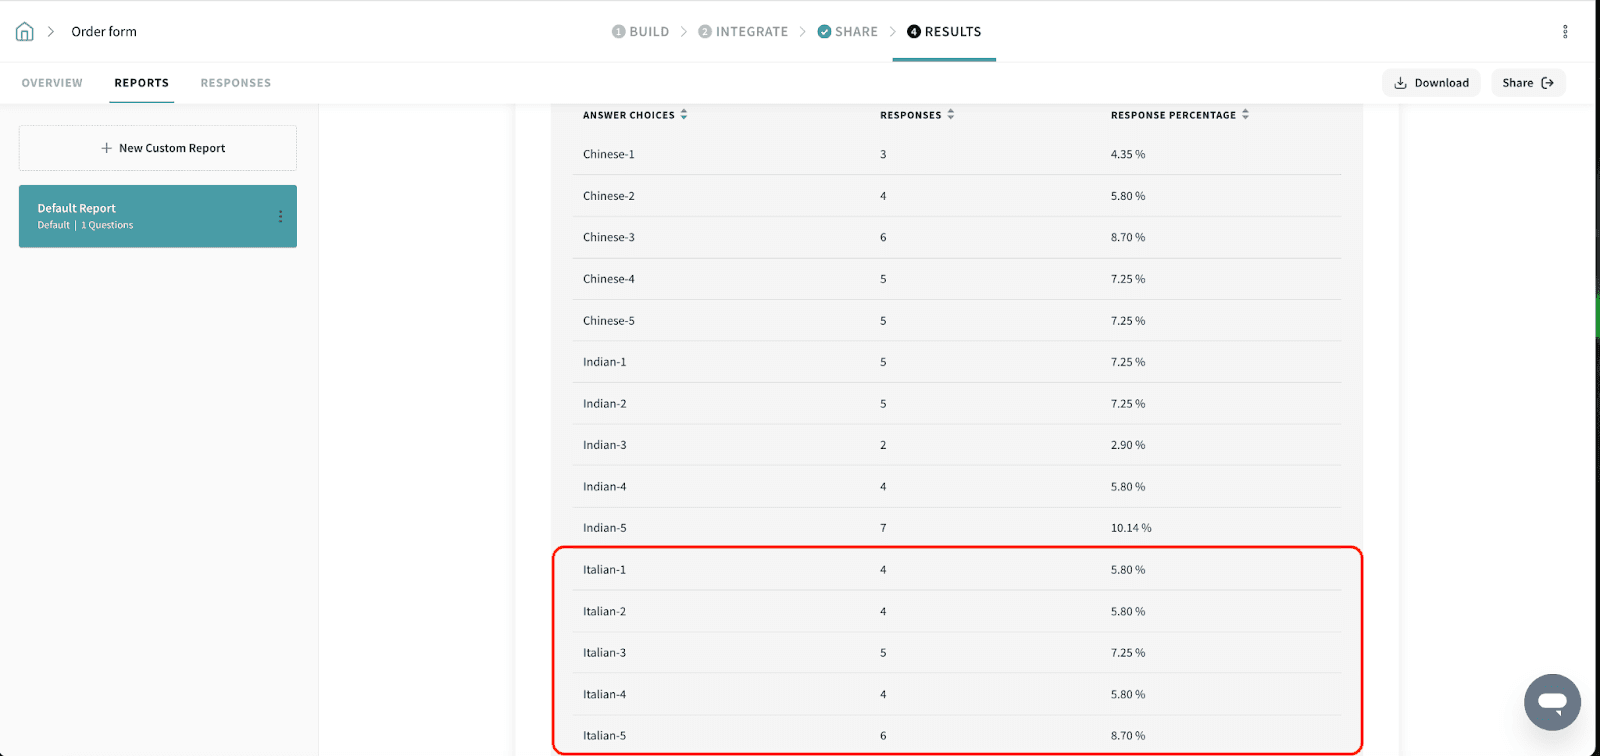
Table: This provides a detailed breakdown, showing the actual number of respondents who selected each rating alongside the corresponding percentage. This allows for a more precise understanding of how responses are distributed.
In our example regarding breakfast preferences
- 4 respondents (5.80%) gave a rating of 1
- 4 respondents (5.80%) gave a rating of 2
- 5 respondents (7.25%) gave a rating of 3
- 4 respondents (5.80%) gave a rating of 4
- 6 respondents (8.70%) gave a rating of 5
Text based
To understand this, let's look at a simple use case.
A grocery store is collecting feedback from customers on three food products: Chips, Chocolate, and Juice. They want to understand customer experiences based on three relevant attributes: Taste, Packaging, and Value for Money.
They create a matrix type question to collect open ended feedback from customers visiting the store.
After collecting the responses, this is how the results will look like
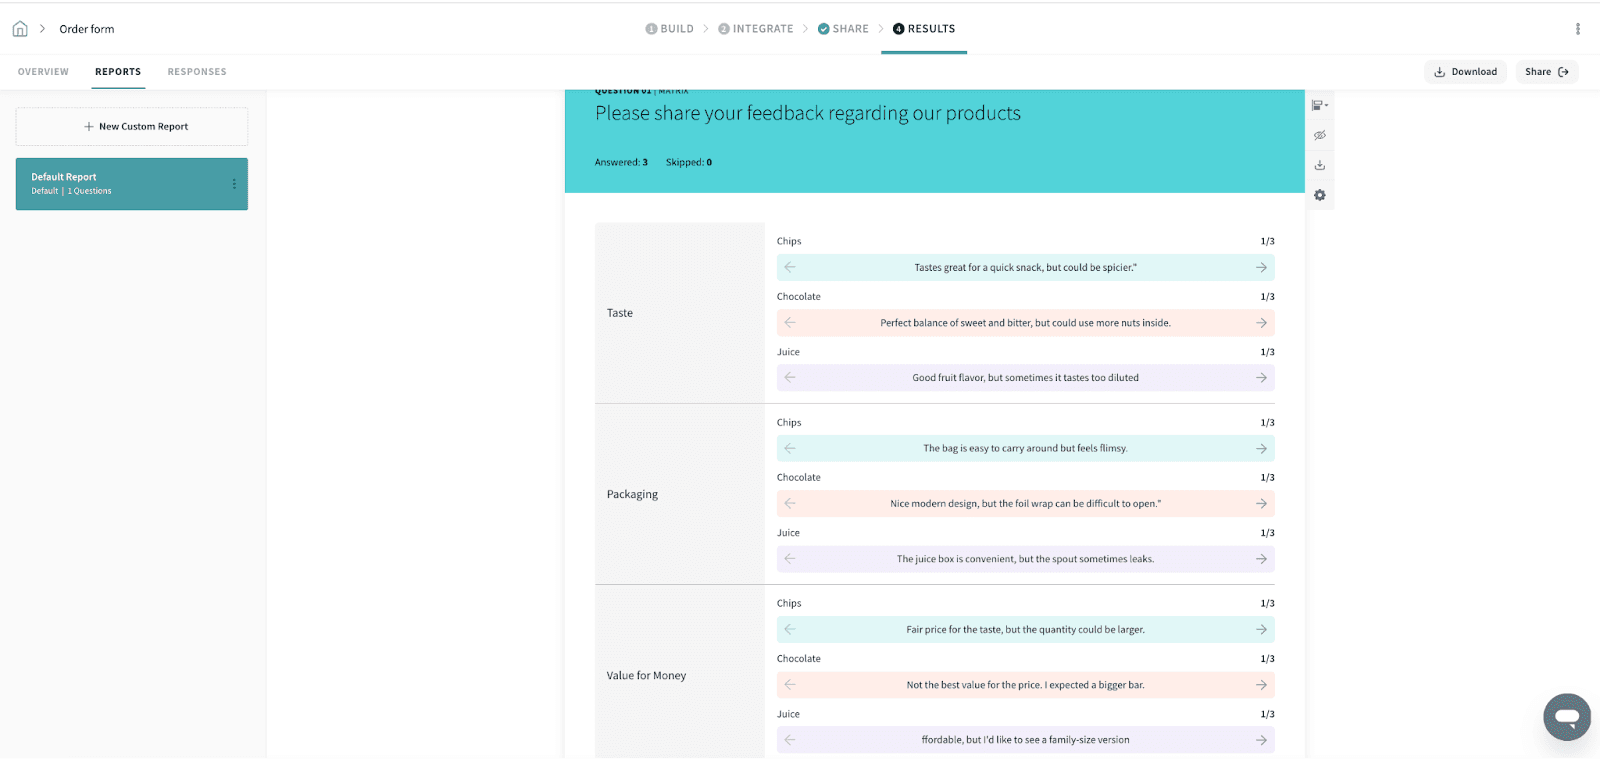
The reports organize all customer feedback based on the product and the specific attribute they commented on, such as taste, packaging, or value for money. Each comment is grouped under the relevant product and attribute.
The report will show all responses in a clear, organized manner, allowing the store to easily see patterns and trends across products and attributes, helping identify areas for improvement or strengths.
That's all about Matrix Grid question type.
Feel free to reach out to our community if you have any questions.