Search
The TV Dashboards options let you to visualize your meaningful data in a visually appealing TV view without distractions.
Cherry on the cake, you ask?
The dashboard refreshes by itself and gets updated once every 30 seconds.
Let’s first see how the TV dashboard works for NPS data and then we'll dive deeper into the Executive dashboard.
1. After collecting the responses for your NPS survey, navigate to the Results tab and Overview
![]()
2. Add or configure the NPS widgets according to your requirements
![]()
Note: The metrics you configure here will only be reflected in your TV dashboard, and it gets updated in real time.
3. Once done, click on the TV icon as shown in the screenshot below.
![]()
4. Name the dashboard. Select the Theme (Light or Dark). Copy the shareable link with public access where anyone with the link can access the dashboard, or you can restrict the dashboard access with a unique password.
![]()
Caution: To protect sensitive data, we recommend you choose a password protected access before sharing.
That’s all! Your dashboard is all set.
Let’s check how they look with dark and light themes.
![]()
![]()
The television view works well not just for NPS dashboards but for executive dashboards as well.
1. Go to the Dashboard and click on the TV icon.
![]()
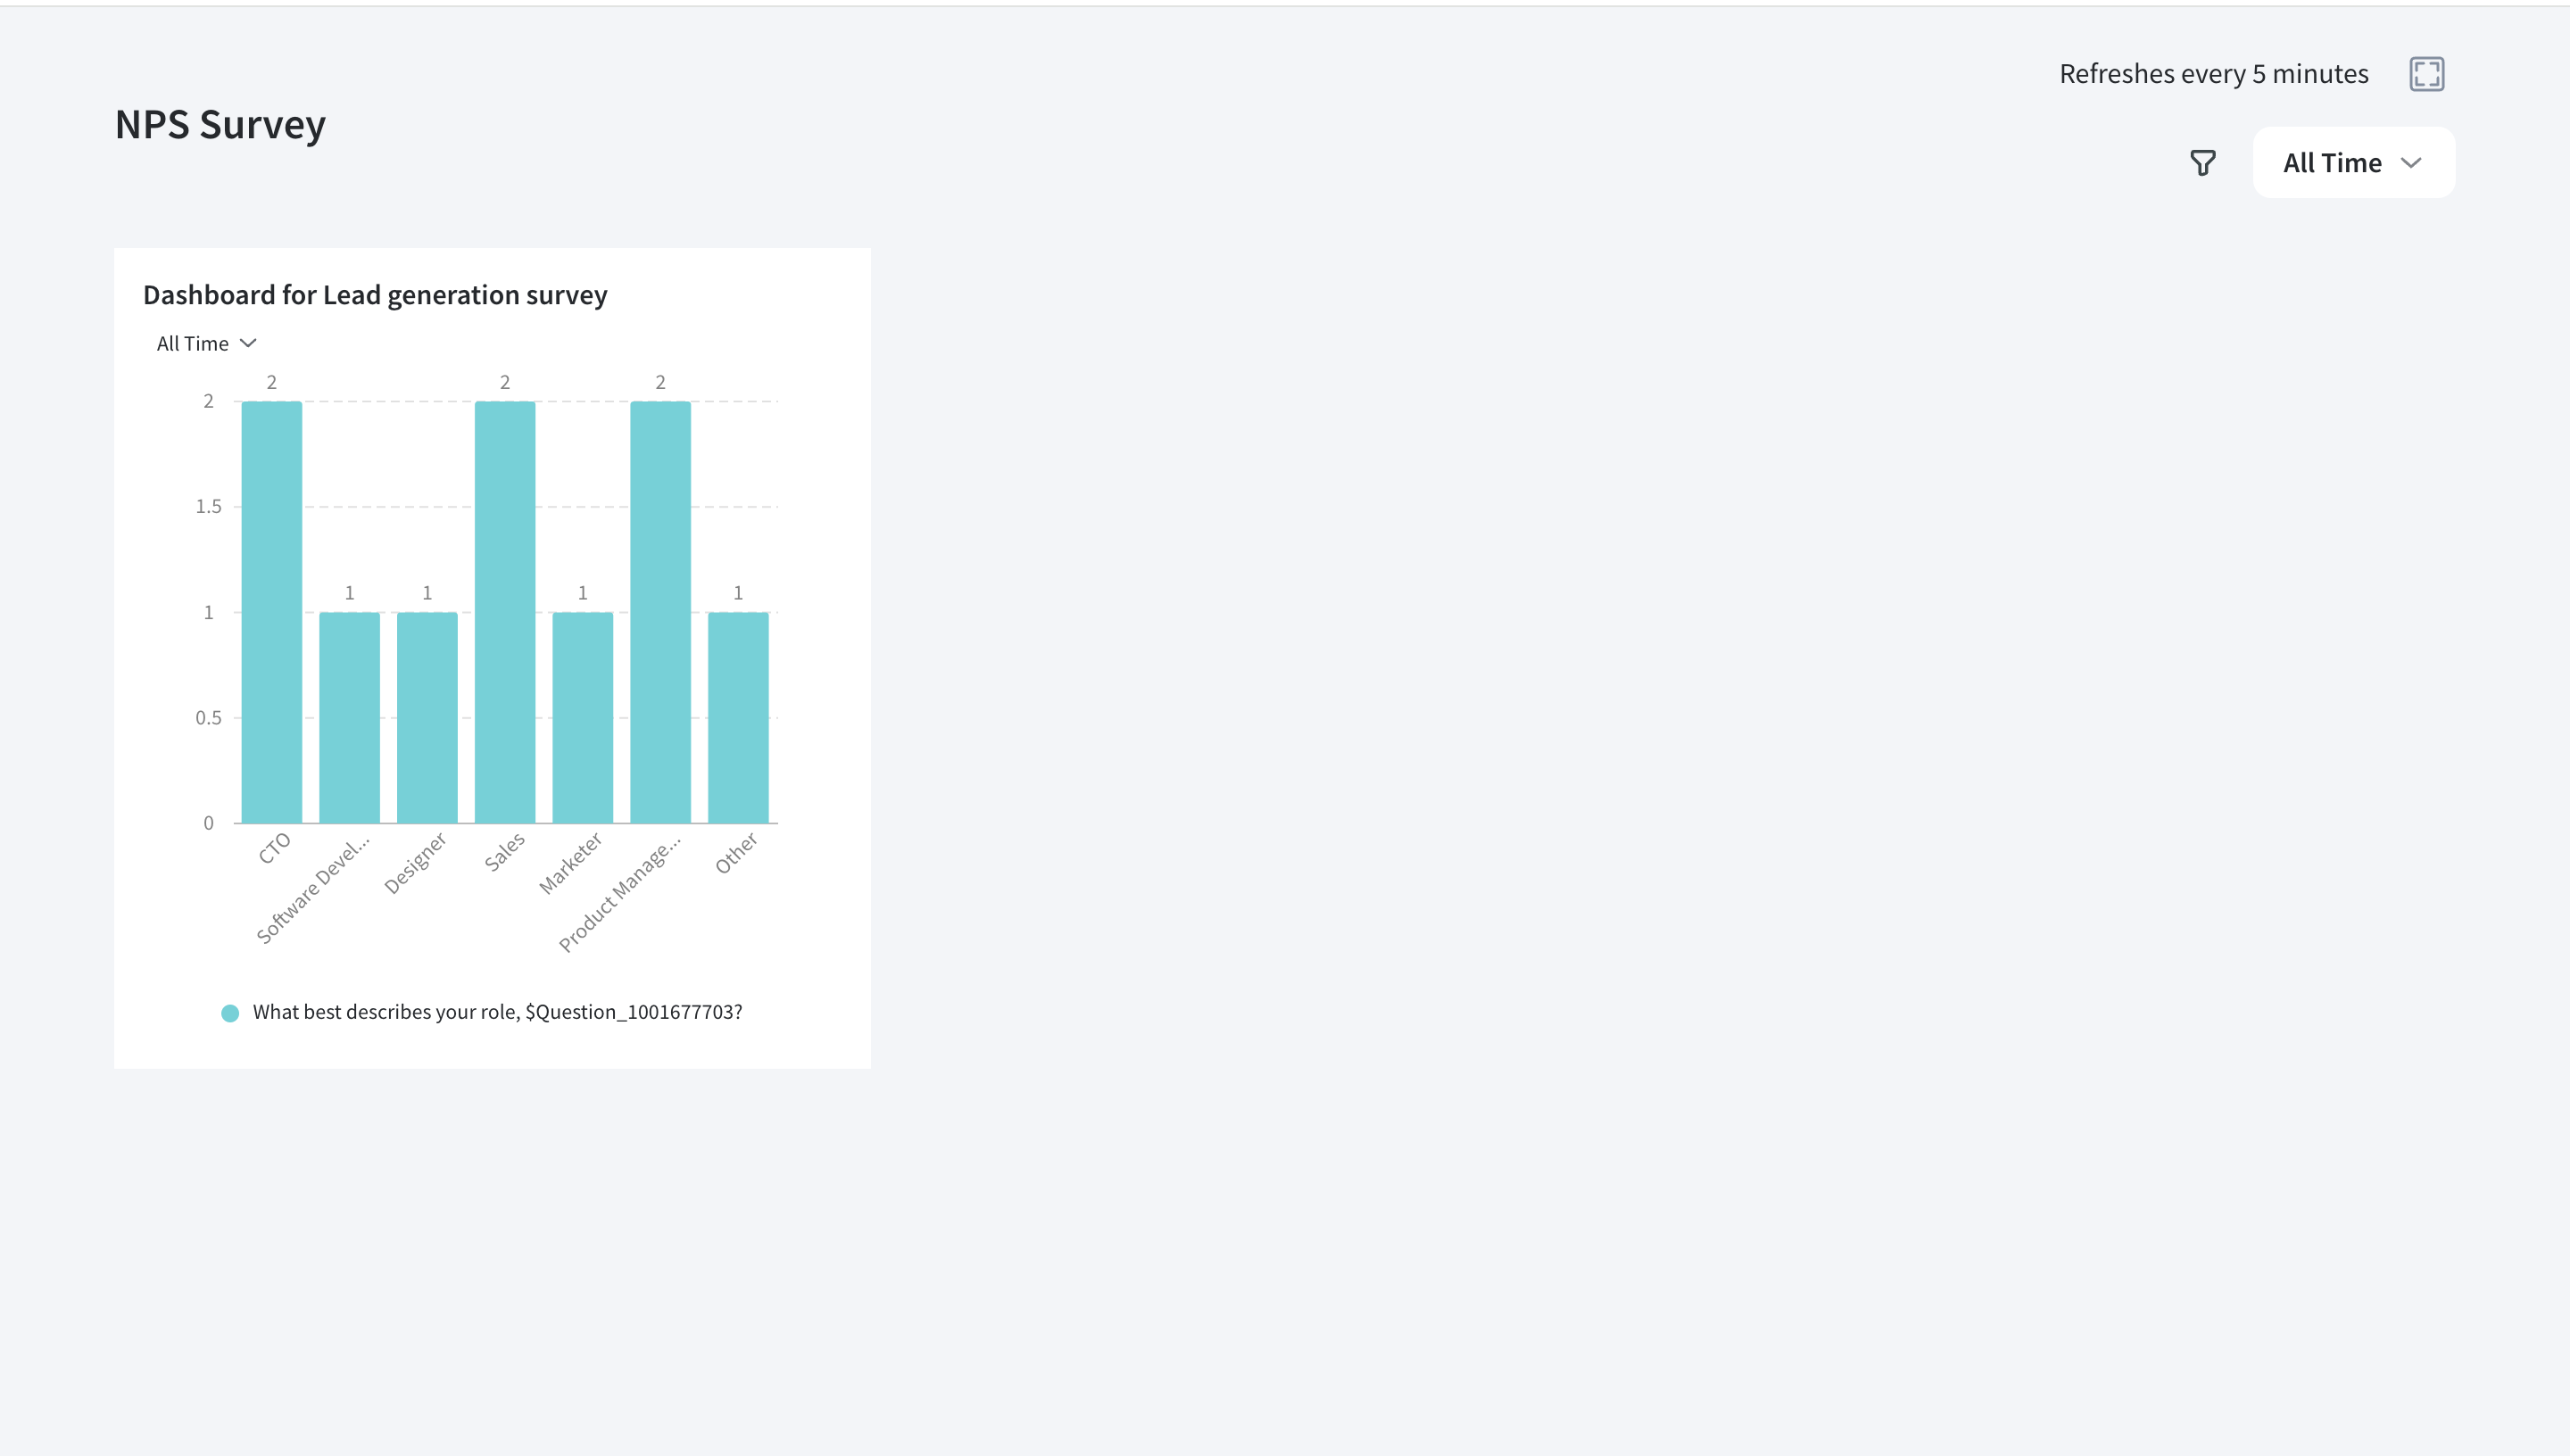
And here is a preview of how it'll look when you share the survey in both themes.
![]()

Note: The data refreshes and gets updated once every 30 seconds.
With this, we come to the end of this article, to explore executive dashboards, check this link.
Powered By SparrowDesk