Search
This article covers the following areas:
Numerous companies have adopted NPS as their metric to achieve customer success. It is an integral key performance indicator of an organization’s customer experience management(CEM) system. NPS not only drives company growth but also gives a clear picture of how a customer perceives your brand. Measuring NPS is a surefire way to identify brand advocates, gain quality customer testimonials, and drive overall revenue for your business.
A high NPS score indicates that the majority of your customer base is happy and that your business provides an outstanding customer experience program. A low NPS score indicates a large number of unhappy customers and that some drastic changes need to be made to prevent the wrath of high customer churn rates.
Both NPS and CSAT play vital roles in a company’s customer experience management program. But they can’t be used interchangeably. Let’s take a look at the differences between the net promoter score and CSAT.
“CSAT measures customer satisfaction based on certain experiences with your business, such as product purchases, calls with the support team, and onboarding & offboarding sessions. NPS, on the other hand, measures a customer’s loyalty based on their likelihood of recommending your brand to a friend or family member.”
For fuelling business growth and revenue, NPS is the more trusted metric since it focuses on the customer’s overall experience and happiness with a brand long-term. Customer satisfaction concentrates mainly on a customer’s short-term experiences based on interactions at various touchpoints.
The outcomes derived from CSAT scores help organizations improve specific processes and experiences where customers face issues. NPS outcomes help companies dig deeper into the underlying problems faced by customers due to the efficient segmentation of respondents into promoters, passives, and detractors. This leads to organization-wide improvements.
CSAT is calculated by dividing the total of all scores by the number of responses. In contrast, the Net Promoter Score is calculated by finding the difference between the percentage of promoters and the percentage of detractors.
There are two types of NPS - relational and transactional. A relational NPS is typically sent on a quarterly or annual basis to customers to gauge their overall perception and experience with your product or service. A transactional NPS, on the other hand, is sent right after various customer interactions with your brand, such as product purchases or resolving issues with the support team.
The Net Promoter Score methodology is asking your customers the following question:
“On a scale of 0-10, how likely are you to recommend our product to a friend or family?”
For transactional NPS, the Net Promoter Score question can be framed in the following ways:
The Net Promoter Score ranges from -100 to 100. The higher the NPS, the better. The NPS scale divides the scores as follows:
0-6
Detractors
7-8
Passives
9-10
Promoters
Detractors are customers who are highly dissatisfied and are on the verge of churning. Passives are the intermediate customers that feel so-so about your brand. They’re not entirely unhappy to churn; neither are they loyal enough to promote your business. Promoters are those customers who absolutely love your brand overall and can be identified as brand advocates.
The Net Promoter Score calculation is as follows:
“NPS is calculated by subtracting the percentage of detractors from the percentage of promoters.”
For example, suppose you have received 100 responses for your NPS survey. Out of which 40 are promoters, 30 are passives, and 30 are detractors. Passives are not included as part of the NPS calculation.
So, the percentage of detractors would be 30/100 = 0.3
Percentage of promoters: 40/100 = 0.4
Therefore, your NPS is: 0.4 - 0.3 = 0.1
In general, an NPS score that is above 0 is considered to be good in the competitive market. The main goal is to ensure that the number of promoters is higher than the number of detractors.
A negative NPS score indicates that you have a higher number of detractors than promoters. This means that your business needs to take some serious measures in order to retain customers and prevent losing them to competitors.
Keep in mind that a “good NPS score” varies by industry. So if you’re comparing your score to those of other companies, it’s better to run comparisons with companies that fall in your industry set to get an accurate idea. Benchmark your NPS to gain a better understanding of how your company fares in the customer loyalty department. If your score is higher than the average NPS in your industry set, give yourself a pat on the back! Your company is doing a stellar job in creating a customer-centric culture and should continue to do so.
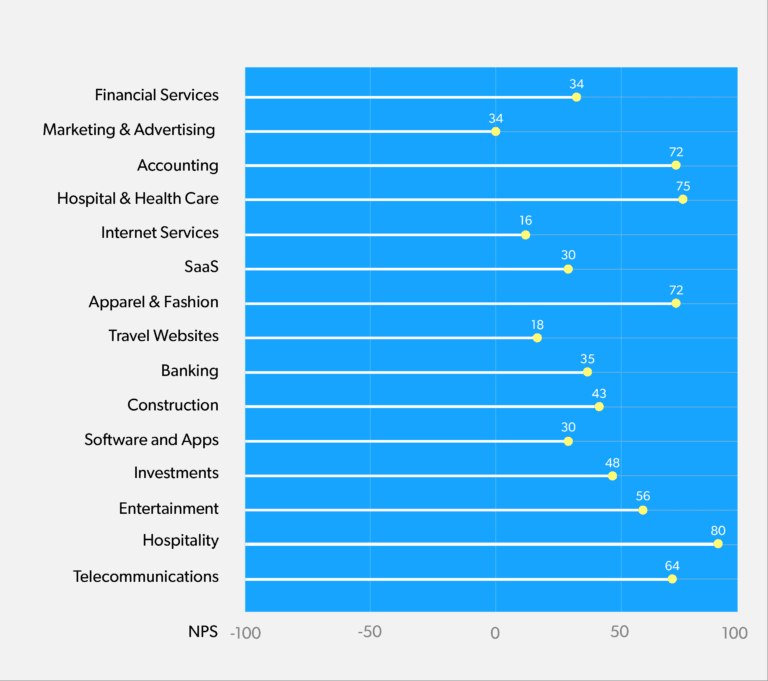
Source: https://surveysparrow.com/blog/guide-to-benchmark-nps-score/
NPS caters to not just how a customer feels about your brand but also how your employee perceives the work environment at your company. The employee net promoter score or eNPS measures how likely an employee would recommend your workplace to a friend or family.
It depicts an employee’s loyalty to your organization and is the key driver for boosting employee retention. eNPS can help predict employee churn and cause companies to act fast in terms of establishing a healthy work environment for their employees.
The employee net promoter score is measured in the same way as the standard NPS. The eNPS question is as follows:
“On a scale of 0-10, how likely are you to recommend our workplace to a friend or family?”
eNPS is also relational and transactional in nature. Transactional eNPS is measured after various touchpoints in an employee’s journey, such as:
We recommend the use of robust NPS feedback software to collect ratings from your customers and calculate your NPS proactively. Here’s how you can measure your net promoter score using SurveySparrow:
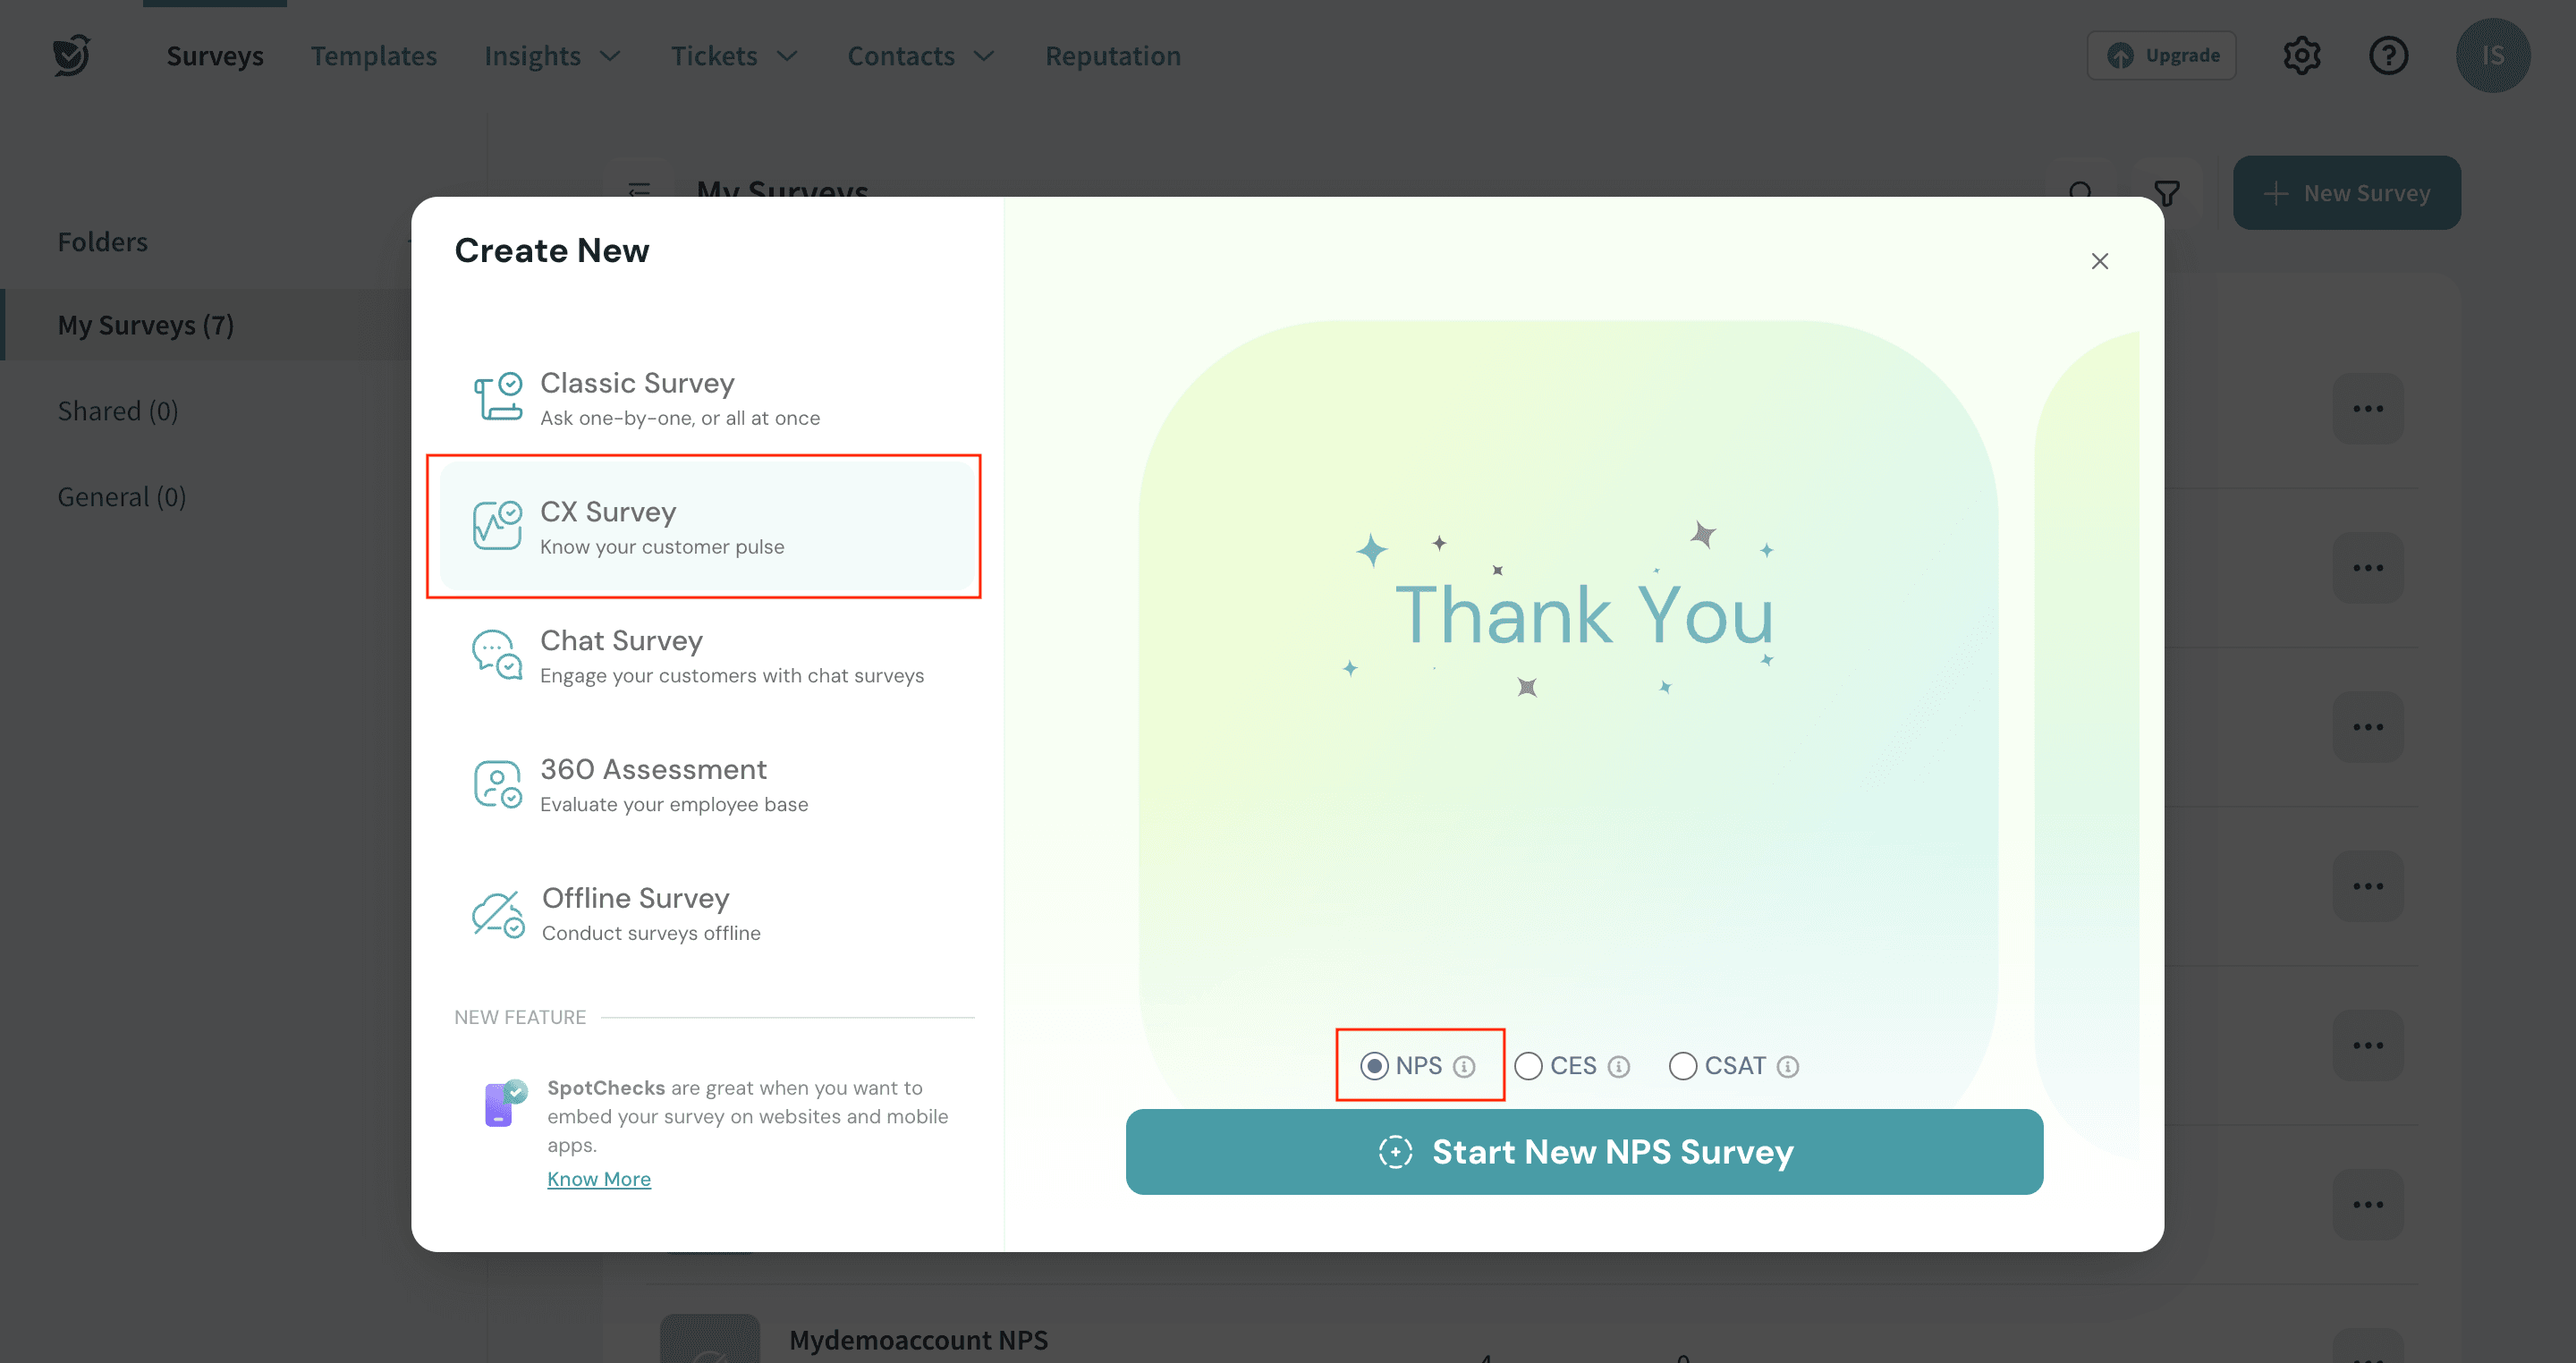
1. Click + New Survey on the top right corner of your survey dashboard and select NPS Survey.
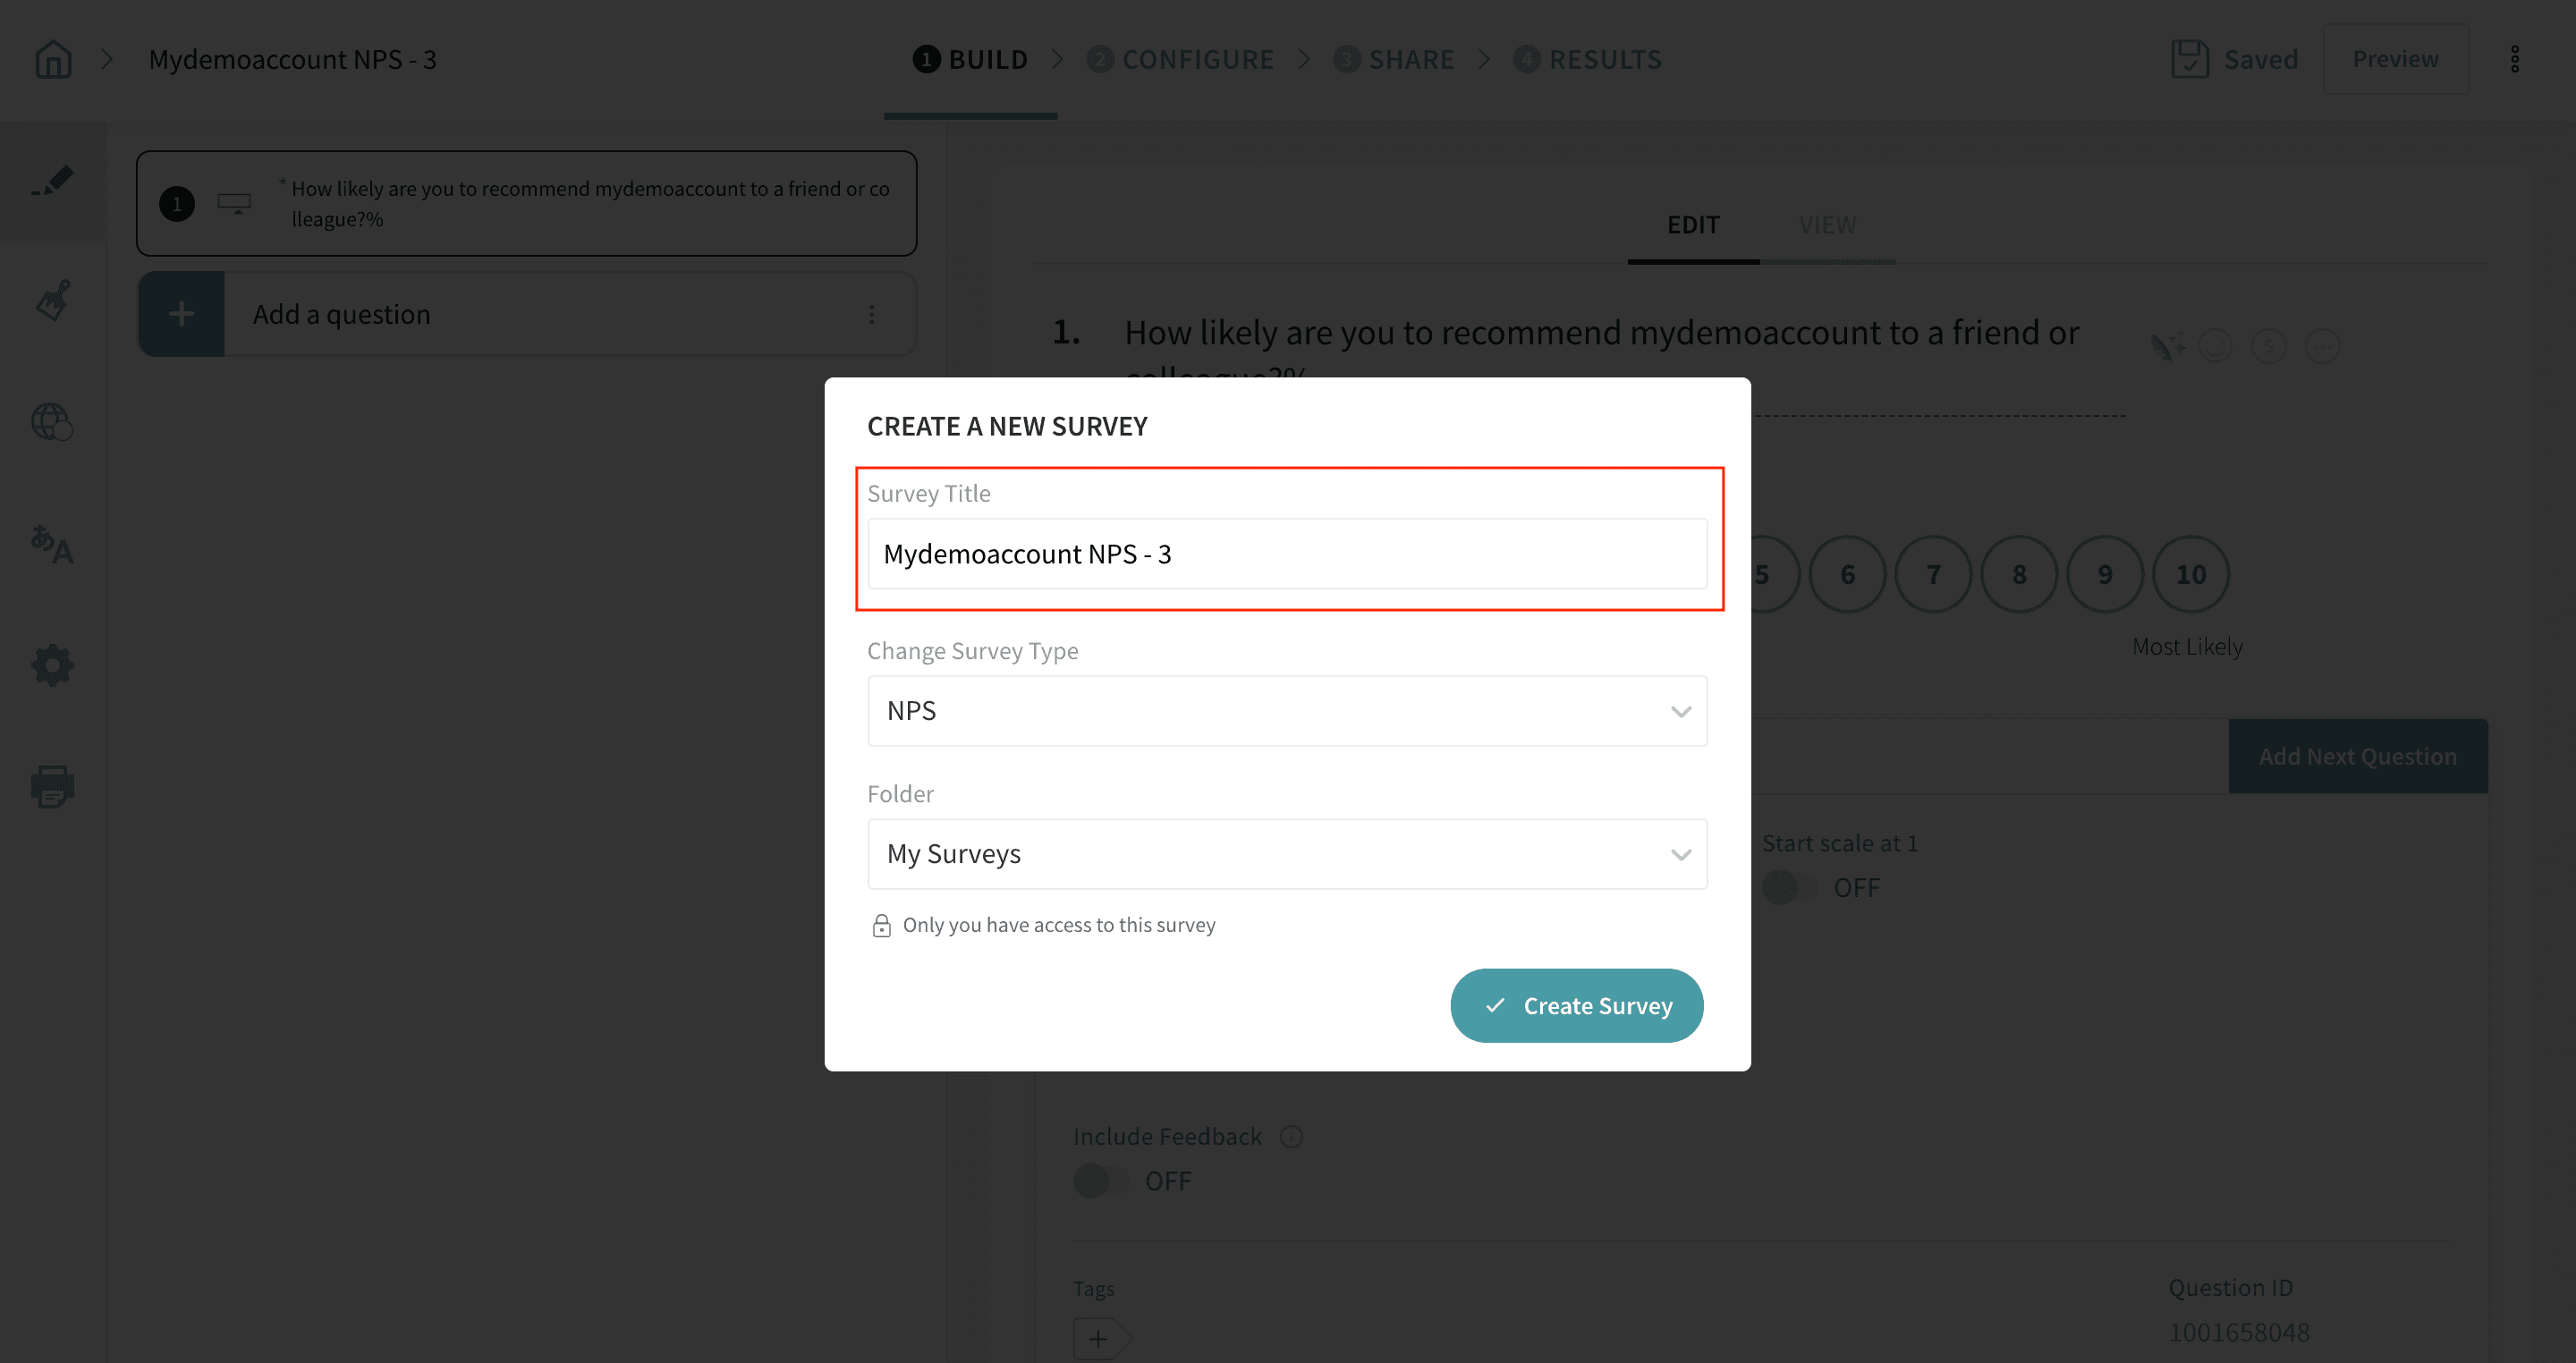
2. Modify the survey title to your liking and click Next.
3. You can edit your NPS question and add variables such as contact details or custom variables to personalize your survey. This can be achieved by clicking the dollar sign($) next to your question.
You can also start the scale 1, customize the label texts, and enable the option to segment your scale to mark promoters, passives, and detractors. The colors are customizable.

4. For the open-ended follow-up question, you can edit as required and use question piping to pipe your respondents’ NPS scores into the question. All you need to do is click the dollar sign($) on the right-hand side.
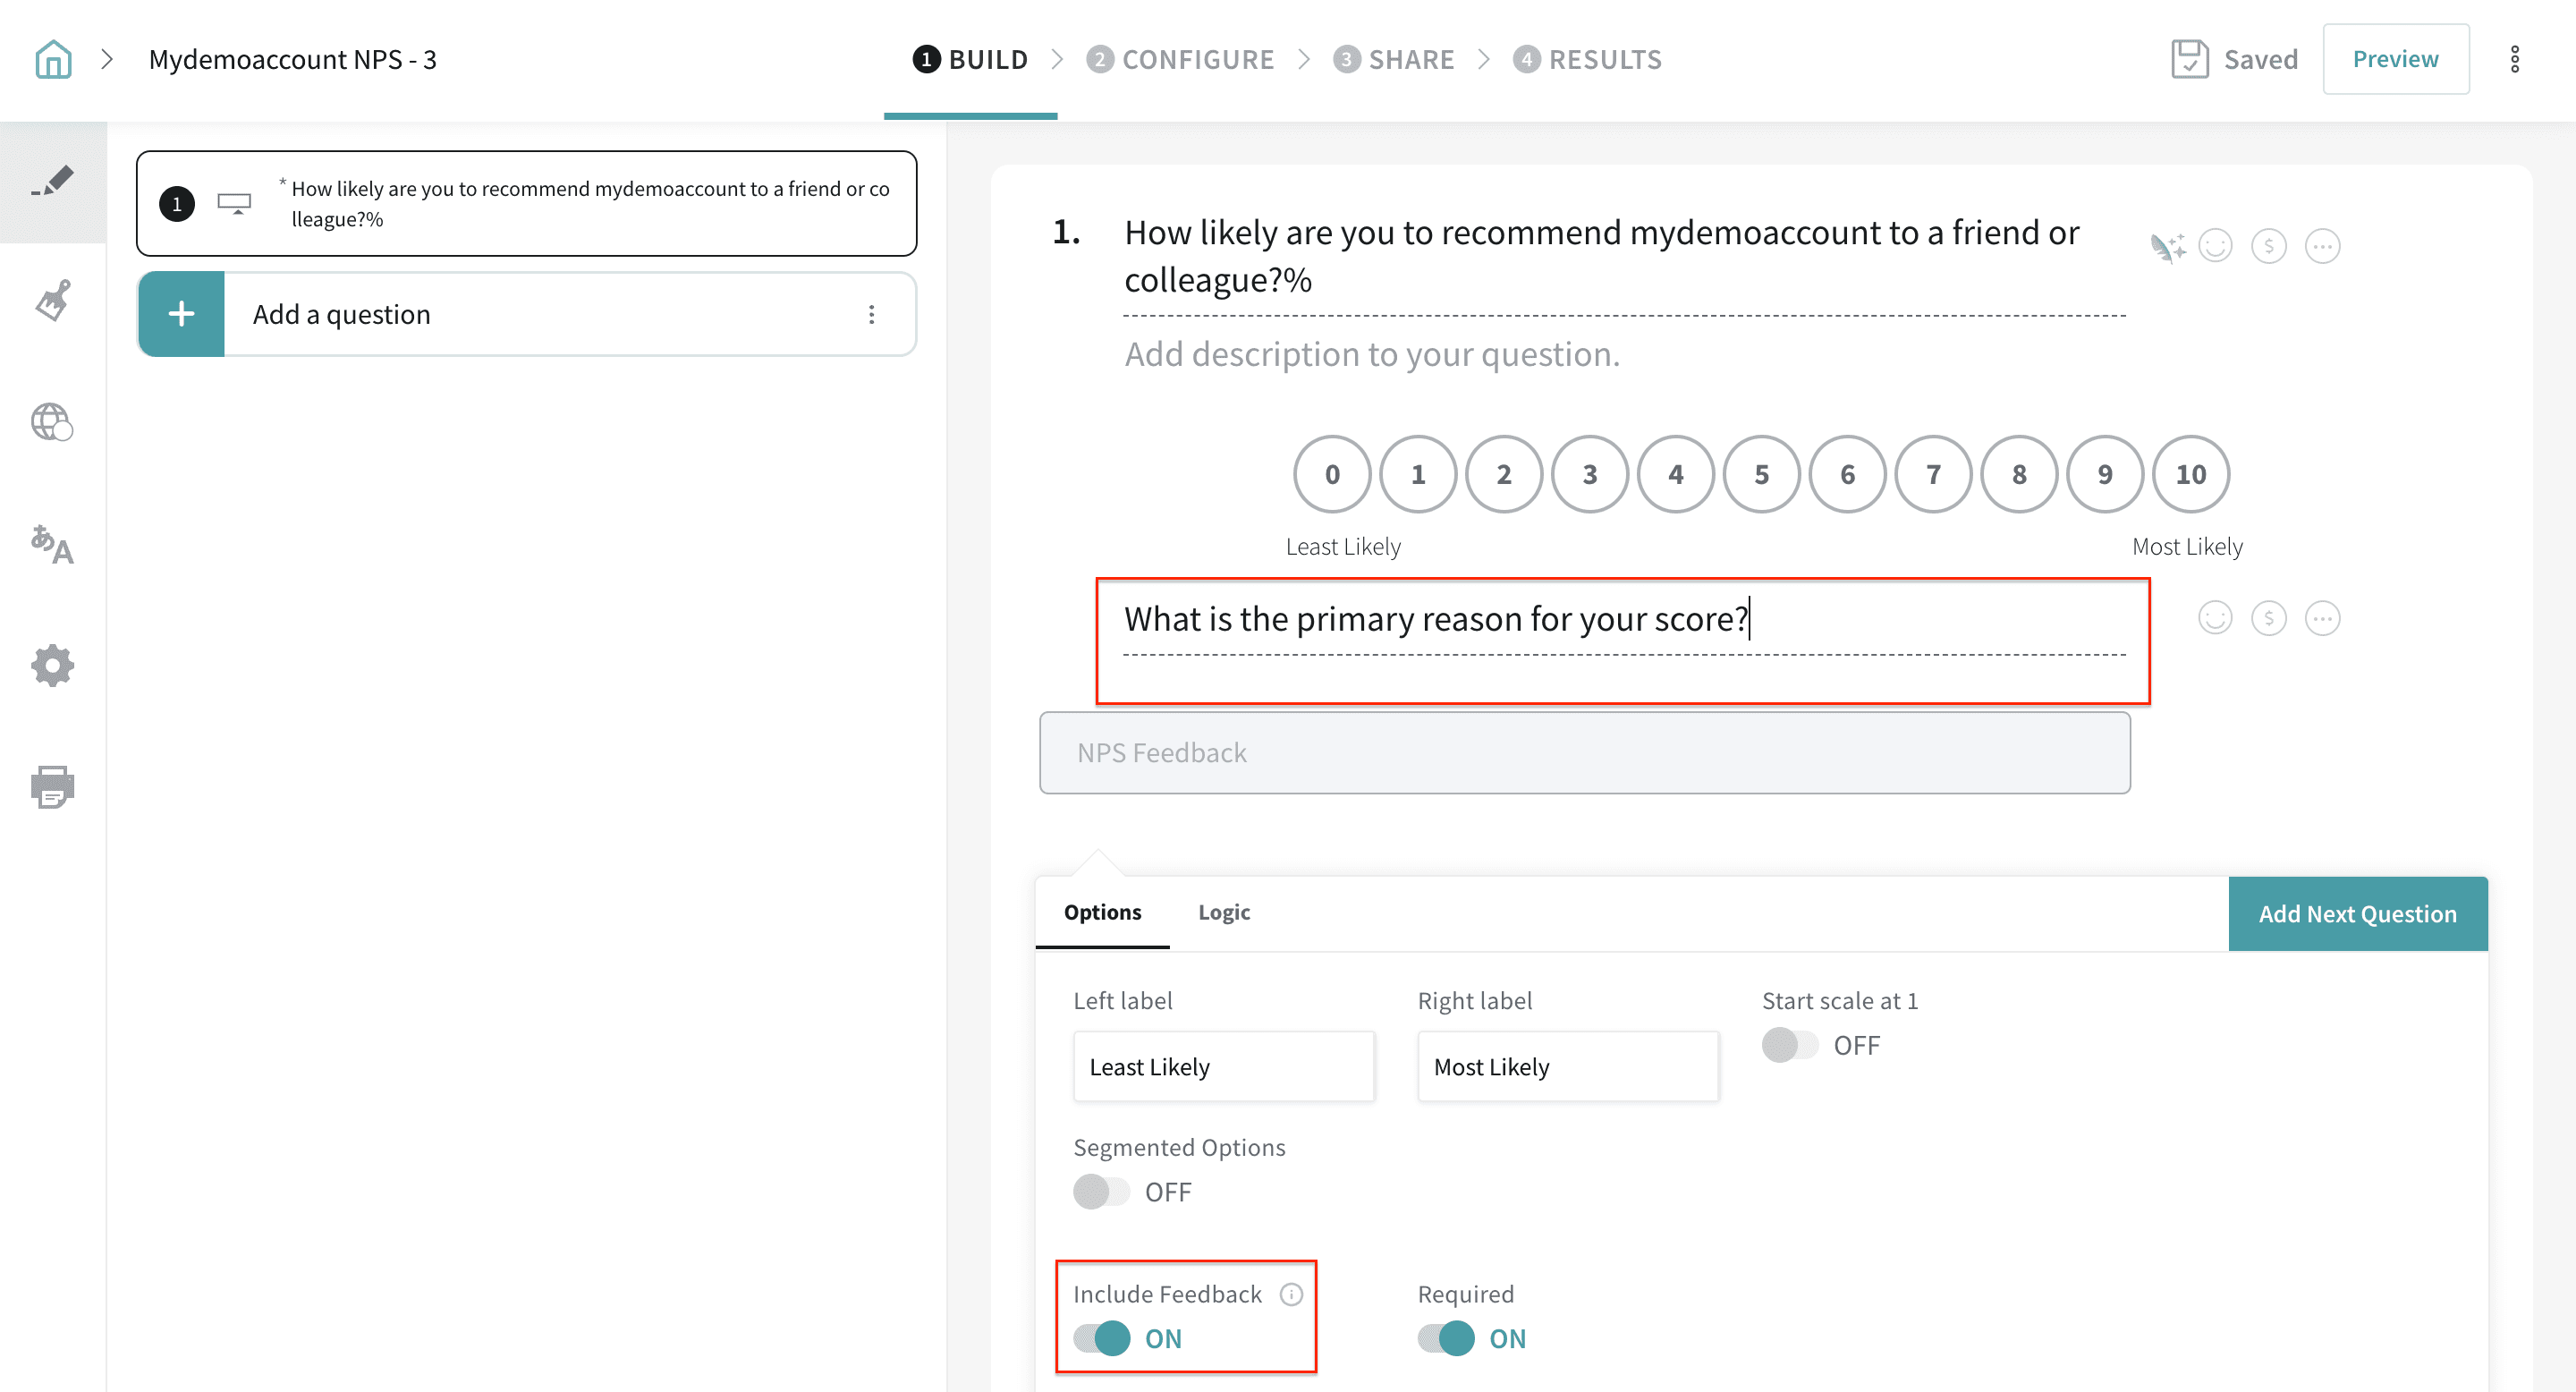
5. Enable the Question Text by Rating option to send separate follow-up questions to Promoters, Passives, and Detractors.
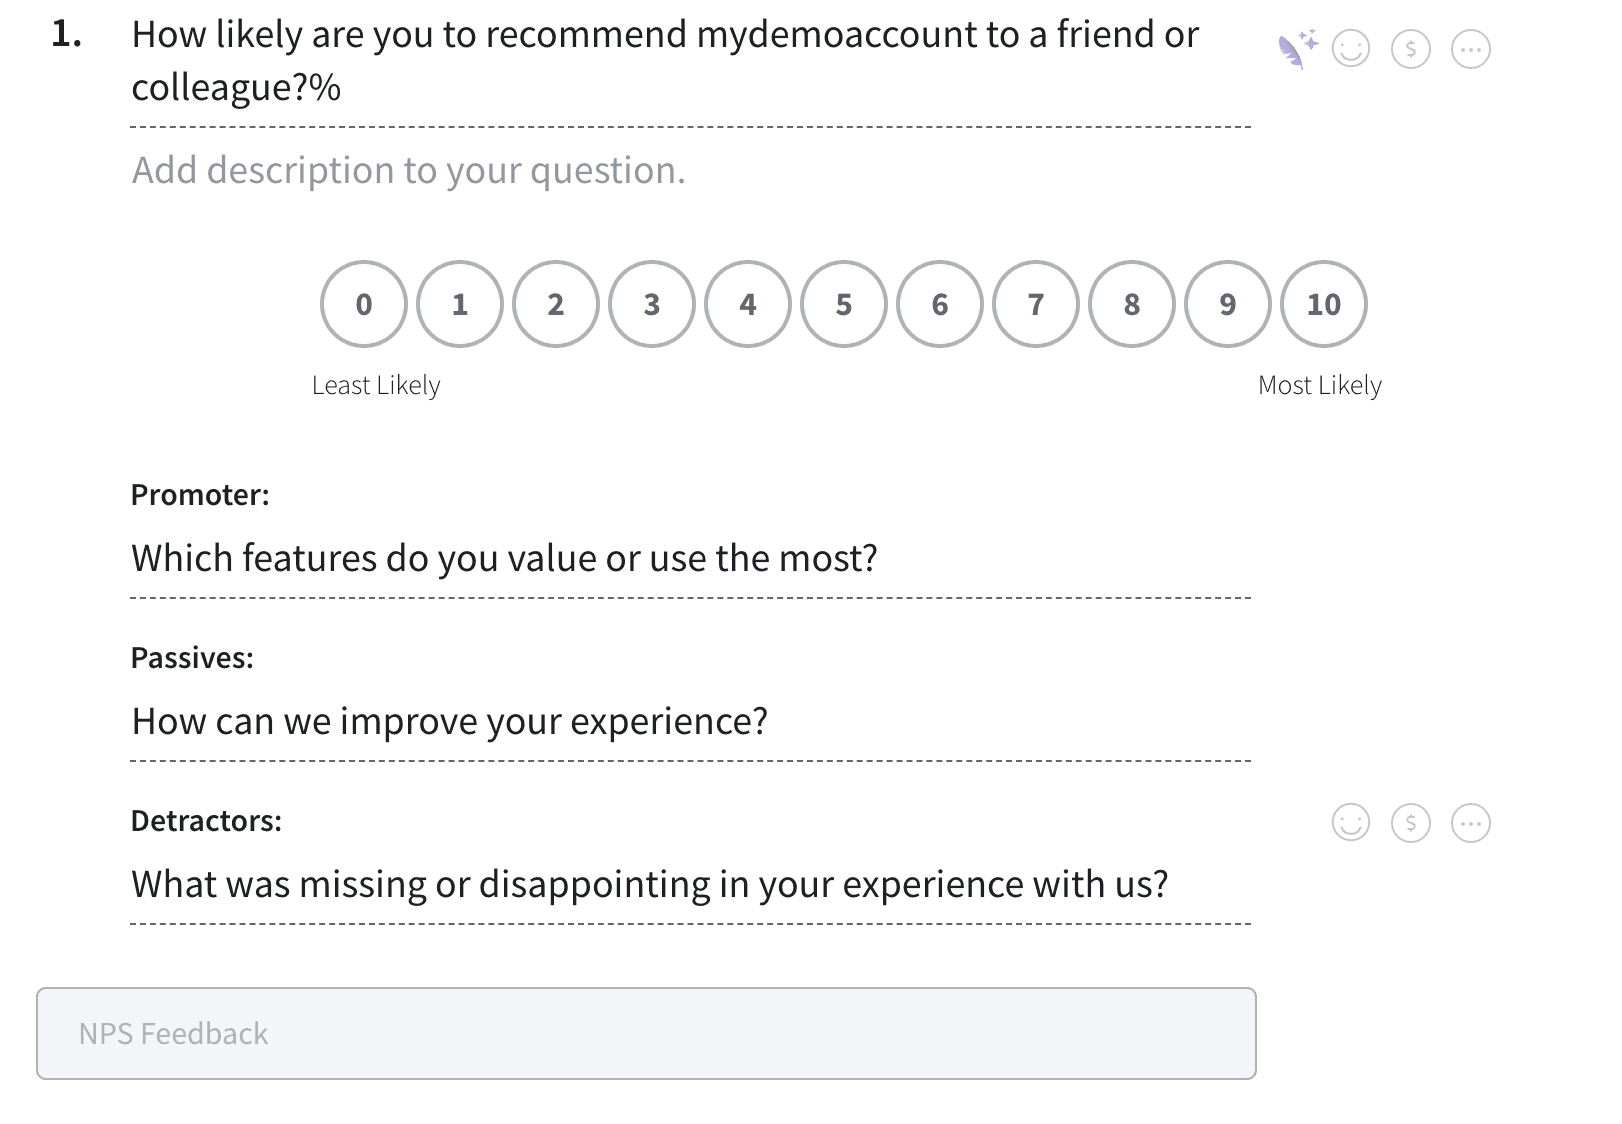
6. Click + Add New to add more follow-up questions to your survey. You can have your pick from Multiple Choice, Rating, and Text question types.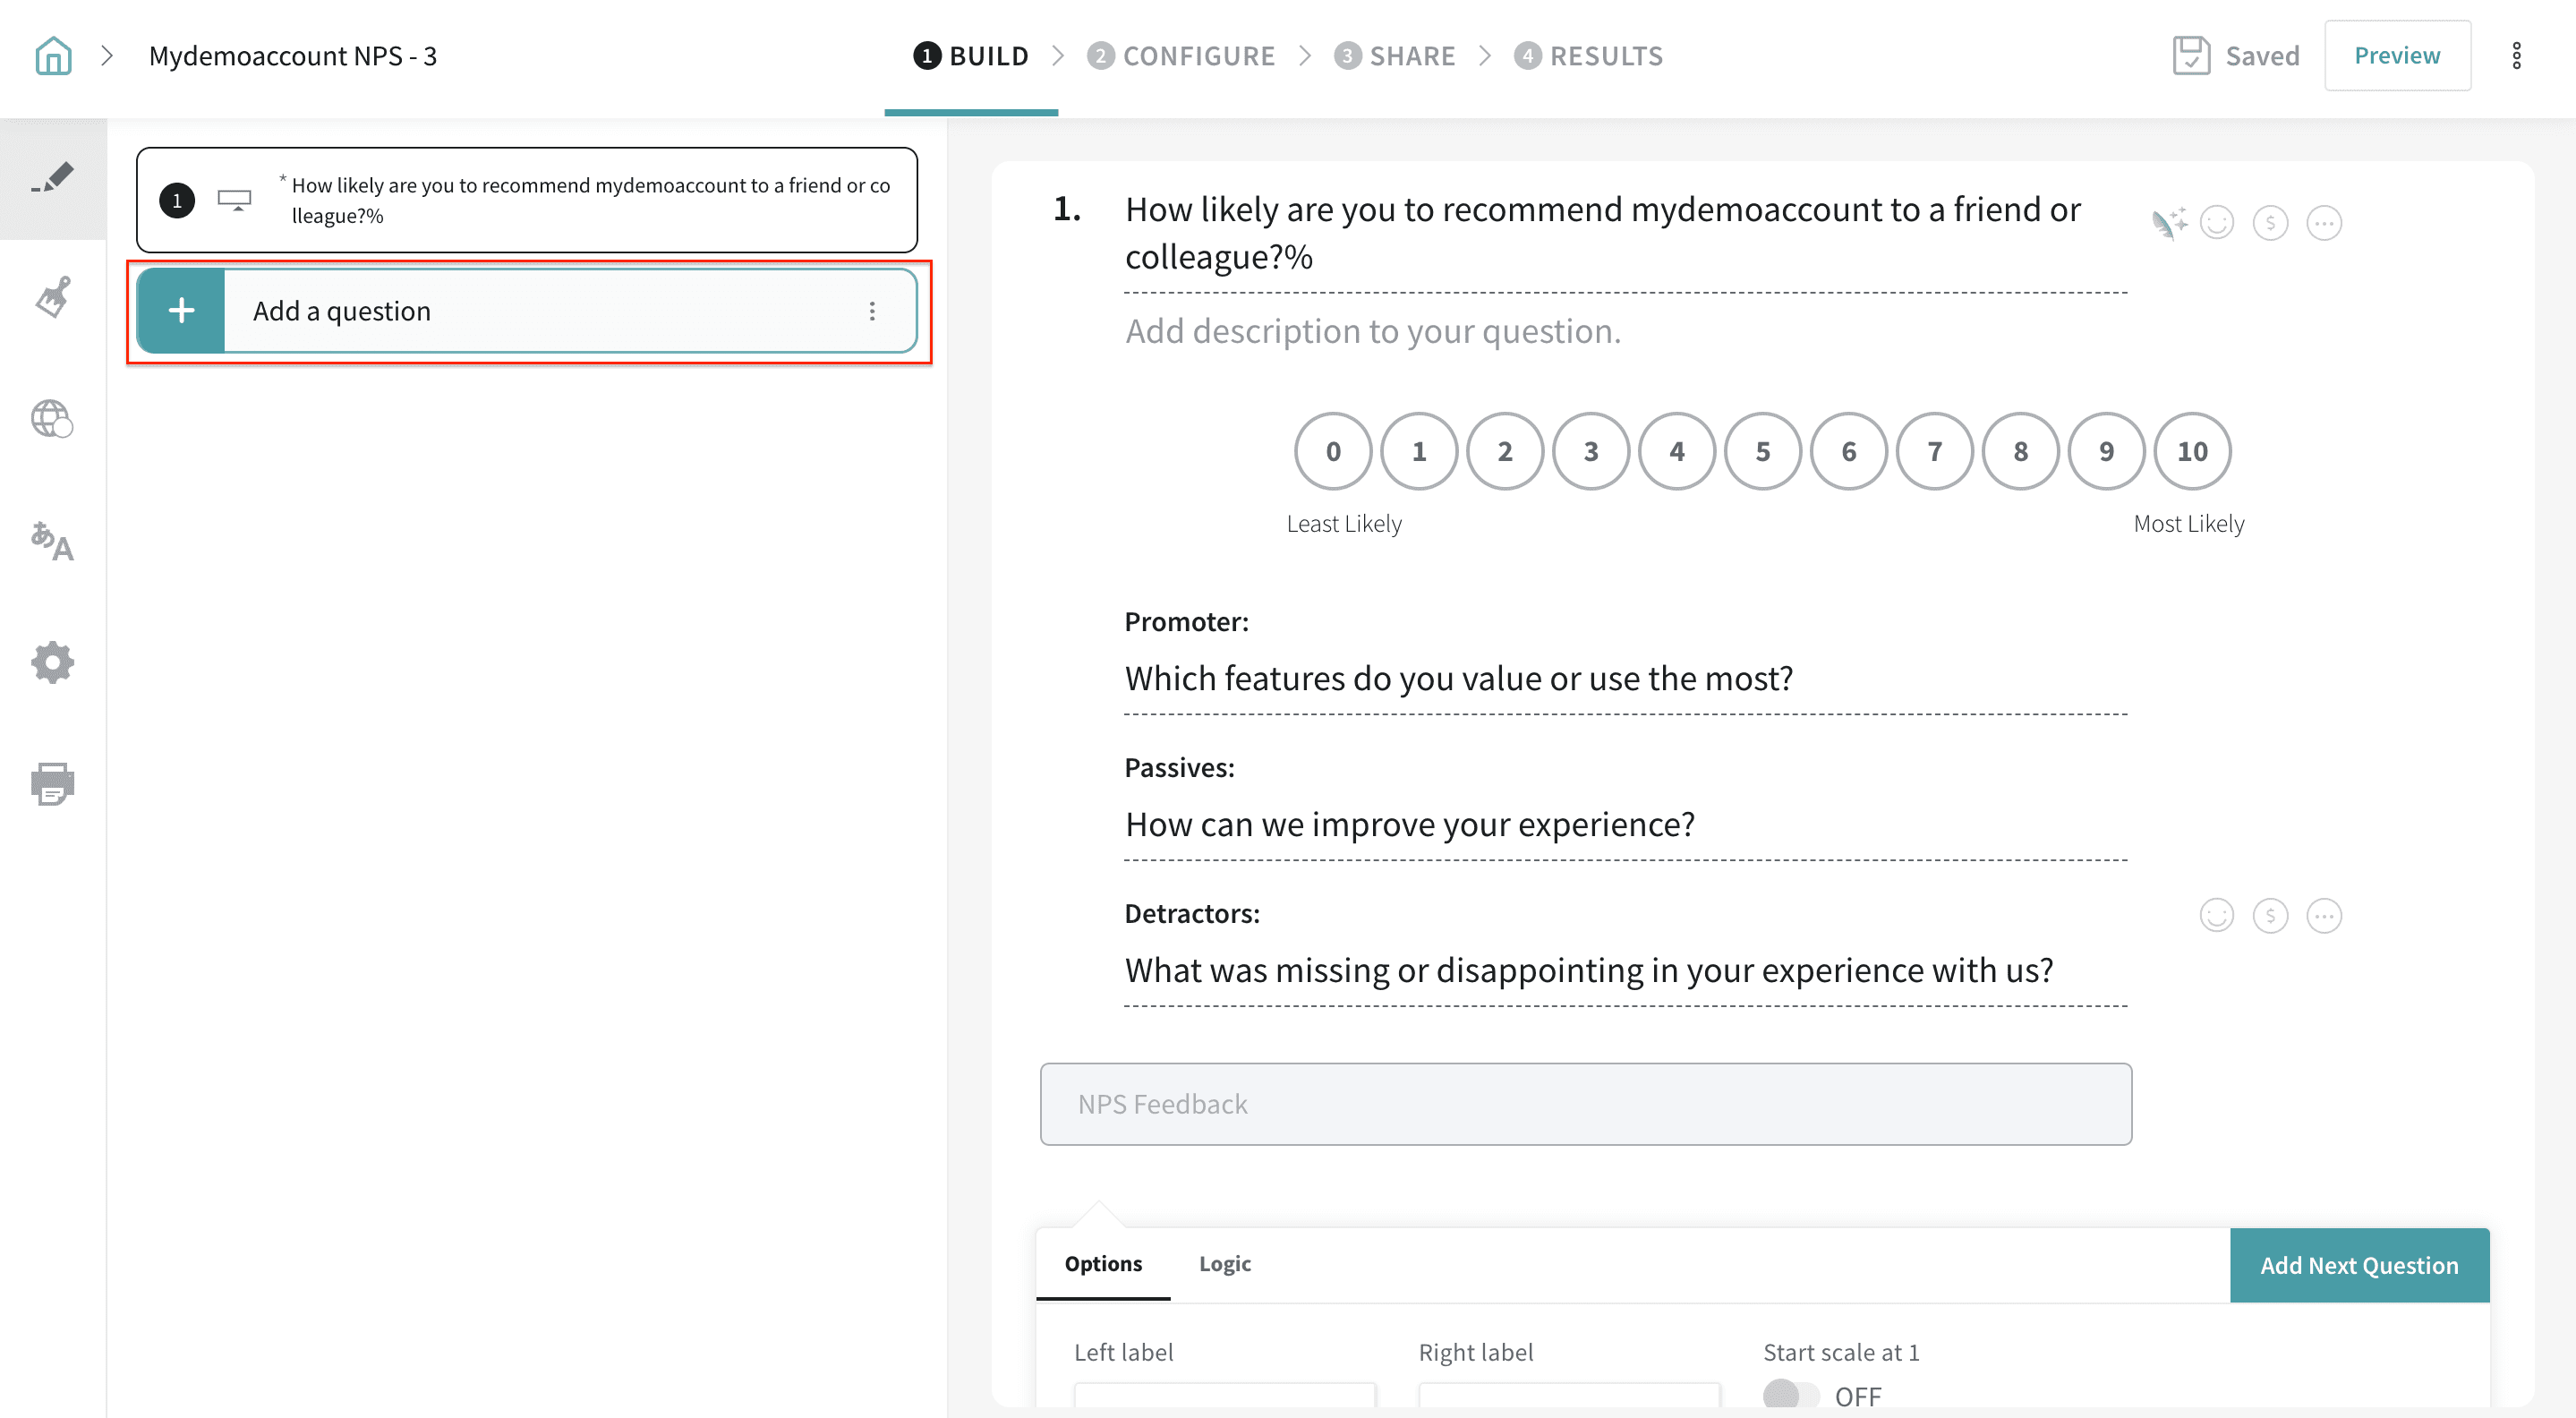
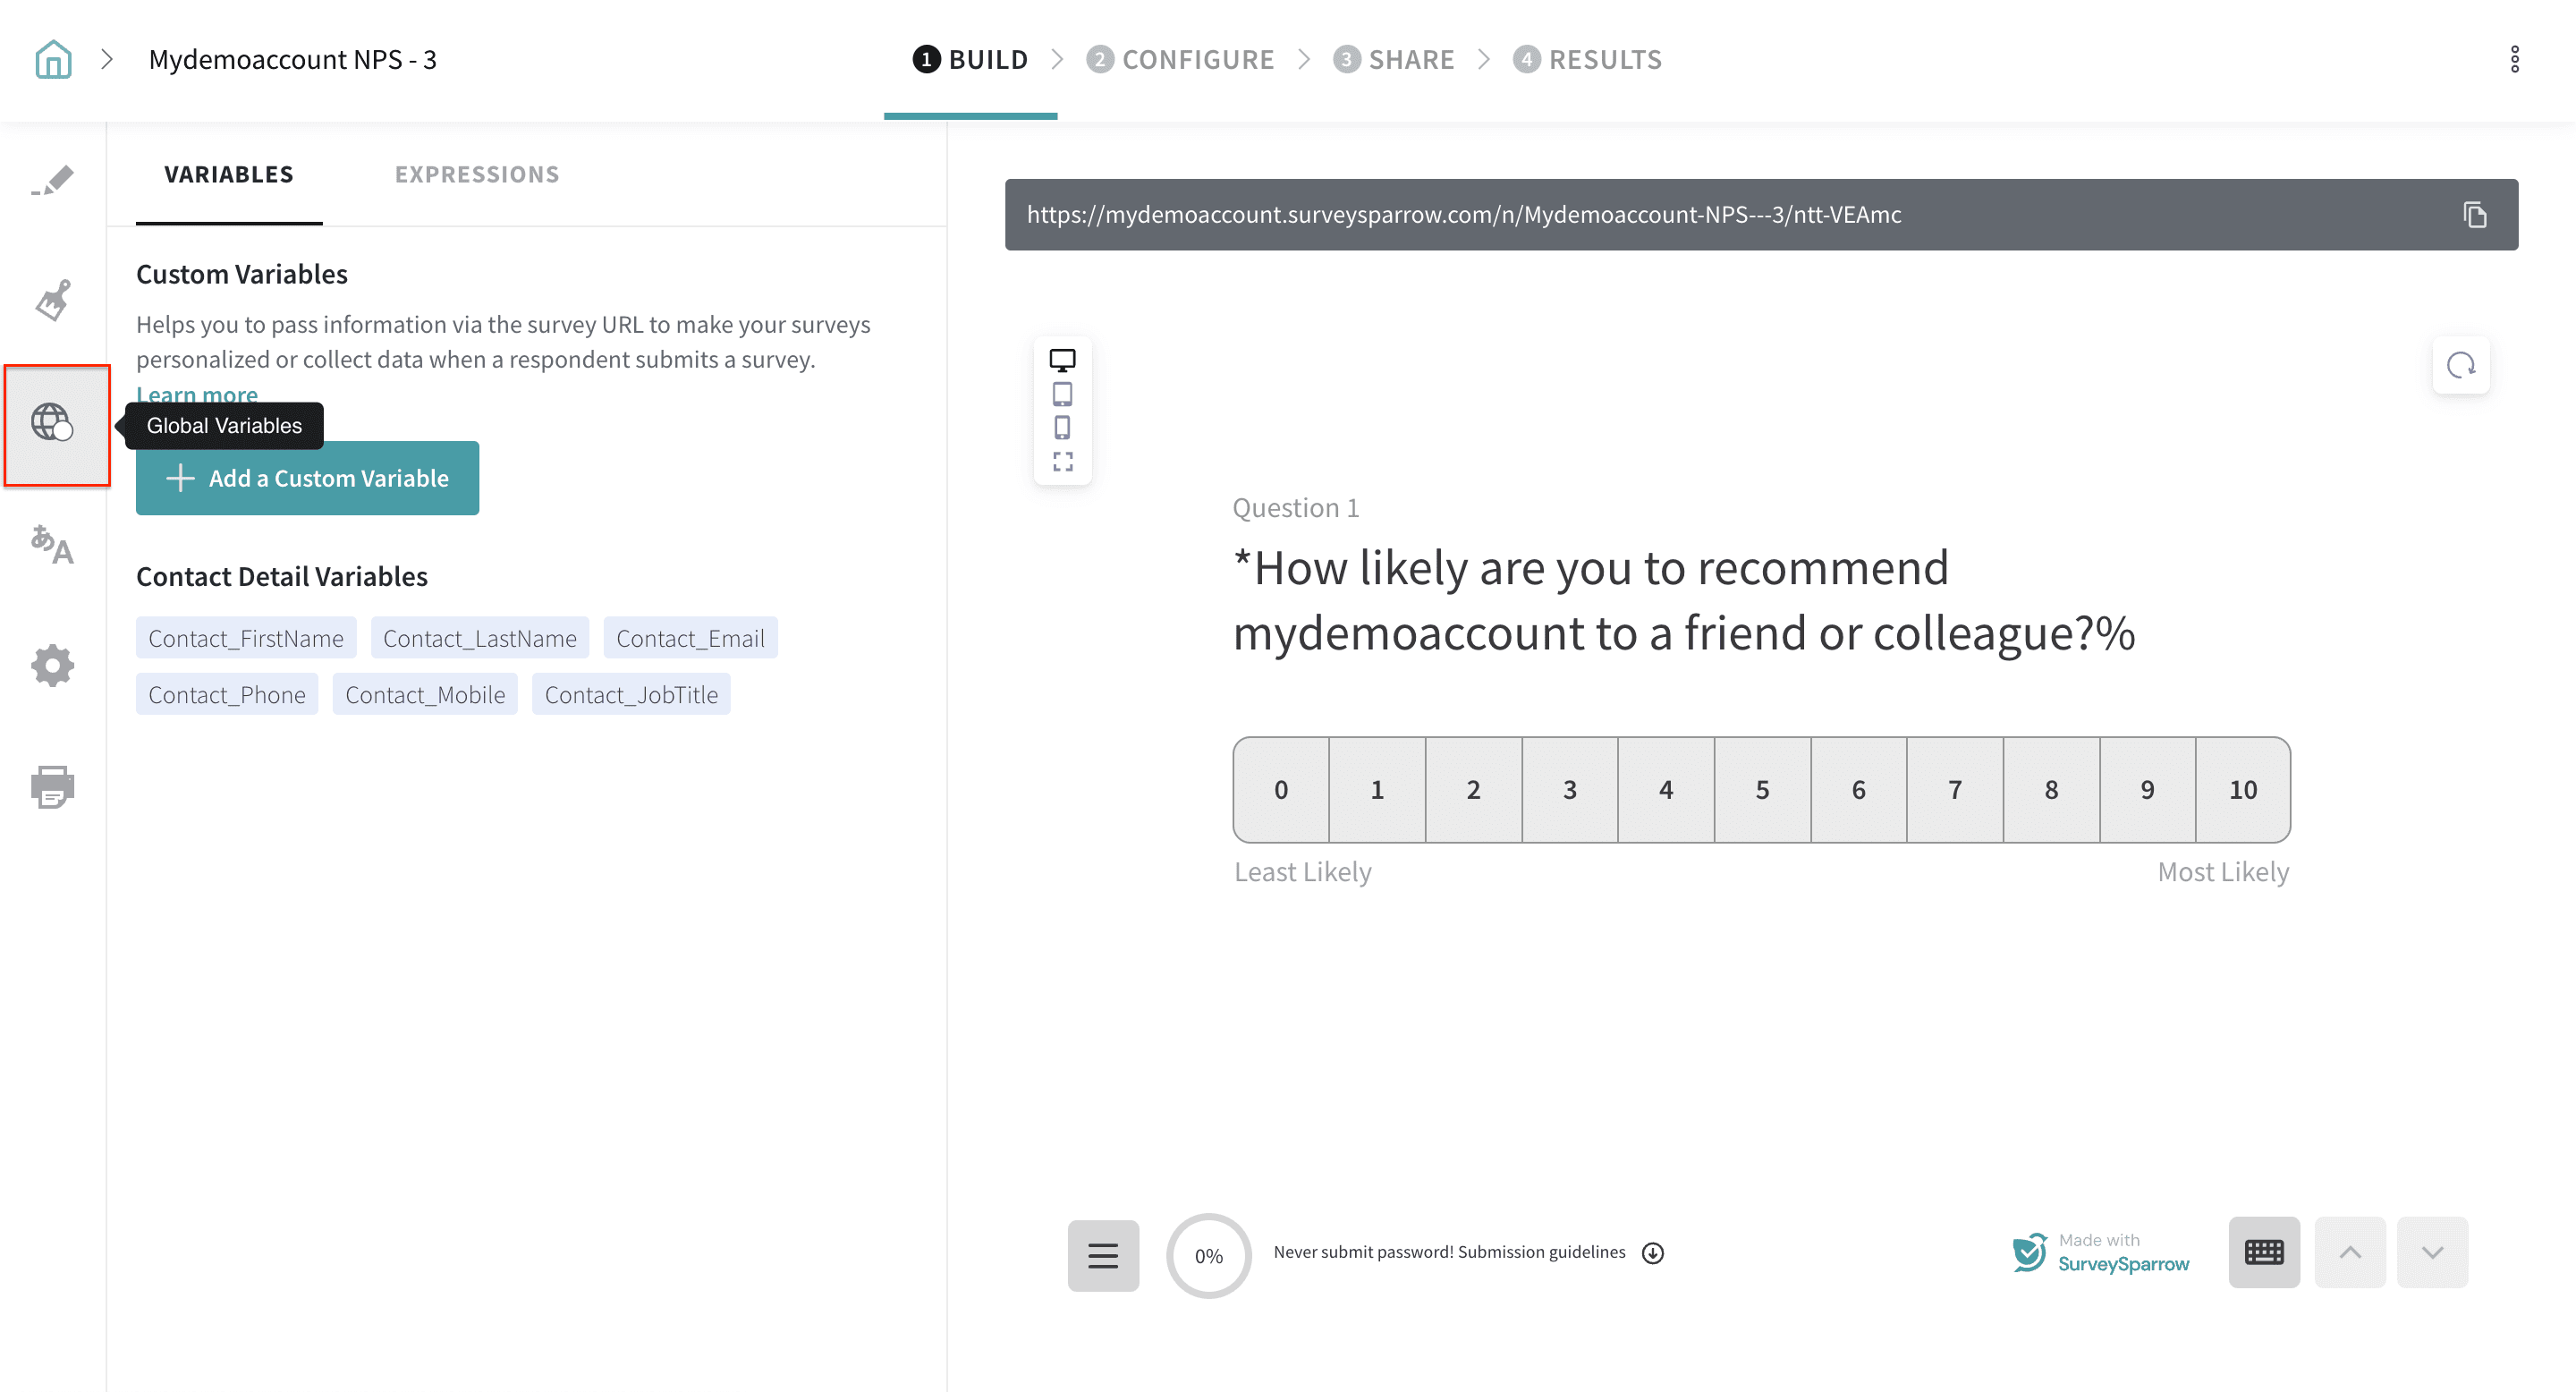
7. Click the Globe icon on the left navigation bar of your survey if you wish to create custom variables and expressions.
8. Add a Thank You page to your survey and personalize using custom variables or contact details, if you’d like.
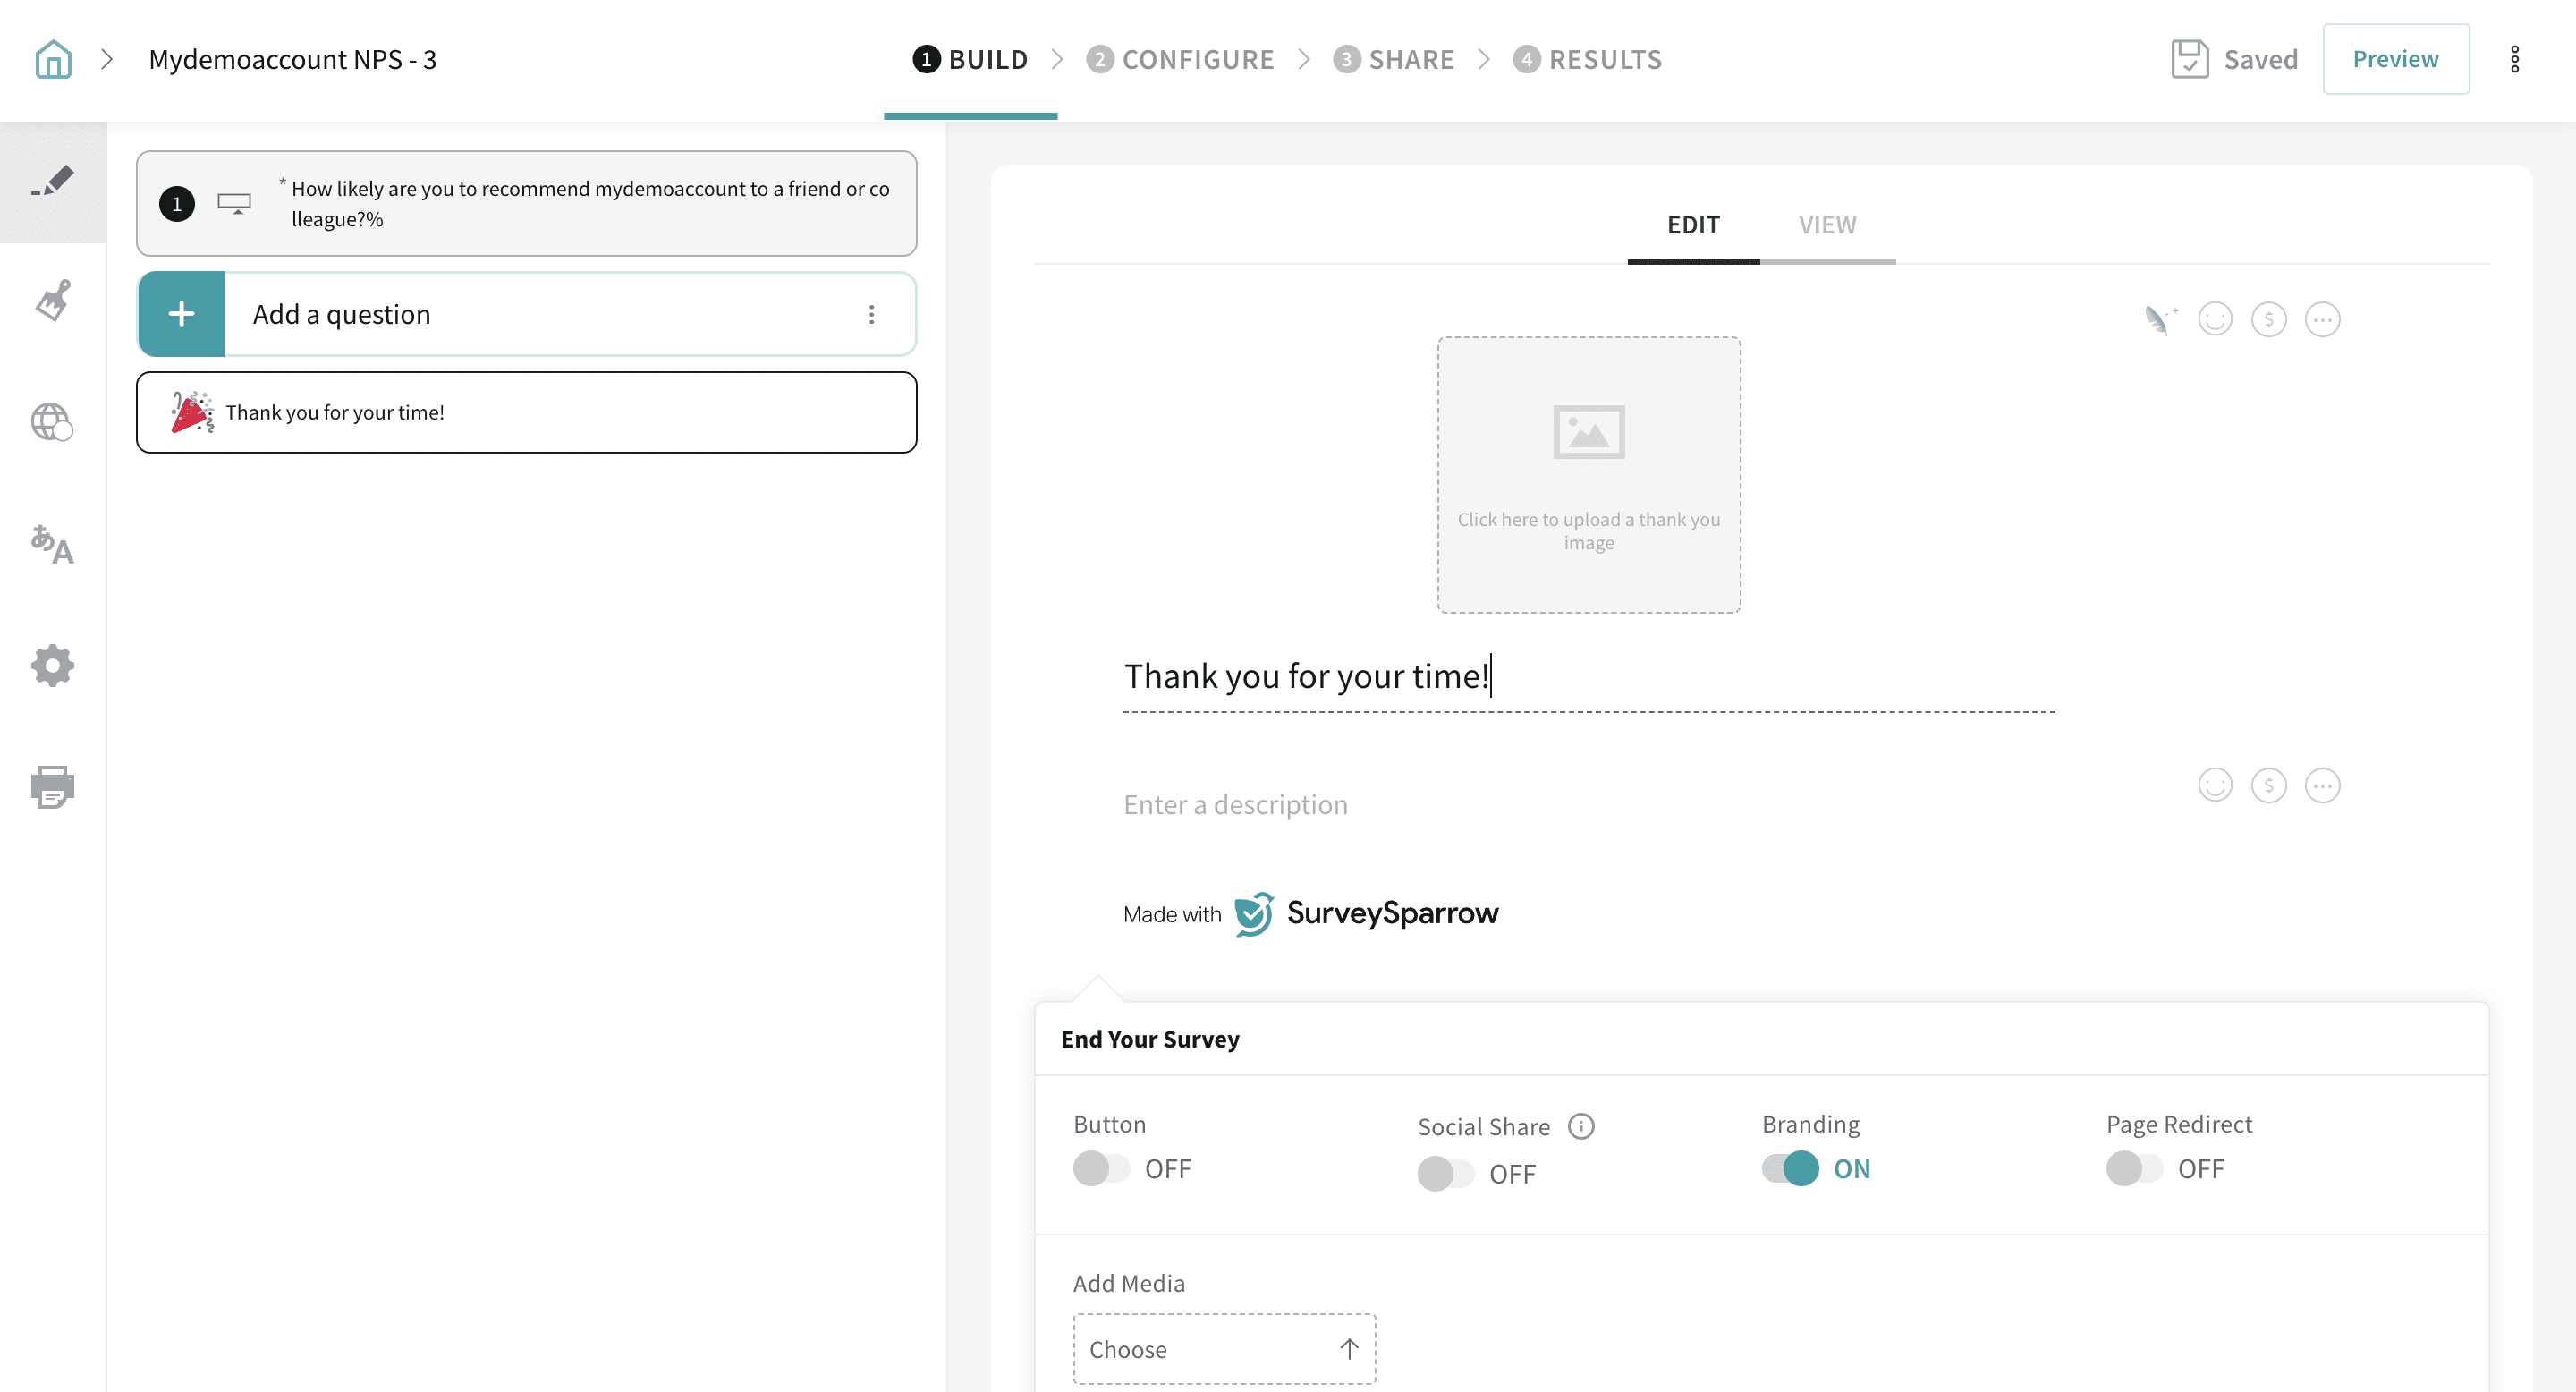
You have now successfully created your NPS survey!
9. Share your survey with your customers. Once all the responses are populated, head to the Results section of your survey and select the Overview tab. You’ll see your NPS score at the top.
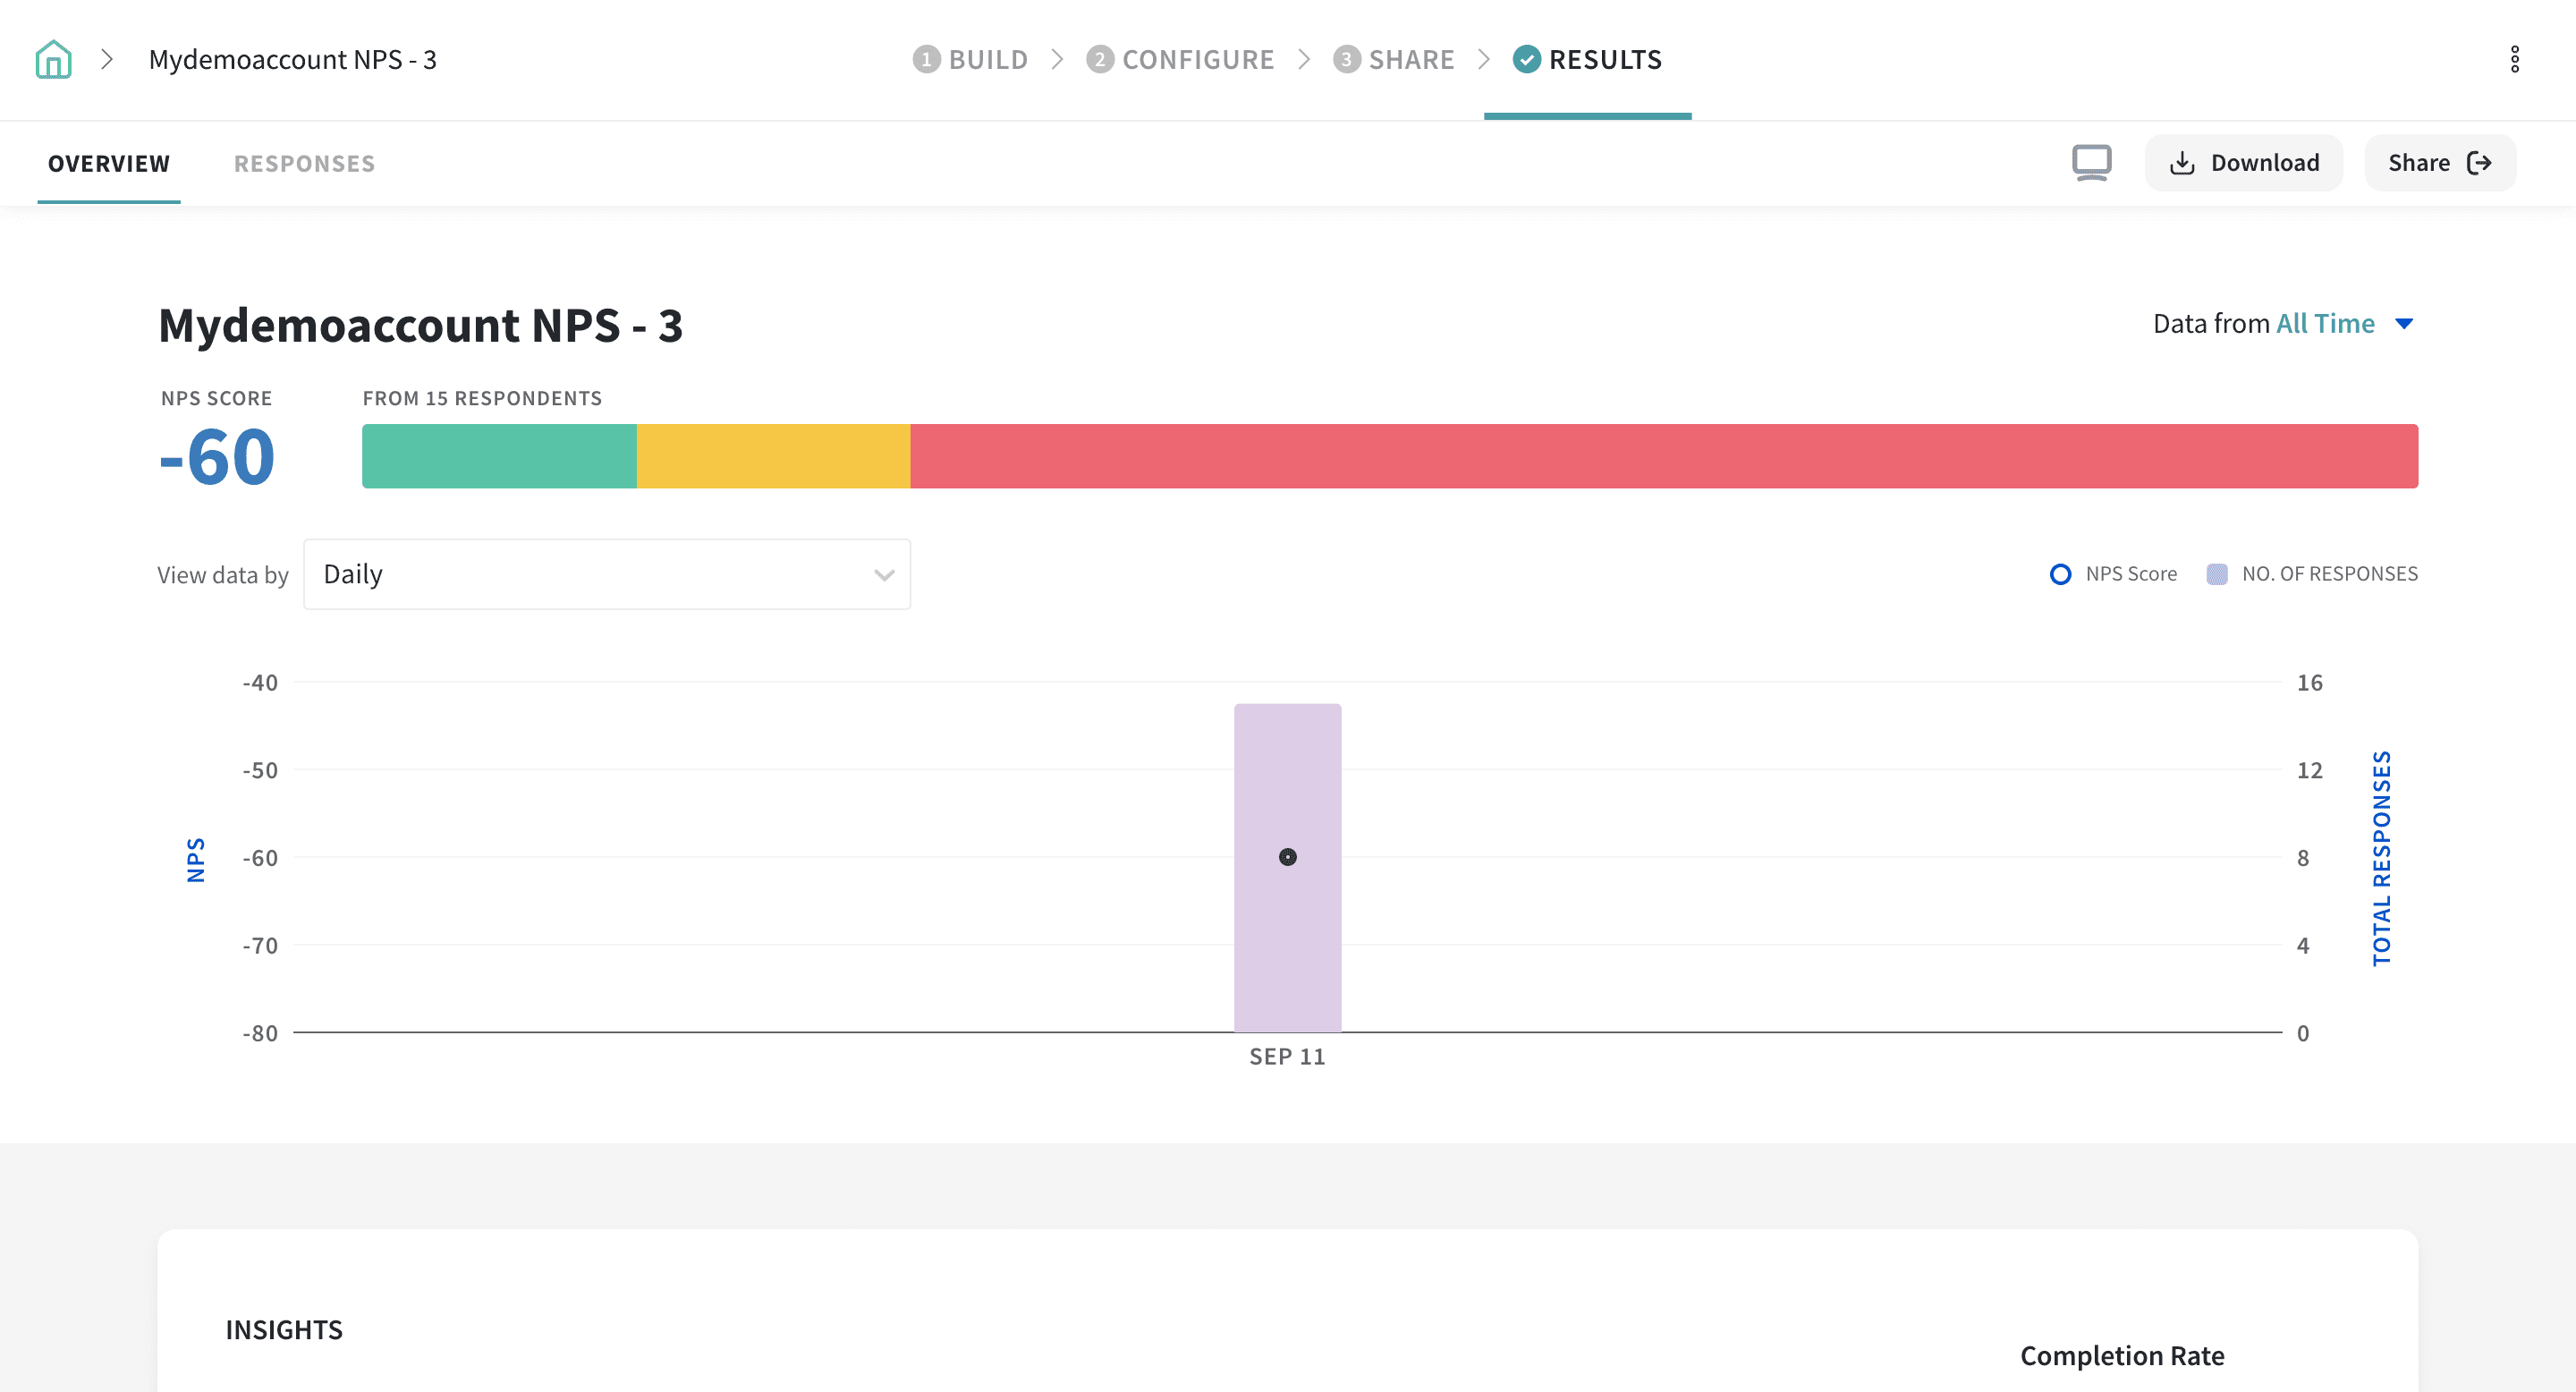
After collecting all responses for your NPS survey, an NPS feedback tool with an in-built reporting module will come super useful for receiving valuable insights on customer feedback.
Let’s see how we can carry out an in-depth analysis of NPS scores and feedback using SurveySparrow:
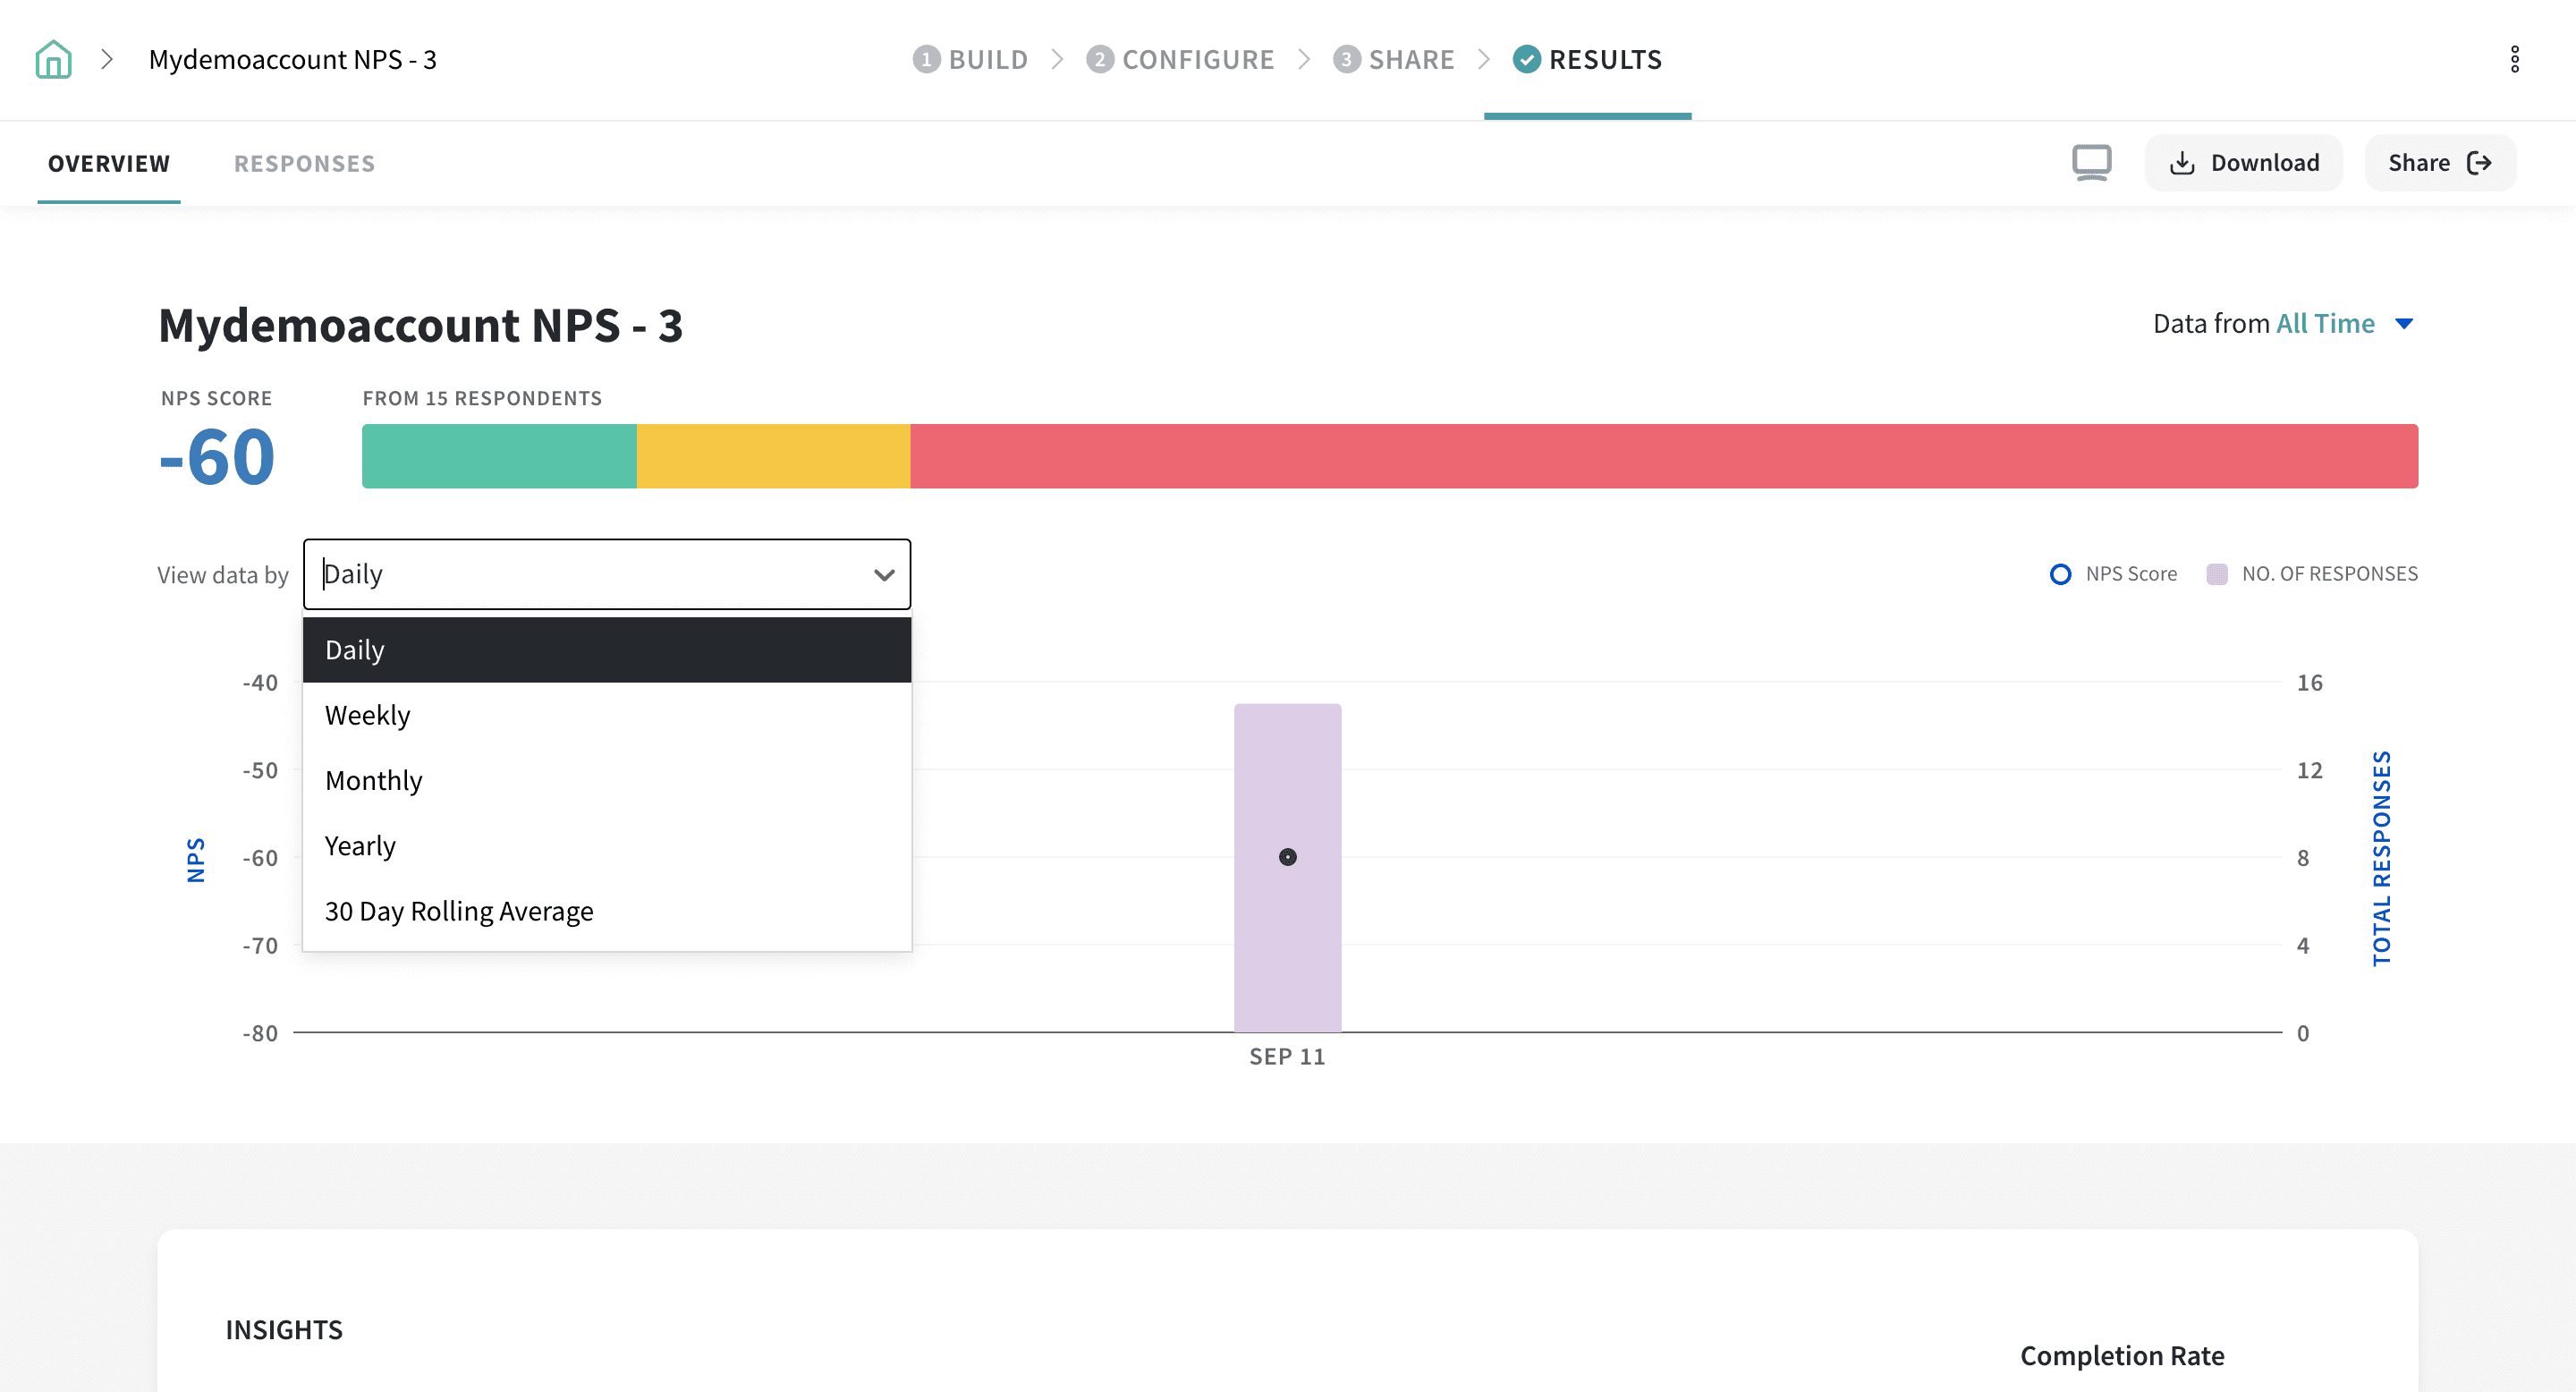
1. In the Results section of your survey, under Overview, you’ll see a trend of NPS responses over time. You can adjust the trend to show responses daily, weekly, monthly, yearly, or on a 30 day rolling average.
2. Widgets help you dissect your data better and gain deeper insights for your business. Select any of the widgets by merely clicking on the box or the Add Widgets button. The widgets we have are:
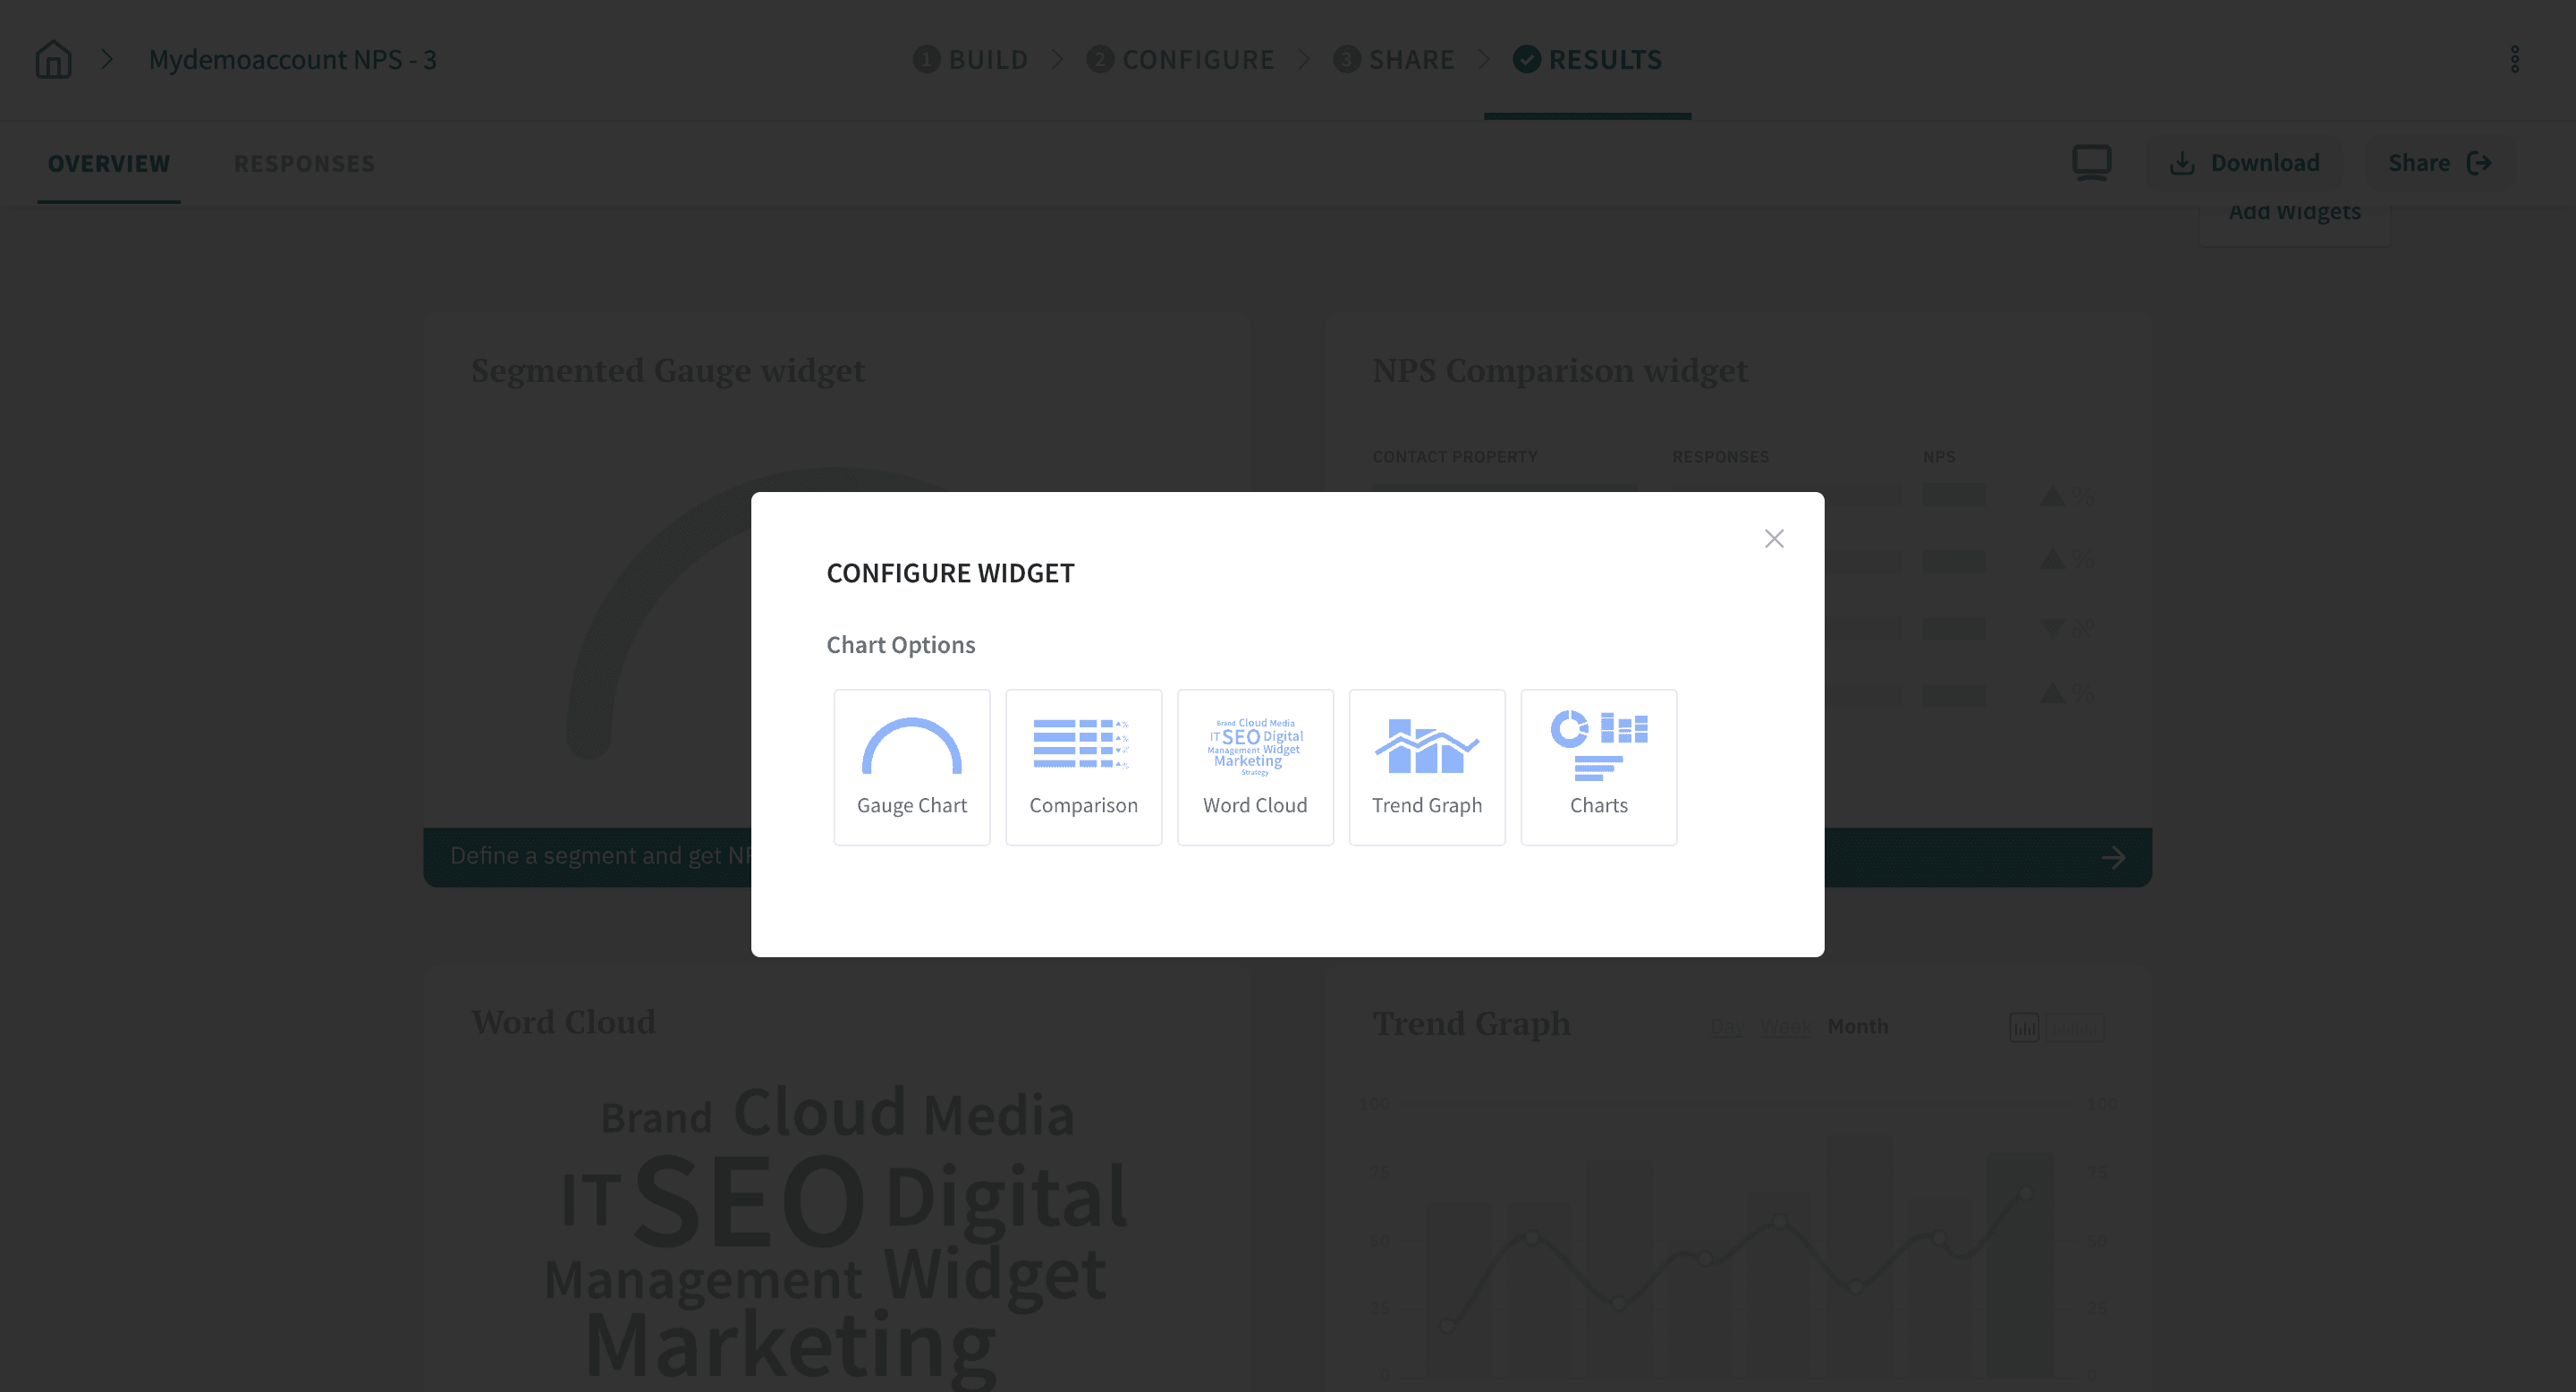
The Gauge Chart widget lets you segment your responses using filter groups and see the breakdown of promoters, passives, and detractors. You can add multiple segments to identify & track their performance.
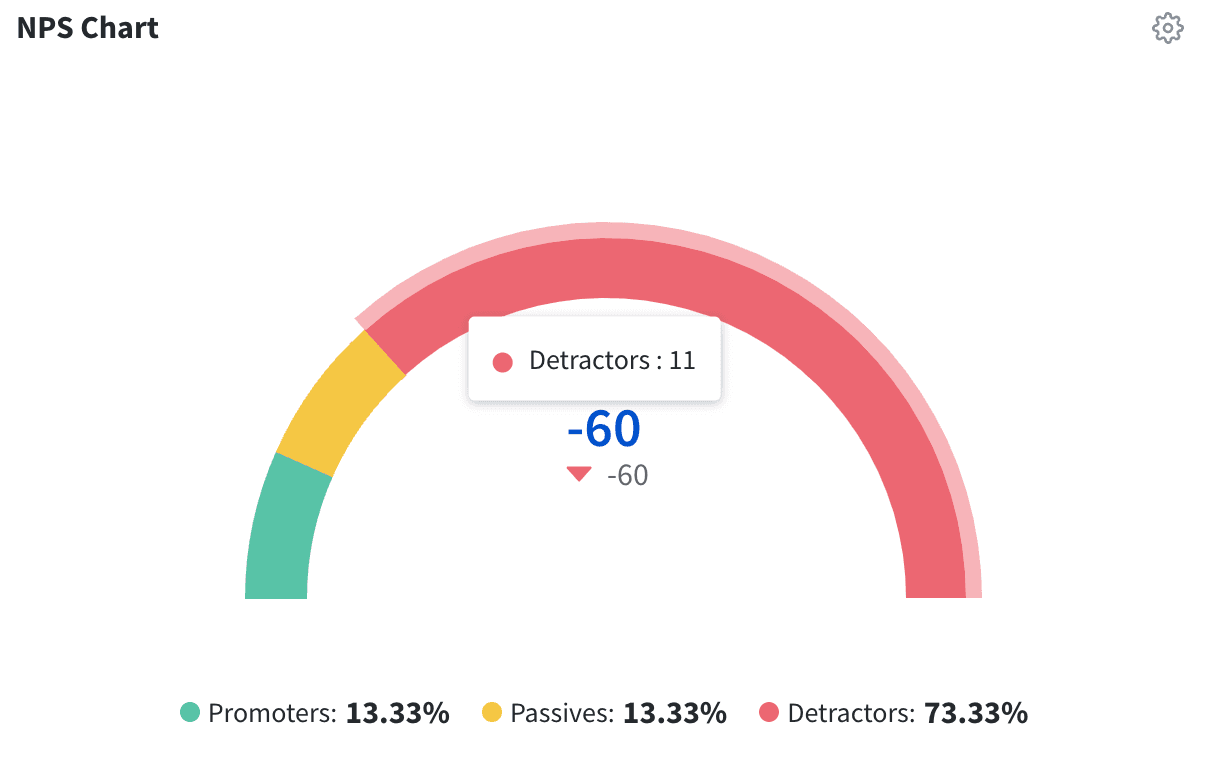
Provide a title to your Gauge Chart and add filters as per your intent. Click Create once you’ve set the conditions.
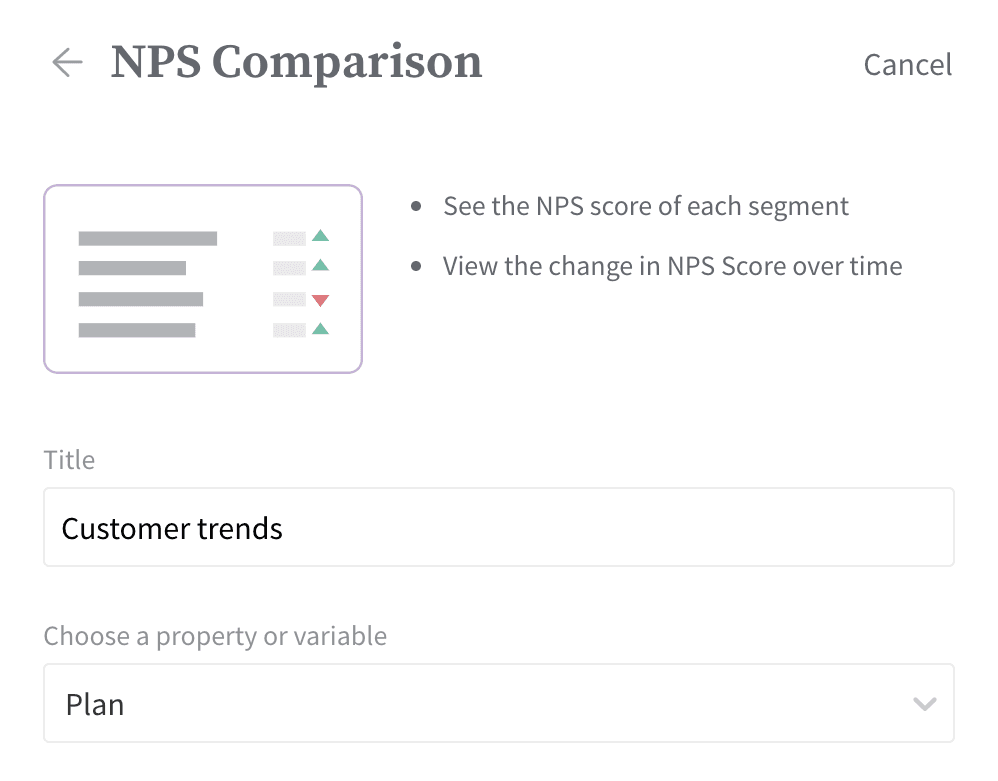
With the NPS Comparison widget, you can compare the responses provided by different segments of respondents(for example, customers under different pricing plans).
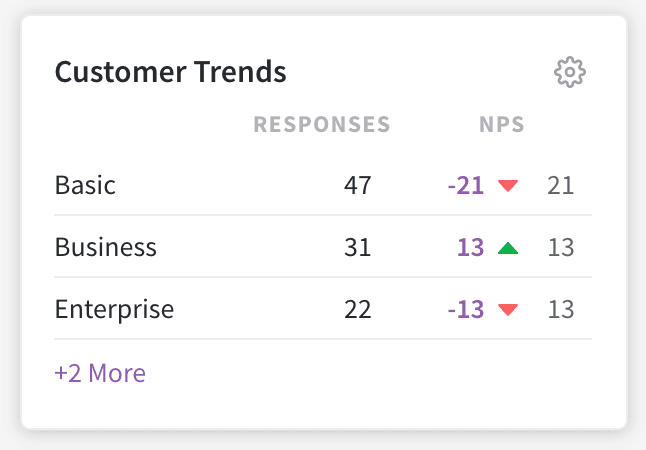
Add a title, select the contact properties or variables available, select the values you wish to compare and click Create.
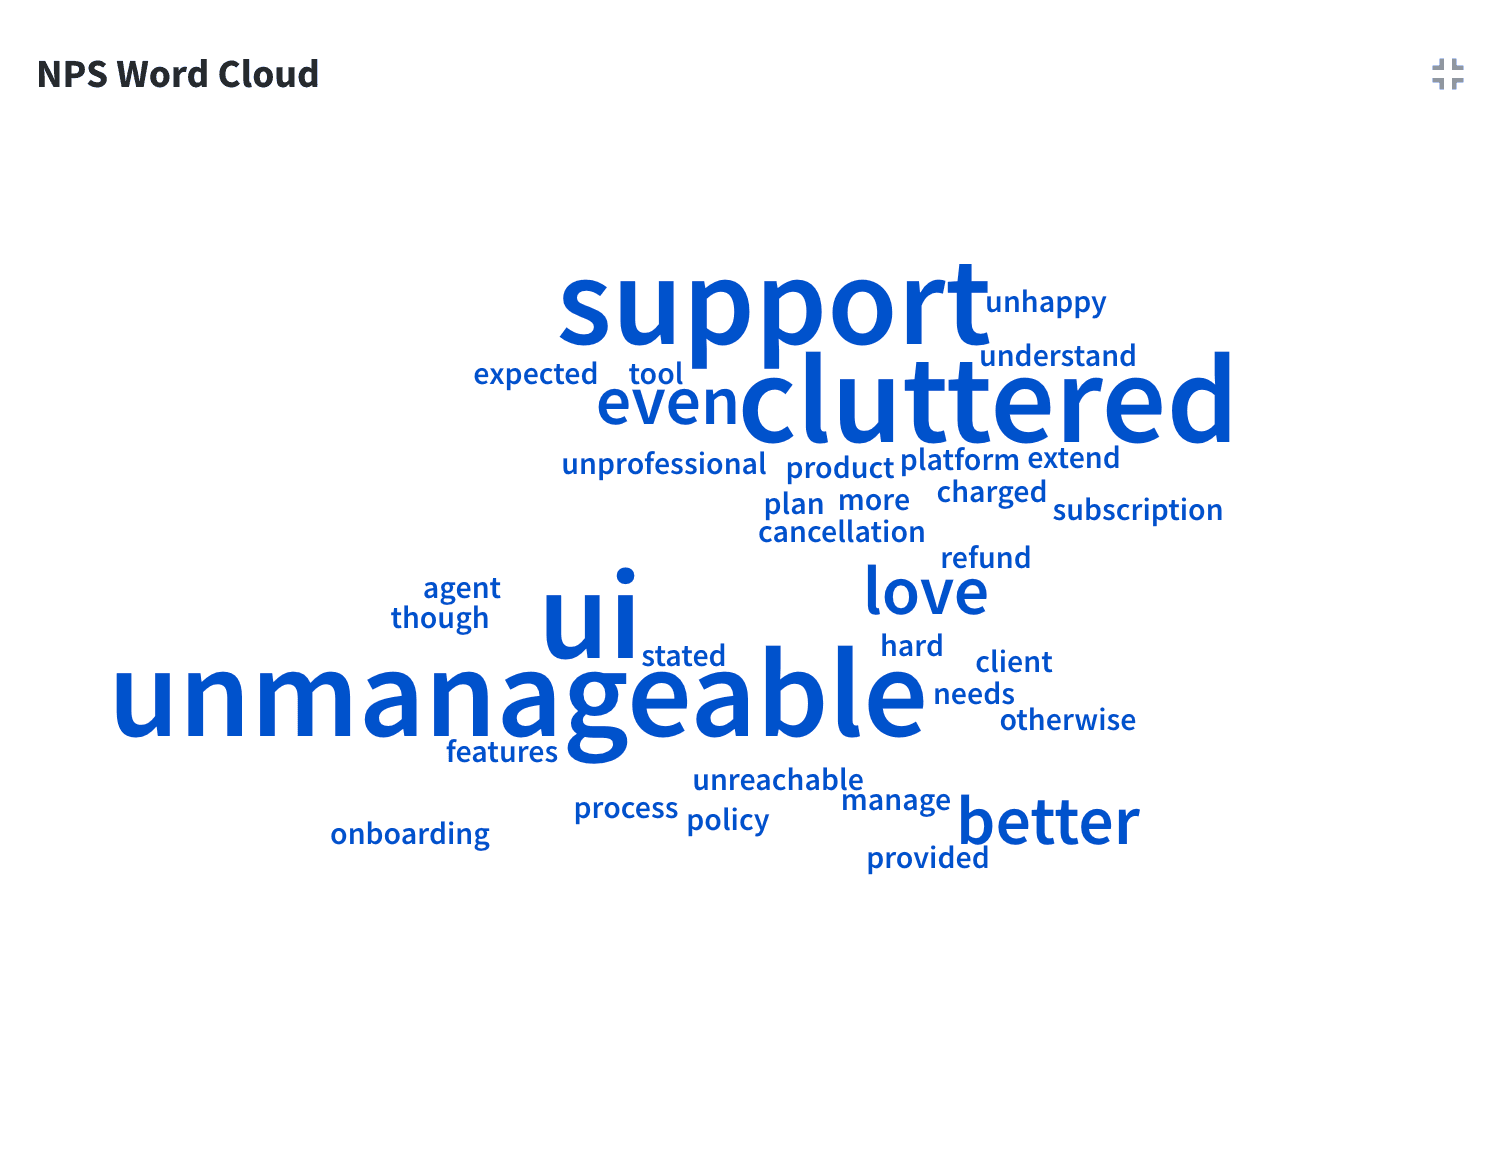
The Word Cloud widget lets you identify and view the most commonly used words in NPS responses. The word cloud is a cluster of words with the size of the words indicating how often the word appears in your collected responses.
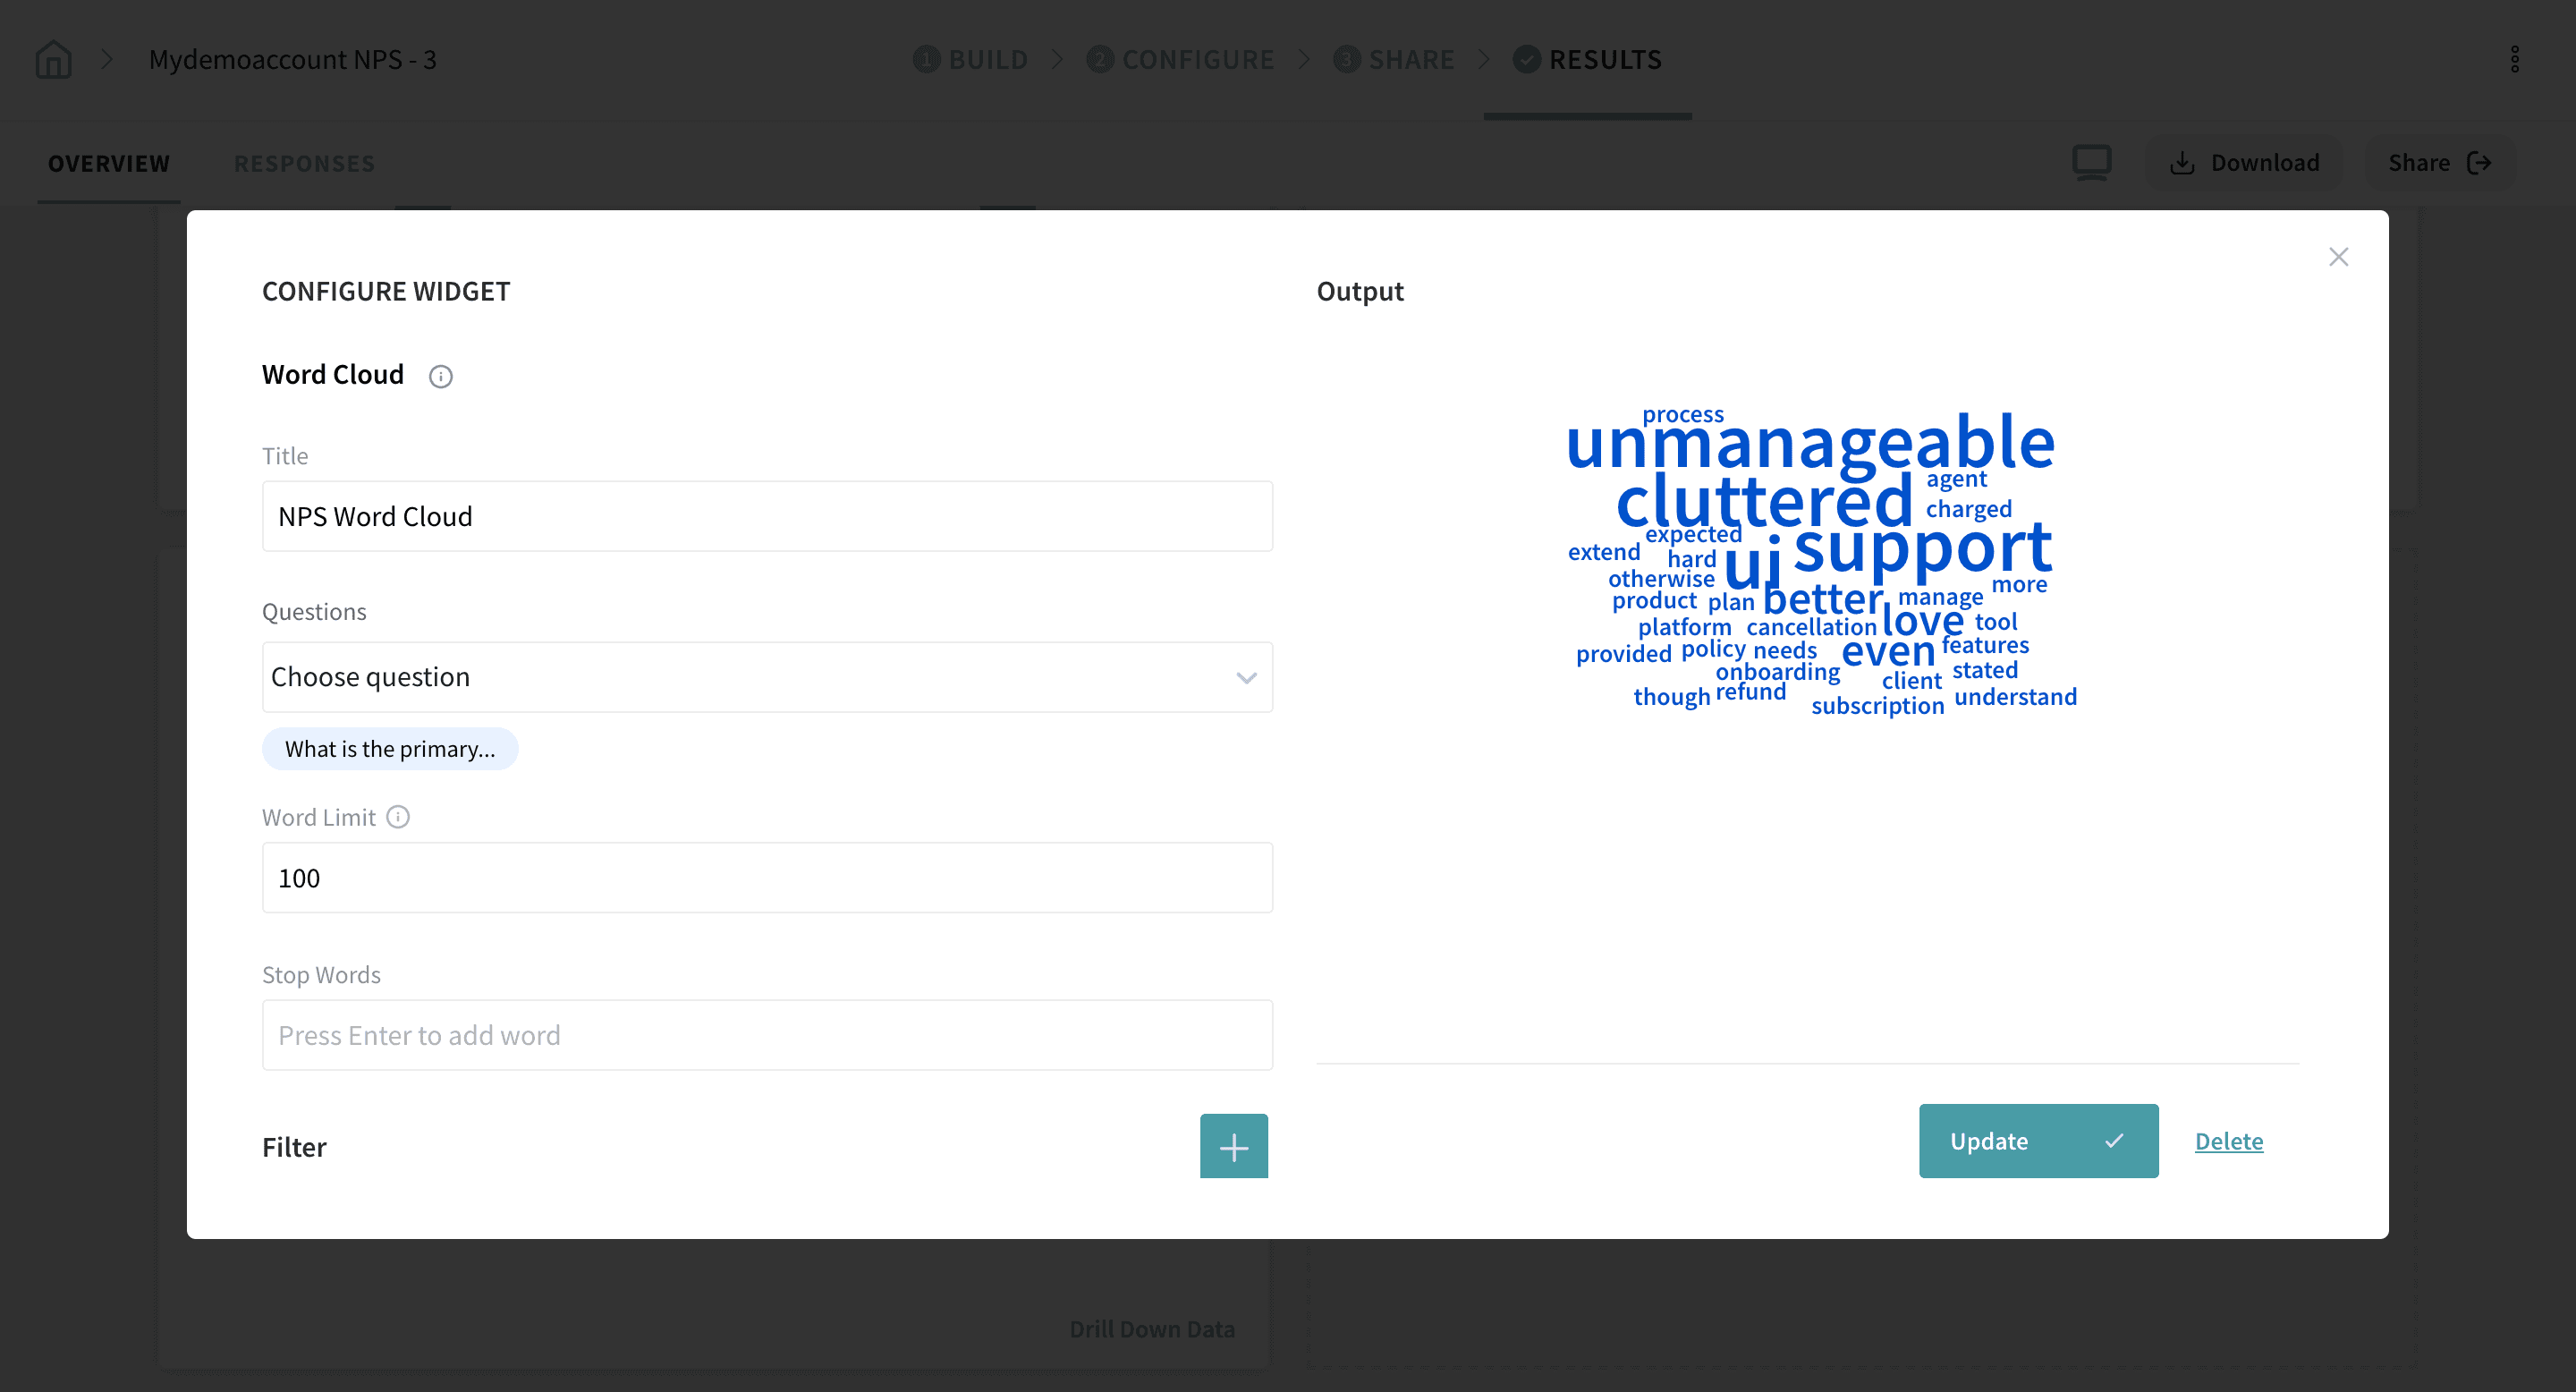
Provide a title to your widget.
1. Use the Max Words setting to determine how many words should appear in your Word Cloud. By default, this count is set to 100.
2. You can choose to filter out additional words by using the Stop Words feature. Simply add the word in the field and press enter.
3. You can also add additional filters by selecting Add Filter.
4. Click Create.
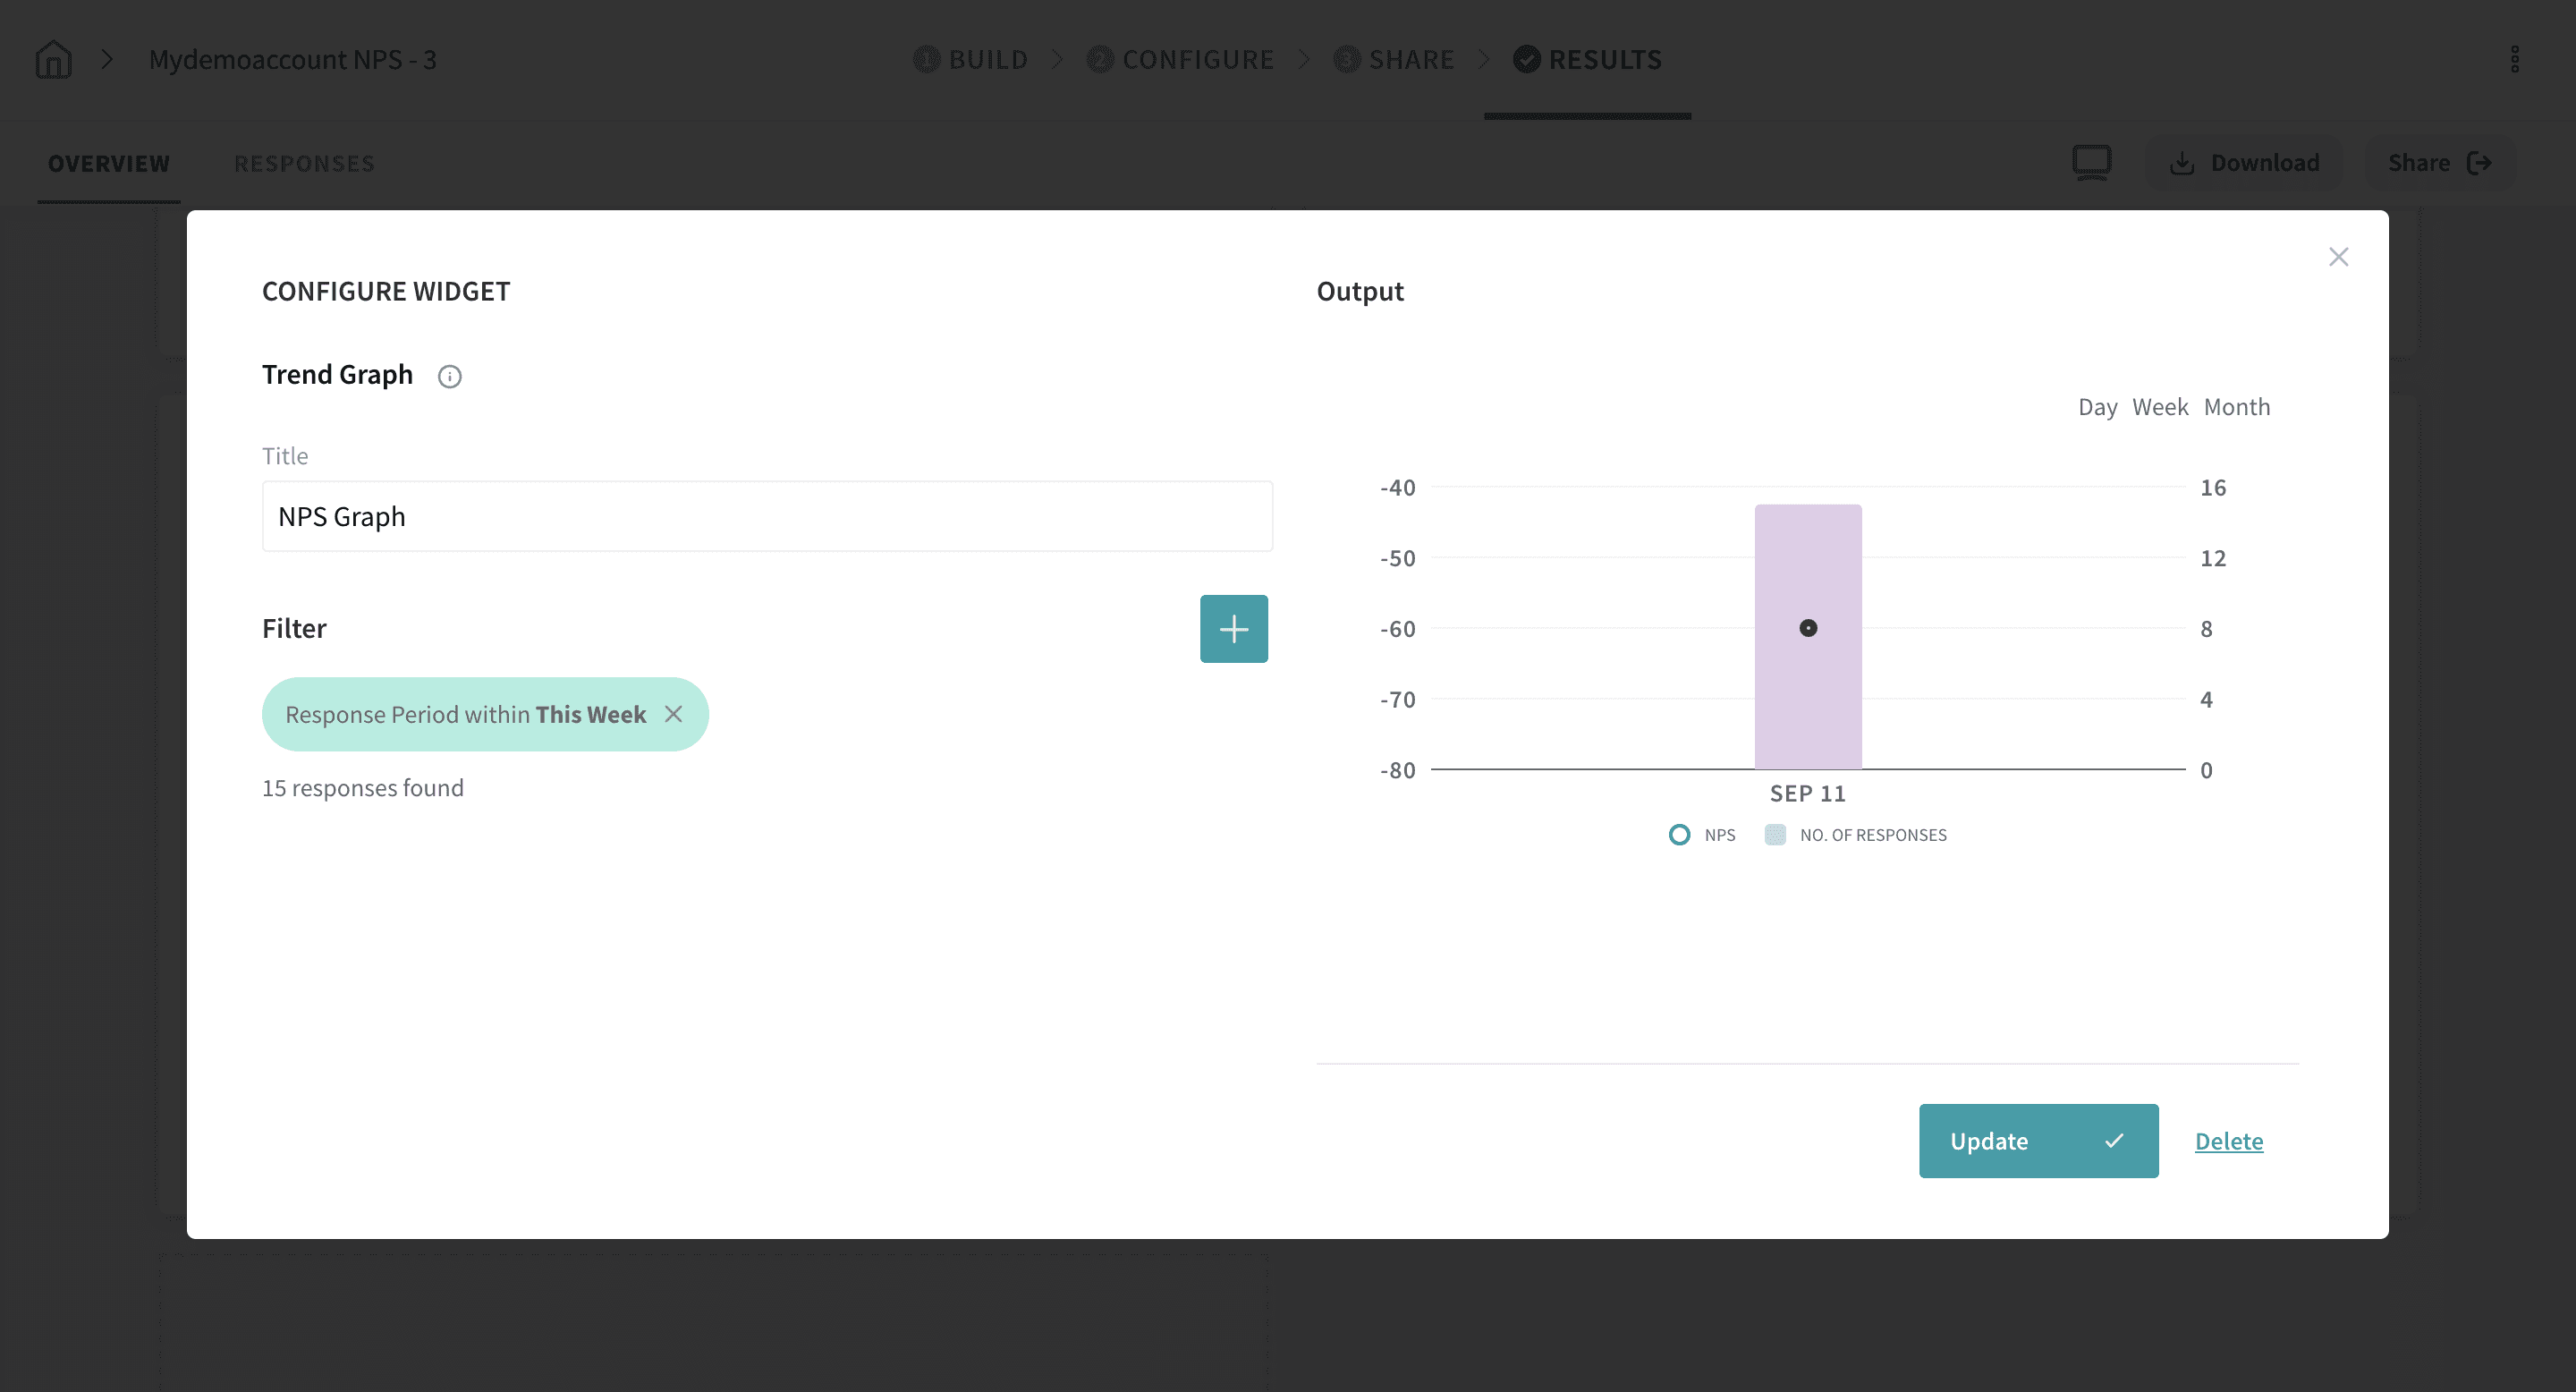
The Trend Graph widget shows you a trend of NPS responses over time and lets you apply a set of rules and conditions to slice through your data.
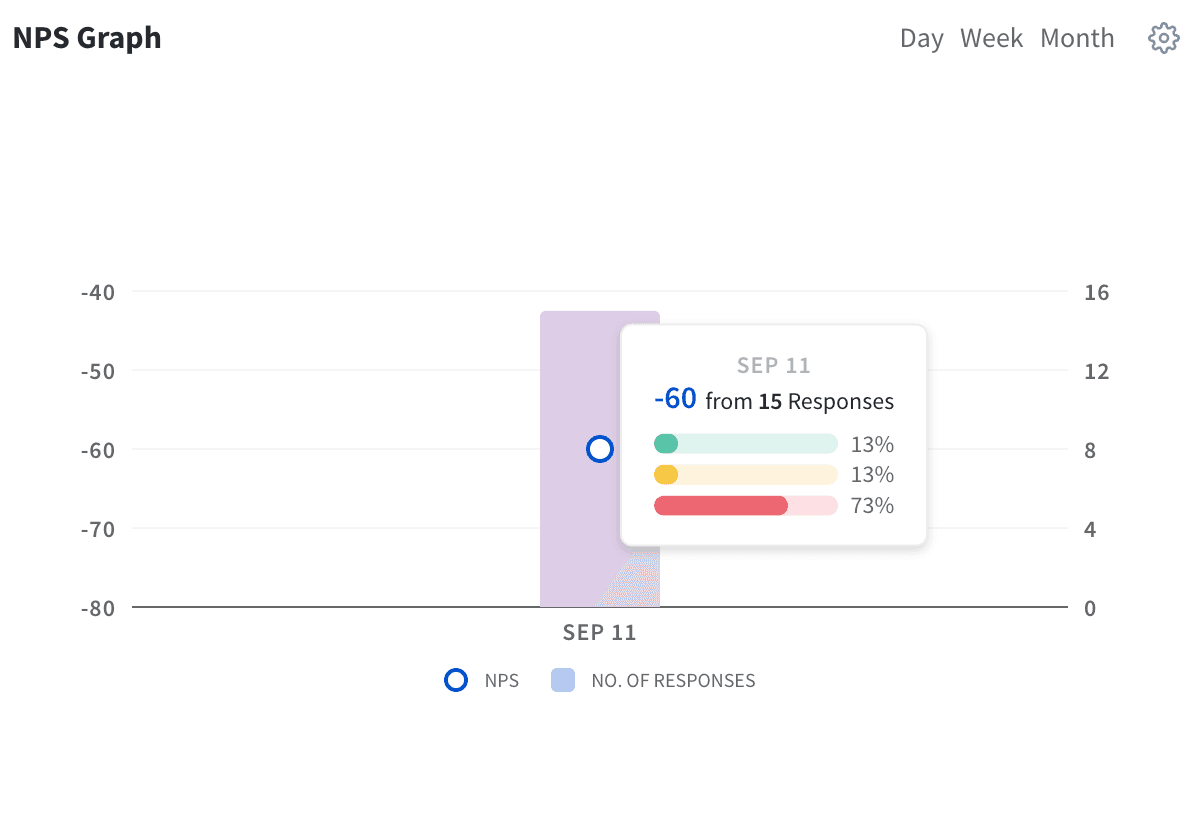
Add a title to your graph, add the necessary filters, and click Create.
3. Click the Responses tab to view a list of all NPS scores and feedback. Filter responses by Promoters, Passives, and Detractors, and by sentiment.
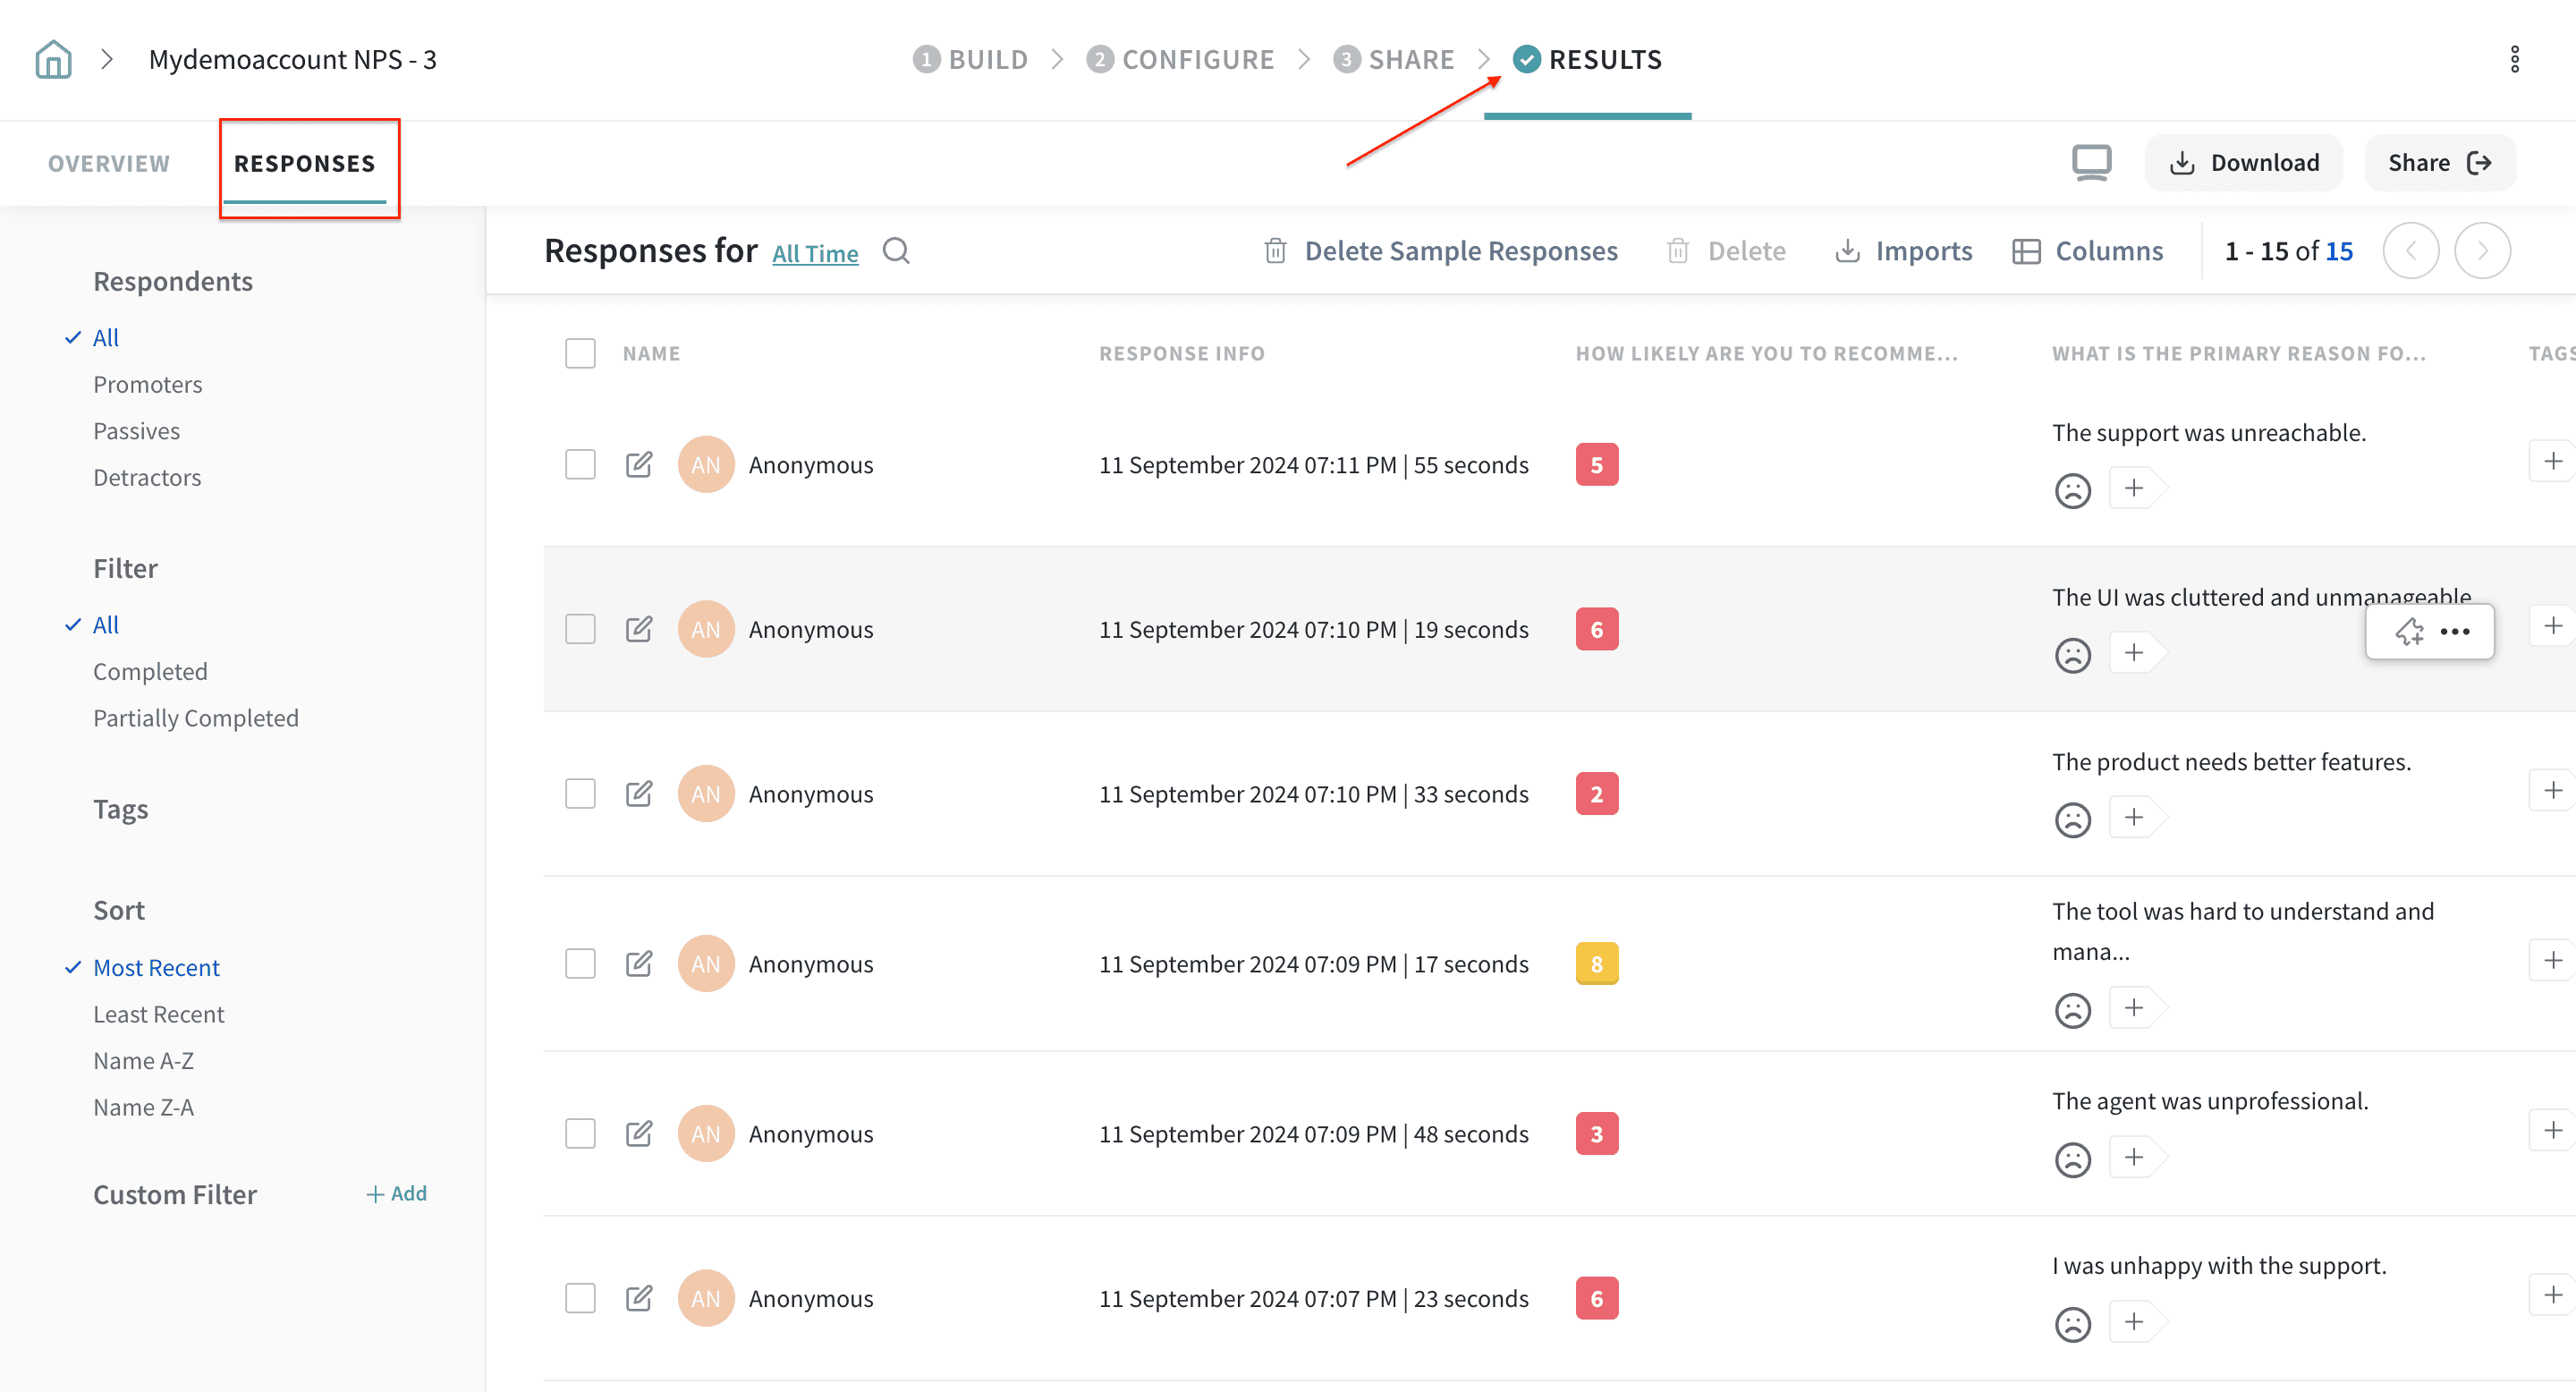
Sentiment analysis lets you process the information received and determine customer opinions based on the sentiment associated with their open-ended feedback. This level of analysis helps you understand whether or not your clients are happy with specific aspects of your brand, find quick solutions to customer issues, and understand the emerging trends. The possibilities are endless!
Businesses get very far by taking the initiative to delight their customers the right way. Happy faces all-round are all you need to conquer customer loyalty. So, let’s take a look at the 5 NPS best practices!
Customers are busy people, just like us. So, when you’re sending them NPS surveys, ensure that the questions are kept to a minimum. All you would really need is the NPS question with a follow-up. Lengthy surveys are one of the leading factors for survey fatigue.
While asking for open-ended feedback is highly recommended for NPS surveys, we recommend marking it as “optional” for respondents. After all, it’s their choice whether they wish to provide feedback or not. Keeping the question mandatory may risk putting off customers and can cause a decline in NPS scores.
Whether you’re sharing it via email, weblink or in-app, survey customization & personalization is the key to good response rates and even better NPS scores. Modify the theme, colors, and text to set your brand tone. Include contact names in the questions to make your customers feel truly special with their very own personalized survey.
Measuring NPS isn’t a one-time thing. It’s a continuous process that helps keep track of how your company is improving or declining in terms of customer satisfaction, revenue, and growth. Automate the delivery of NPS surveys using email workflows, automated scheduling, and integrations with software such as Salesforce, Intercom, Zendesk, etc. to become action efficient, always!
Closing the feedback loop is one of the most important practices to follow for achieving a good NPS score and fuelling business growth on a major scale. Always follow up with unhappy customers and work on solving their problems from the get-go. This shows that you value their opinion and care about taking the necessary steps to provide the best possible experiences to them. Don’t just stop with the detractors - follow up with your promoters as well and gather customer testimonials that can help increase the value of your brand. Nothing brings in new customers than good reviews & ratings.
Net Promoter® and NPS® are registered trademarks and Net Promoter Score and Net Promoter System are trademarks of Bain & Company, Satmetrix Systems, and Fred Reichheld.
Please reach out to us if you have any questions. We are just a chat away
Powered By SparrowDesk