Search
Executive Dashboard got a powerful upgrade!
Your dashboards now bring deeper data visibility to your widgets with the ability to dive deeper into detailed response records and aggregated summaries in one place.
This update turns your dashboard into a more informative workspace where you can see both summary metrics and the responses that power them.
Previously, dashboard widgets displayed only visual summaries such as charts, scores, and trends.
With this update, you can view the exact data behind those visuals, compare summaries against raw responses, and export what you need instantly.
Imagine reviewing your NPS by region and being able to instantly see the exact responses that shaped each score, without leaving the dashboard. Now you can!
Benefits at a glance:
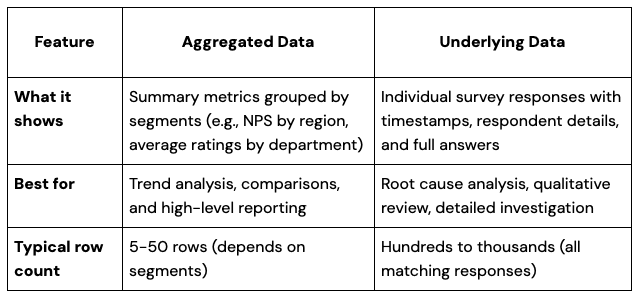
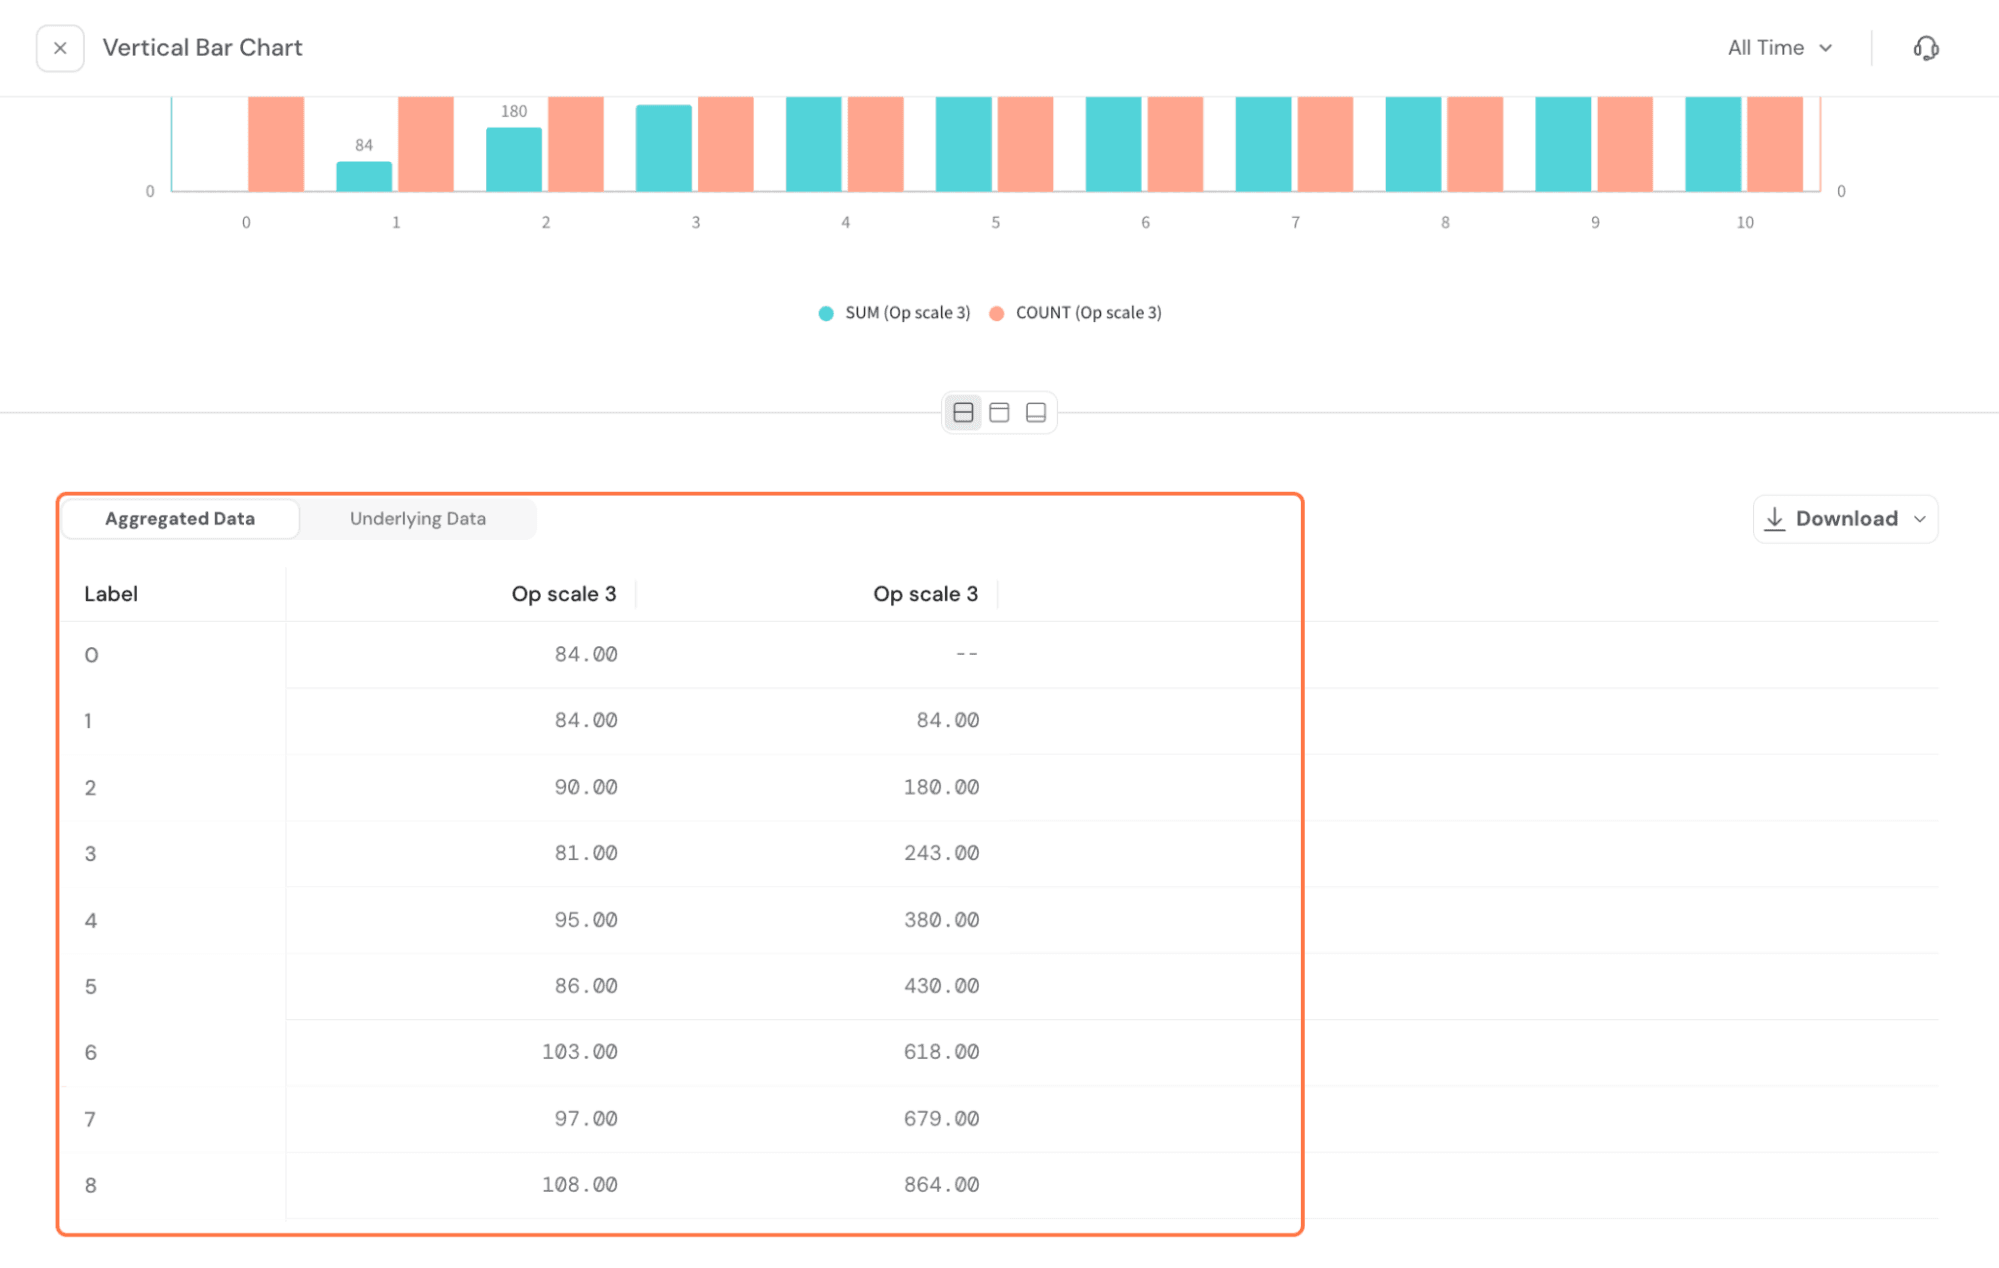
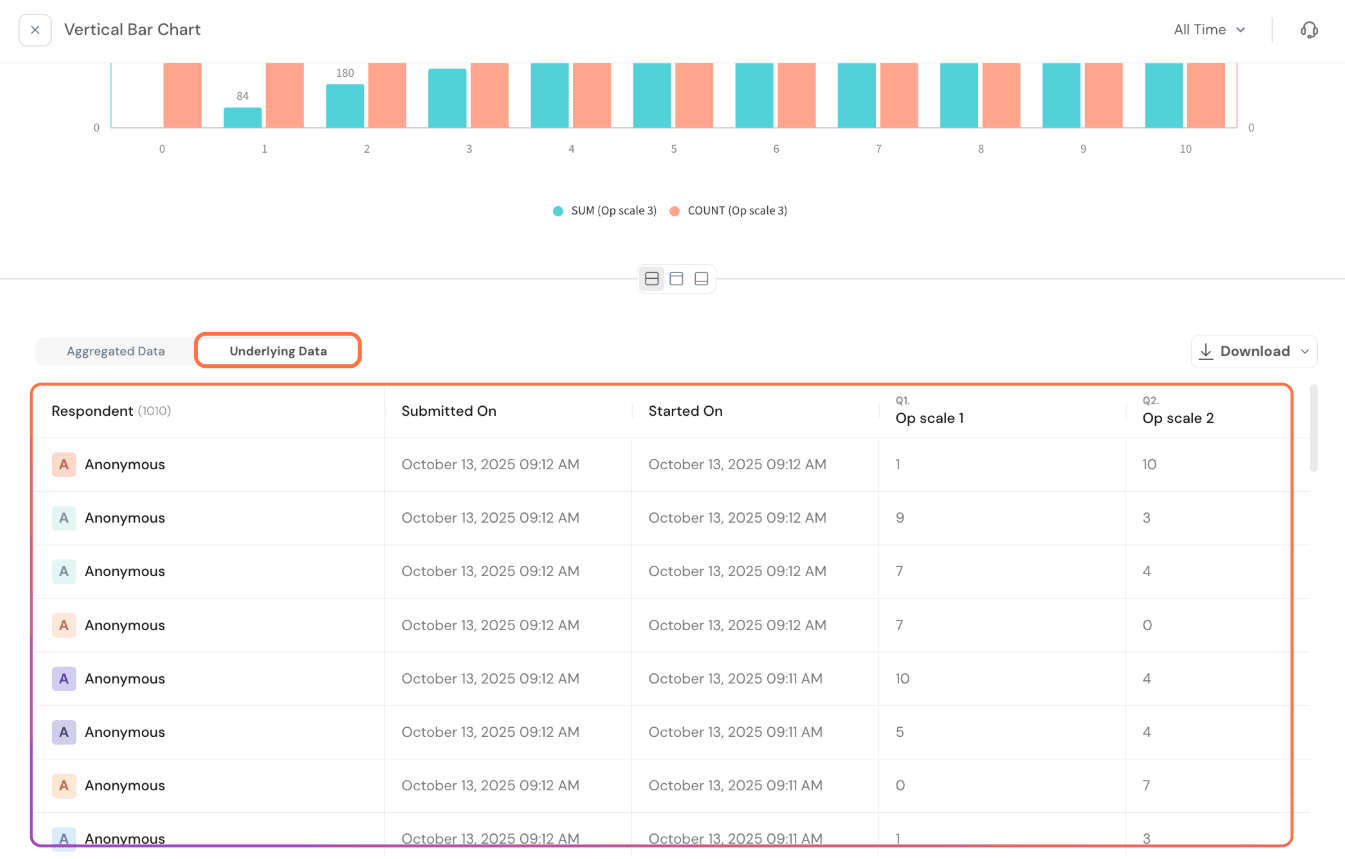
You can now interact with every widget in expanded mode to see two key data views: Aggregated Data and Underlying Data.
Both provide a detailed understanding of how your dashboard metrics are built and can be exported for further analysis.
Let’s get into how you can access this.
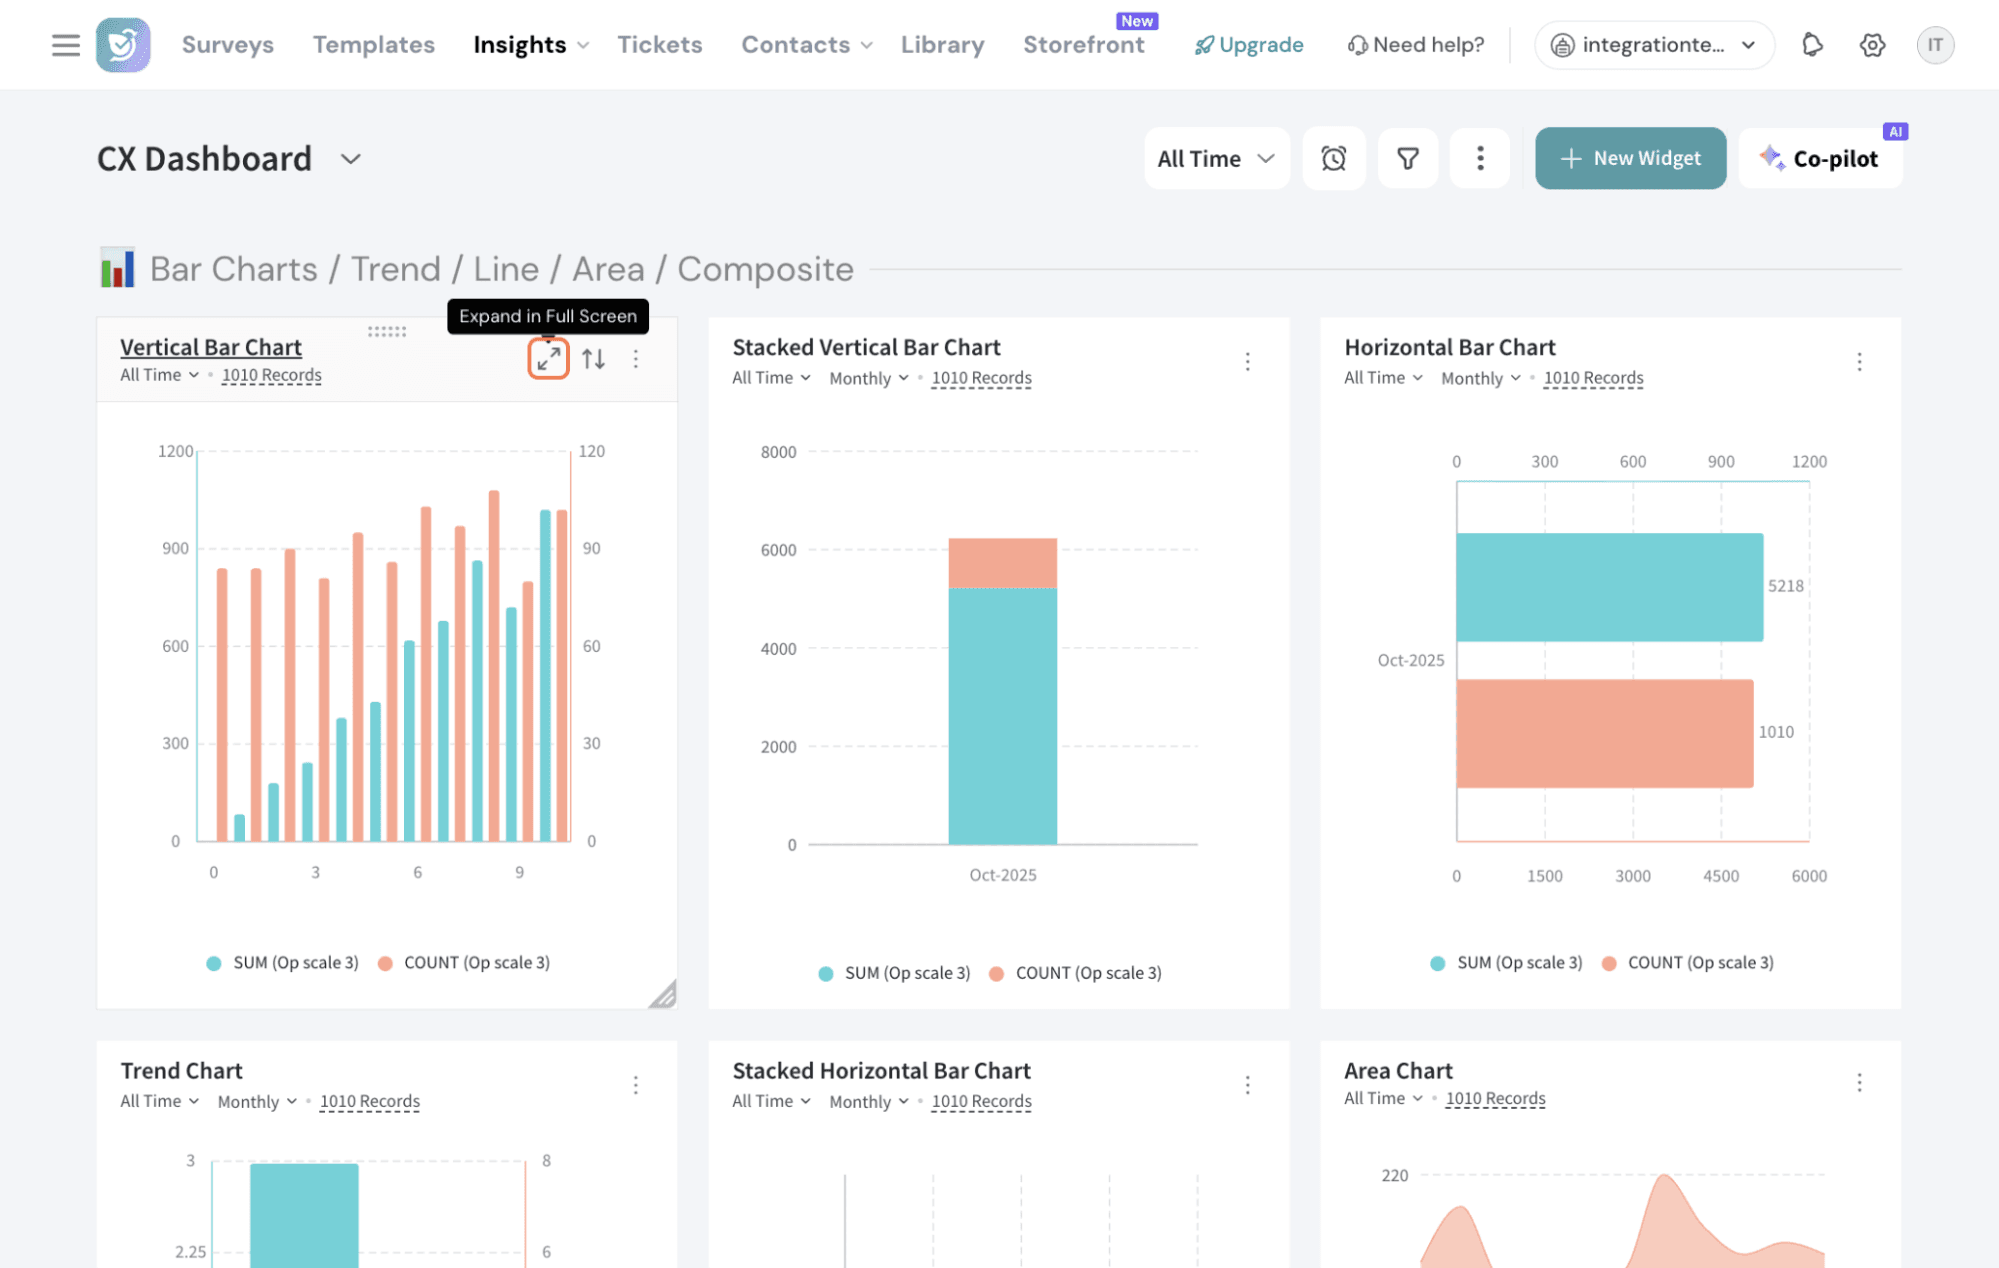
You will notice this expand icon available in all widgets. Click to expand or just tap on the widget name to go into full screen.
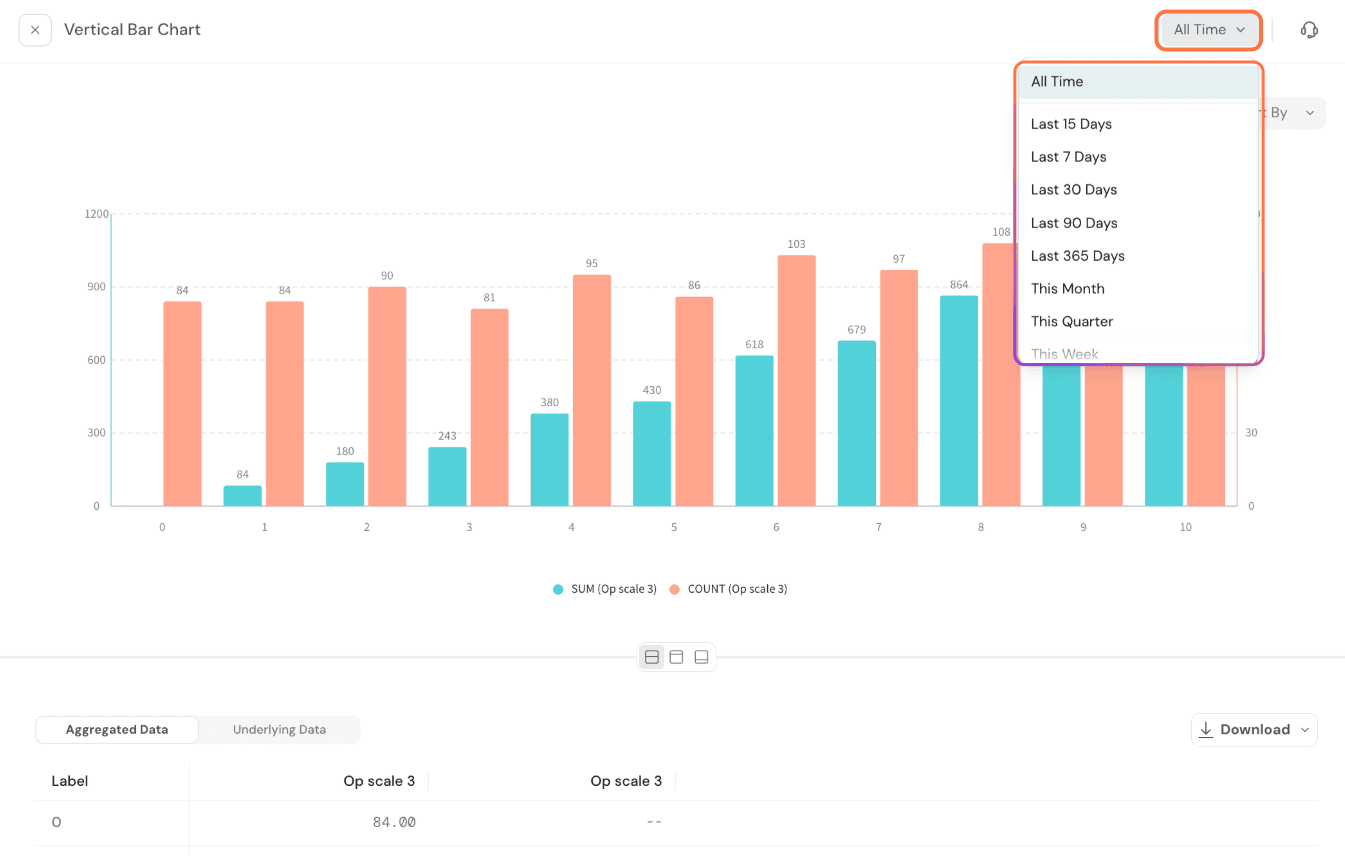
Inside the expanded view, you can apply the same filters and settings as before, along with a few additional controls. Here you have:
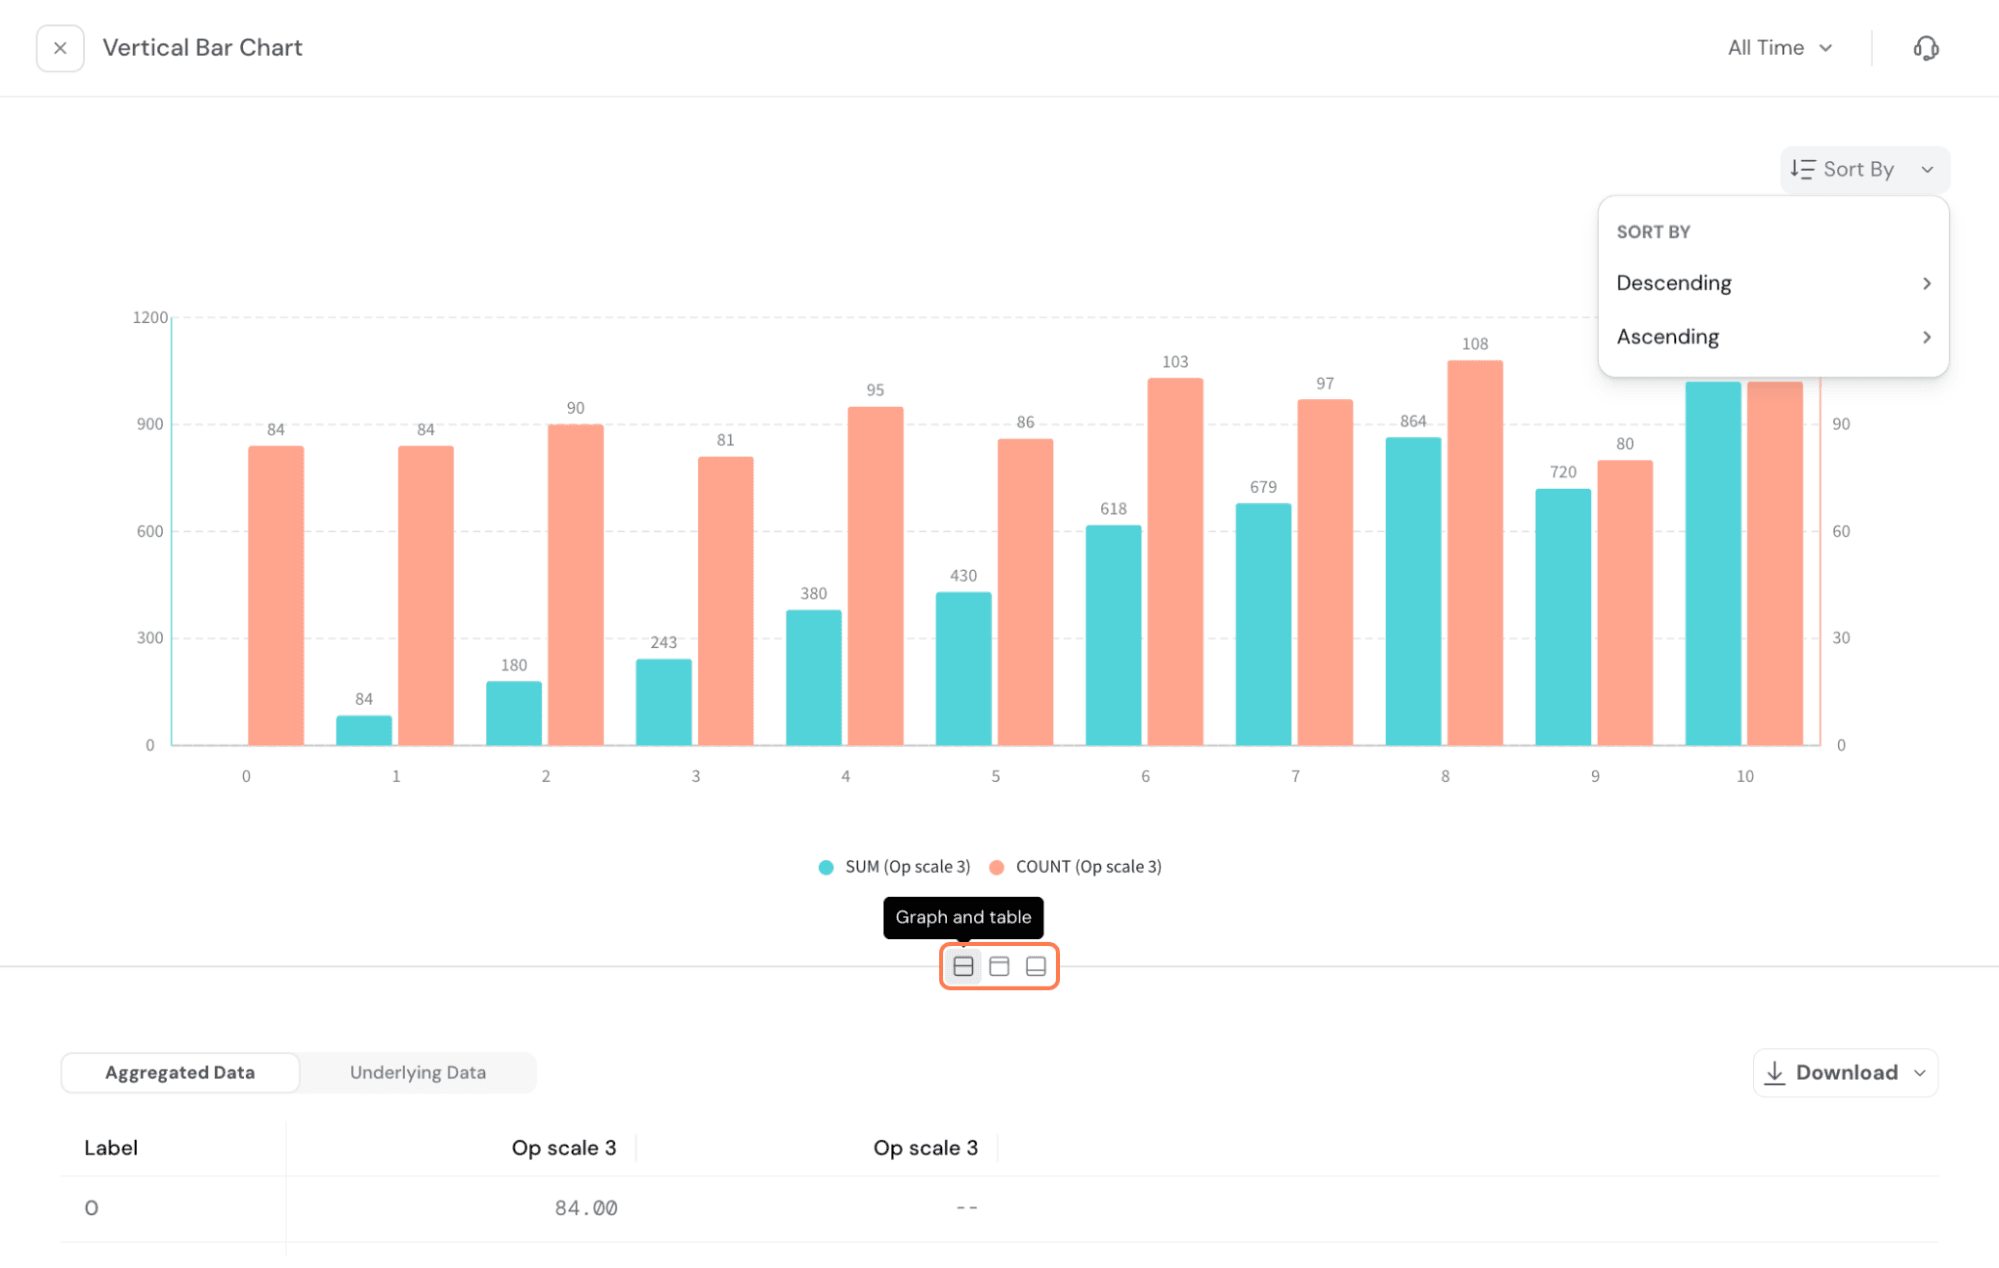

Within the expanded view, you will see two tables:
In this widget, only one source is used. Let’s take the example of 2 sources being used:
Here, you see that you have each source appearing as a separate tab in the table view. 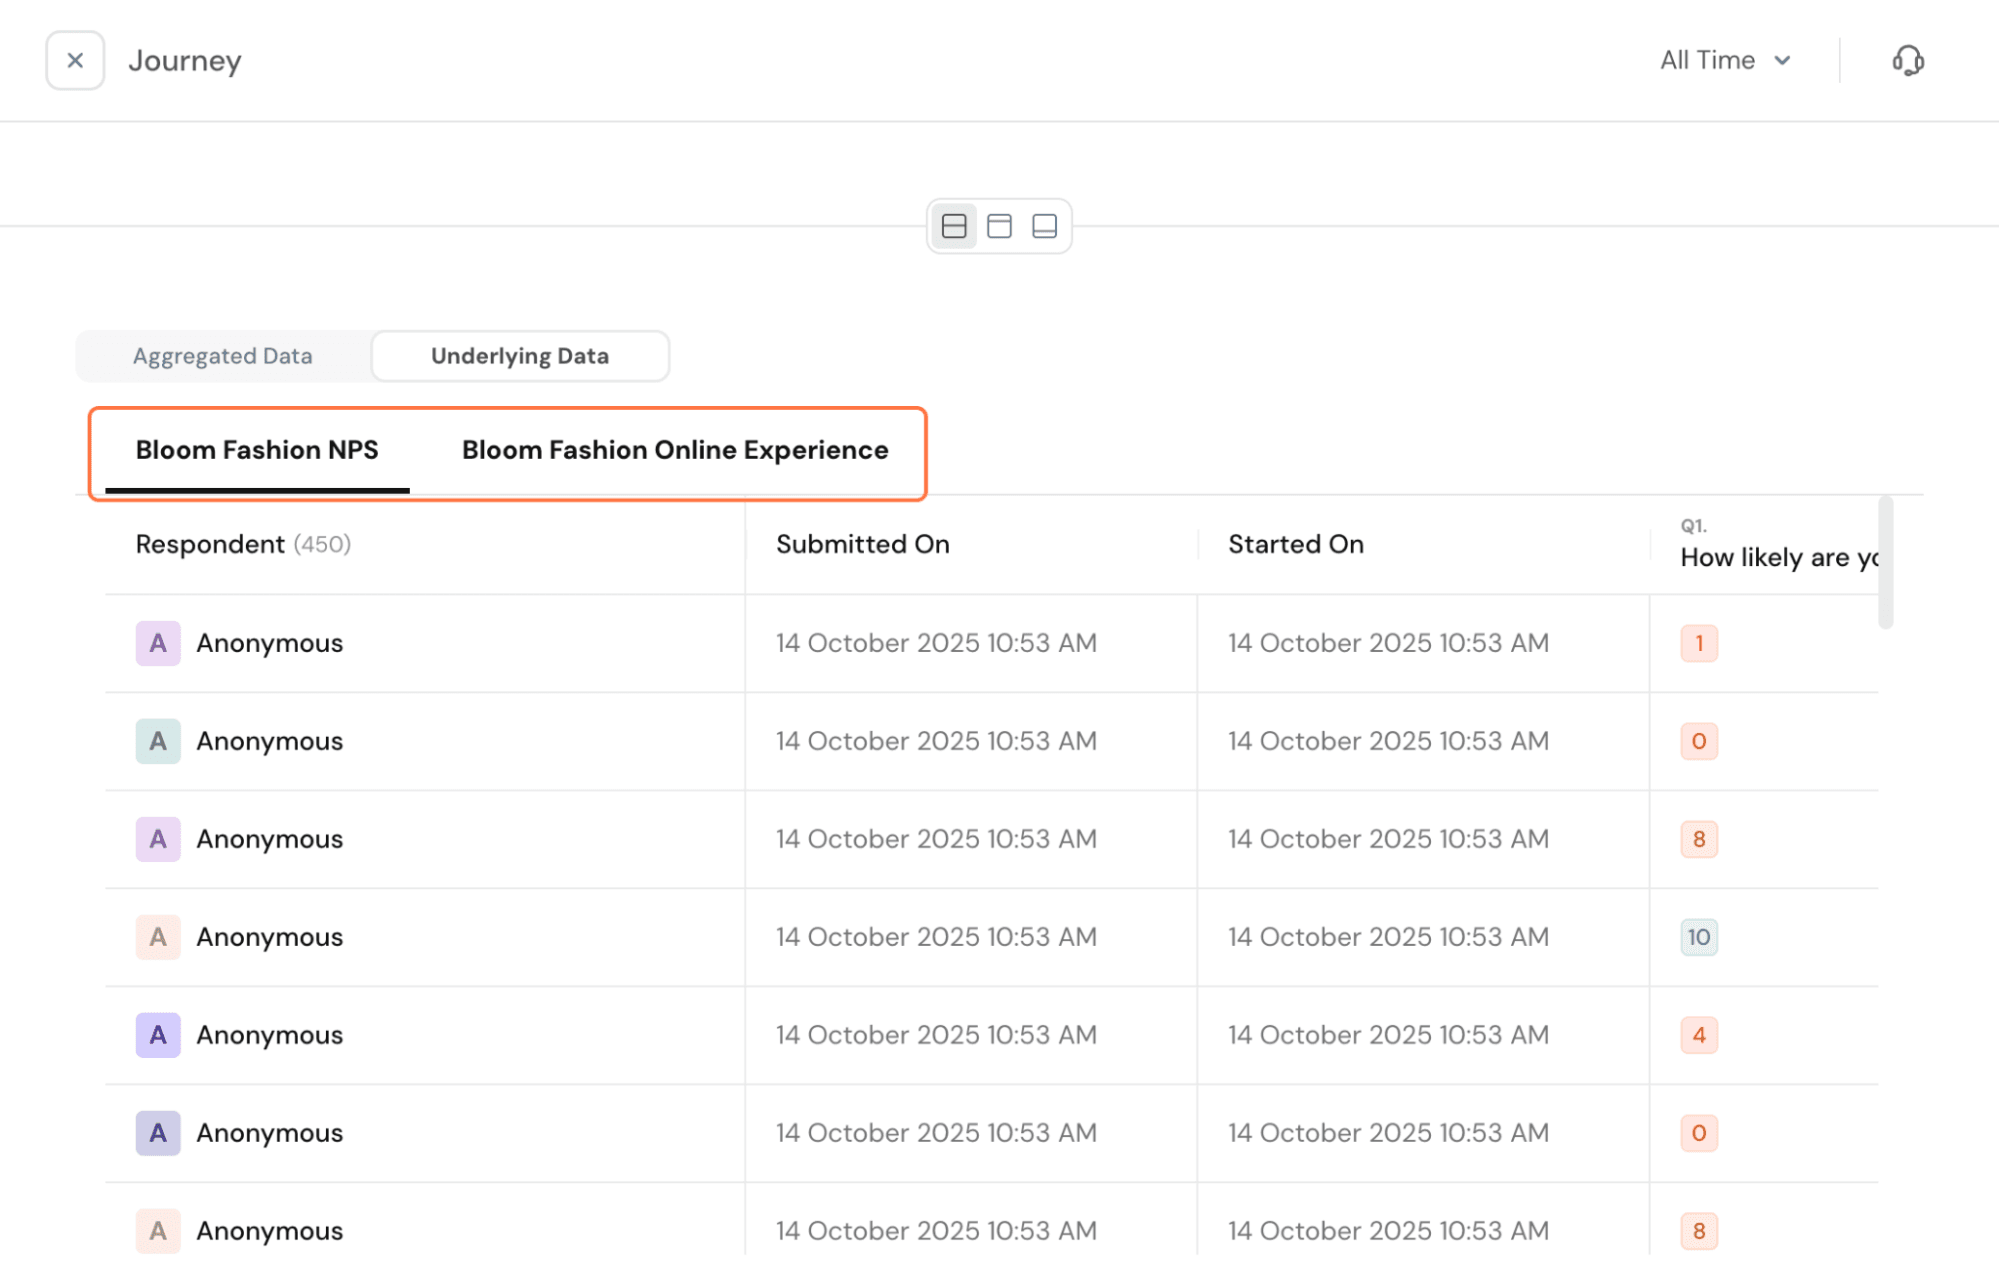
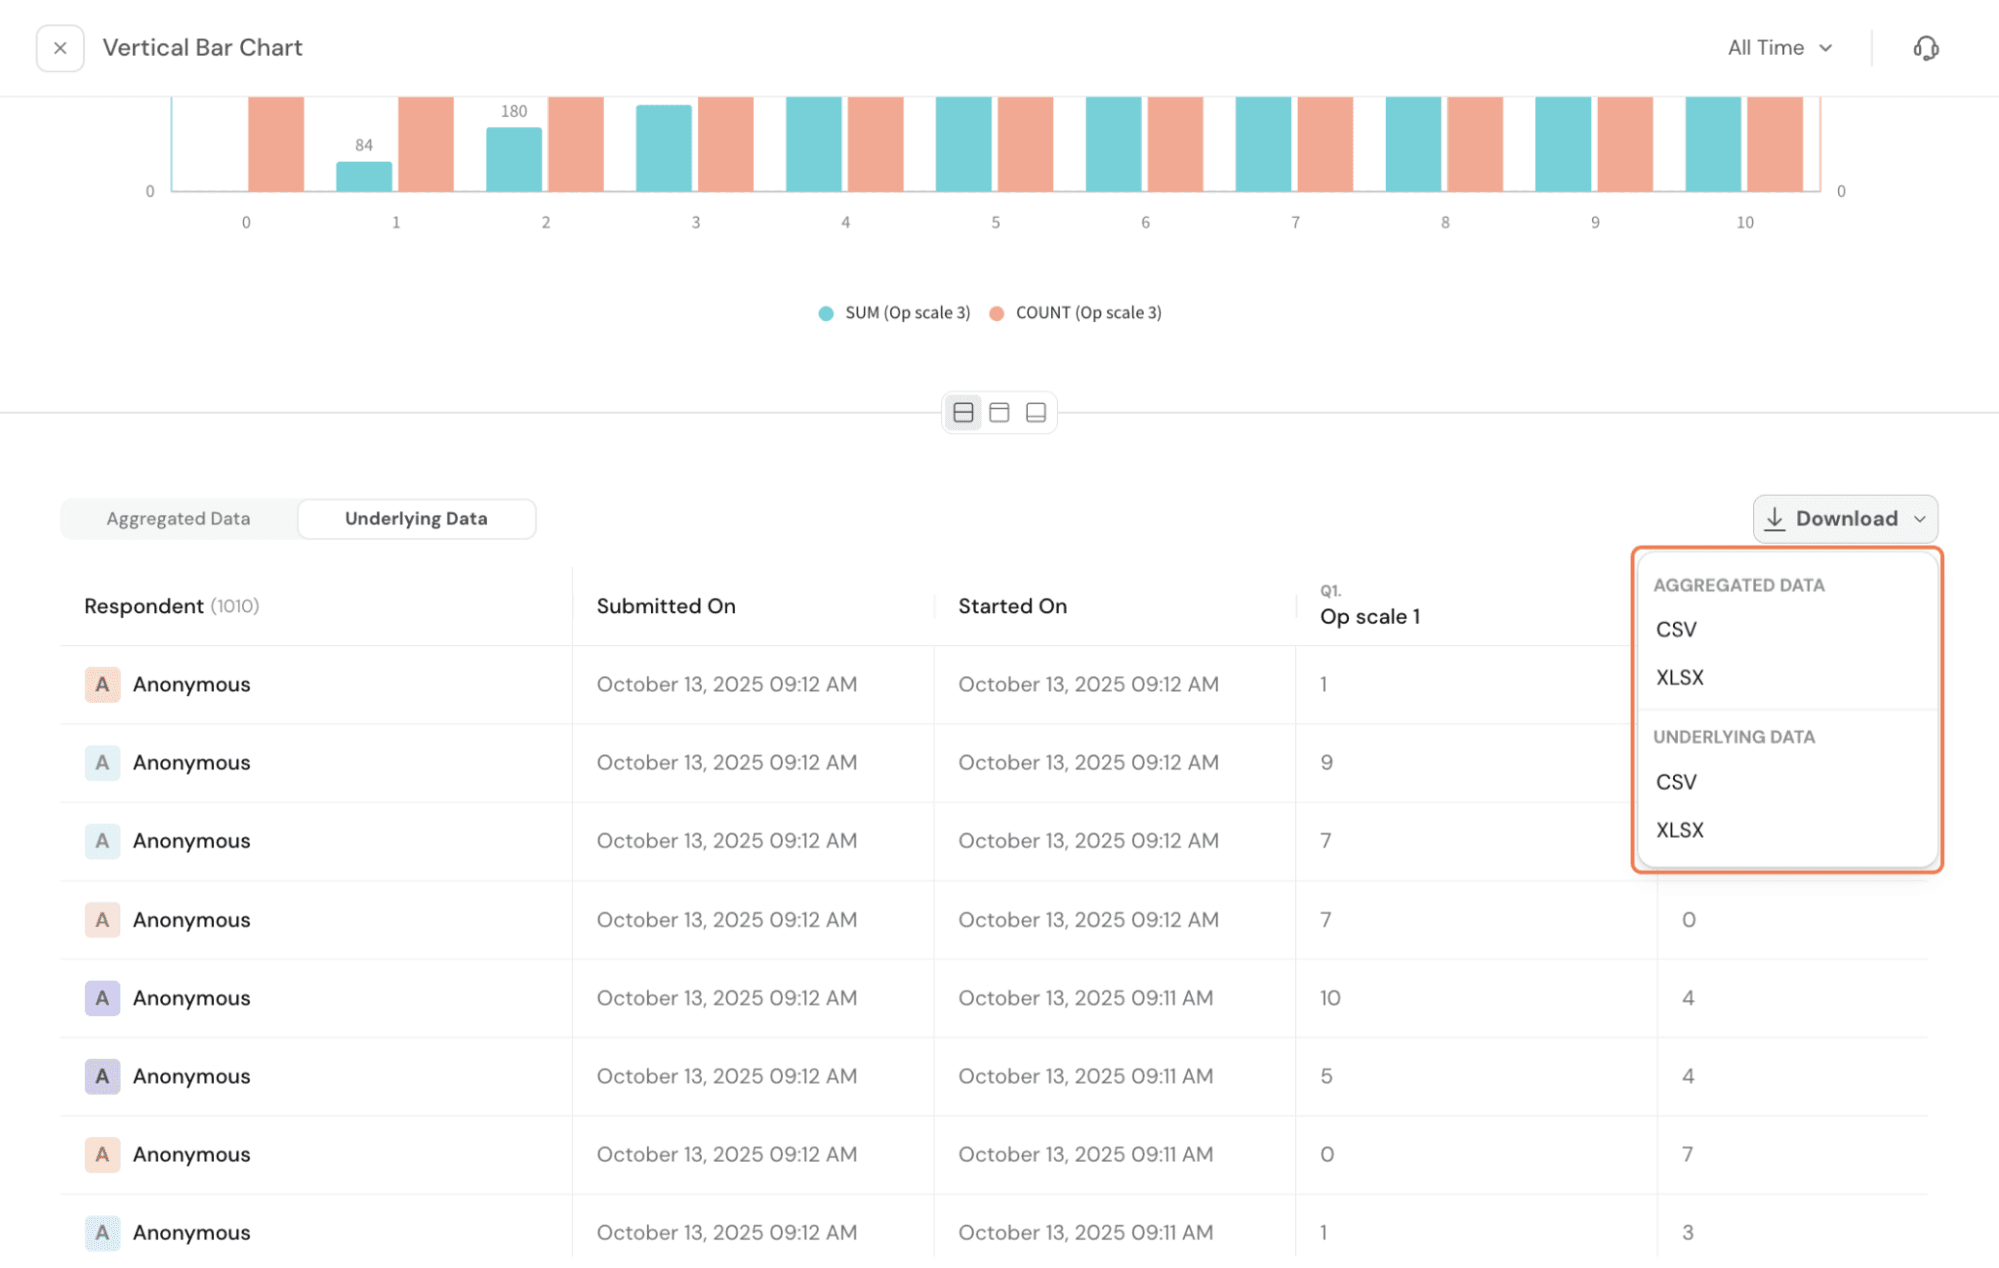
You can choose to export these as CSV or XLSX.
Data Access:
With the underlying and aggregated data being available, you have a refined set of permissions to configure for the dashboard.
You can choose if people viewing the dashboard need access to the underlying data or not.
To set this up, click on the three dots.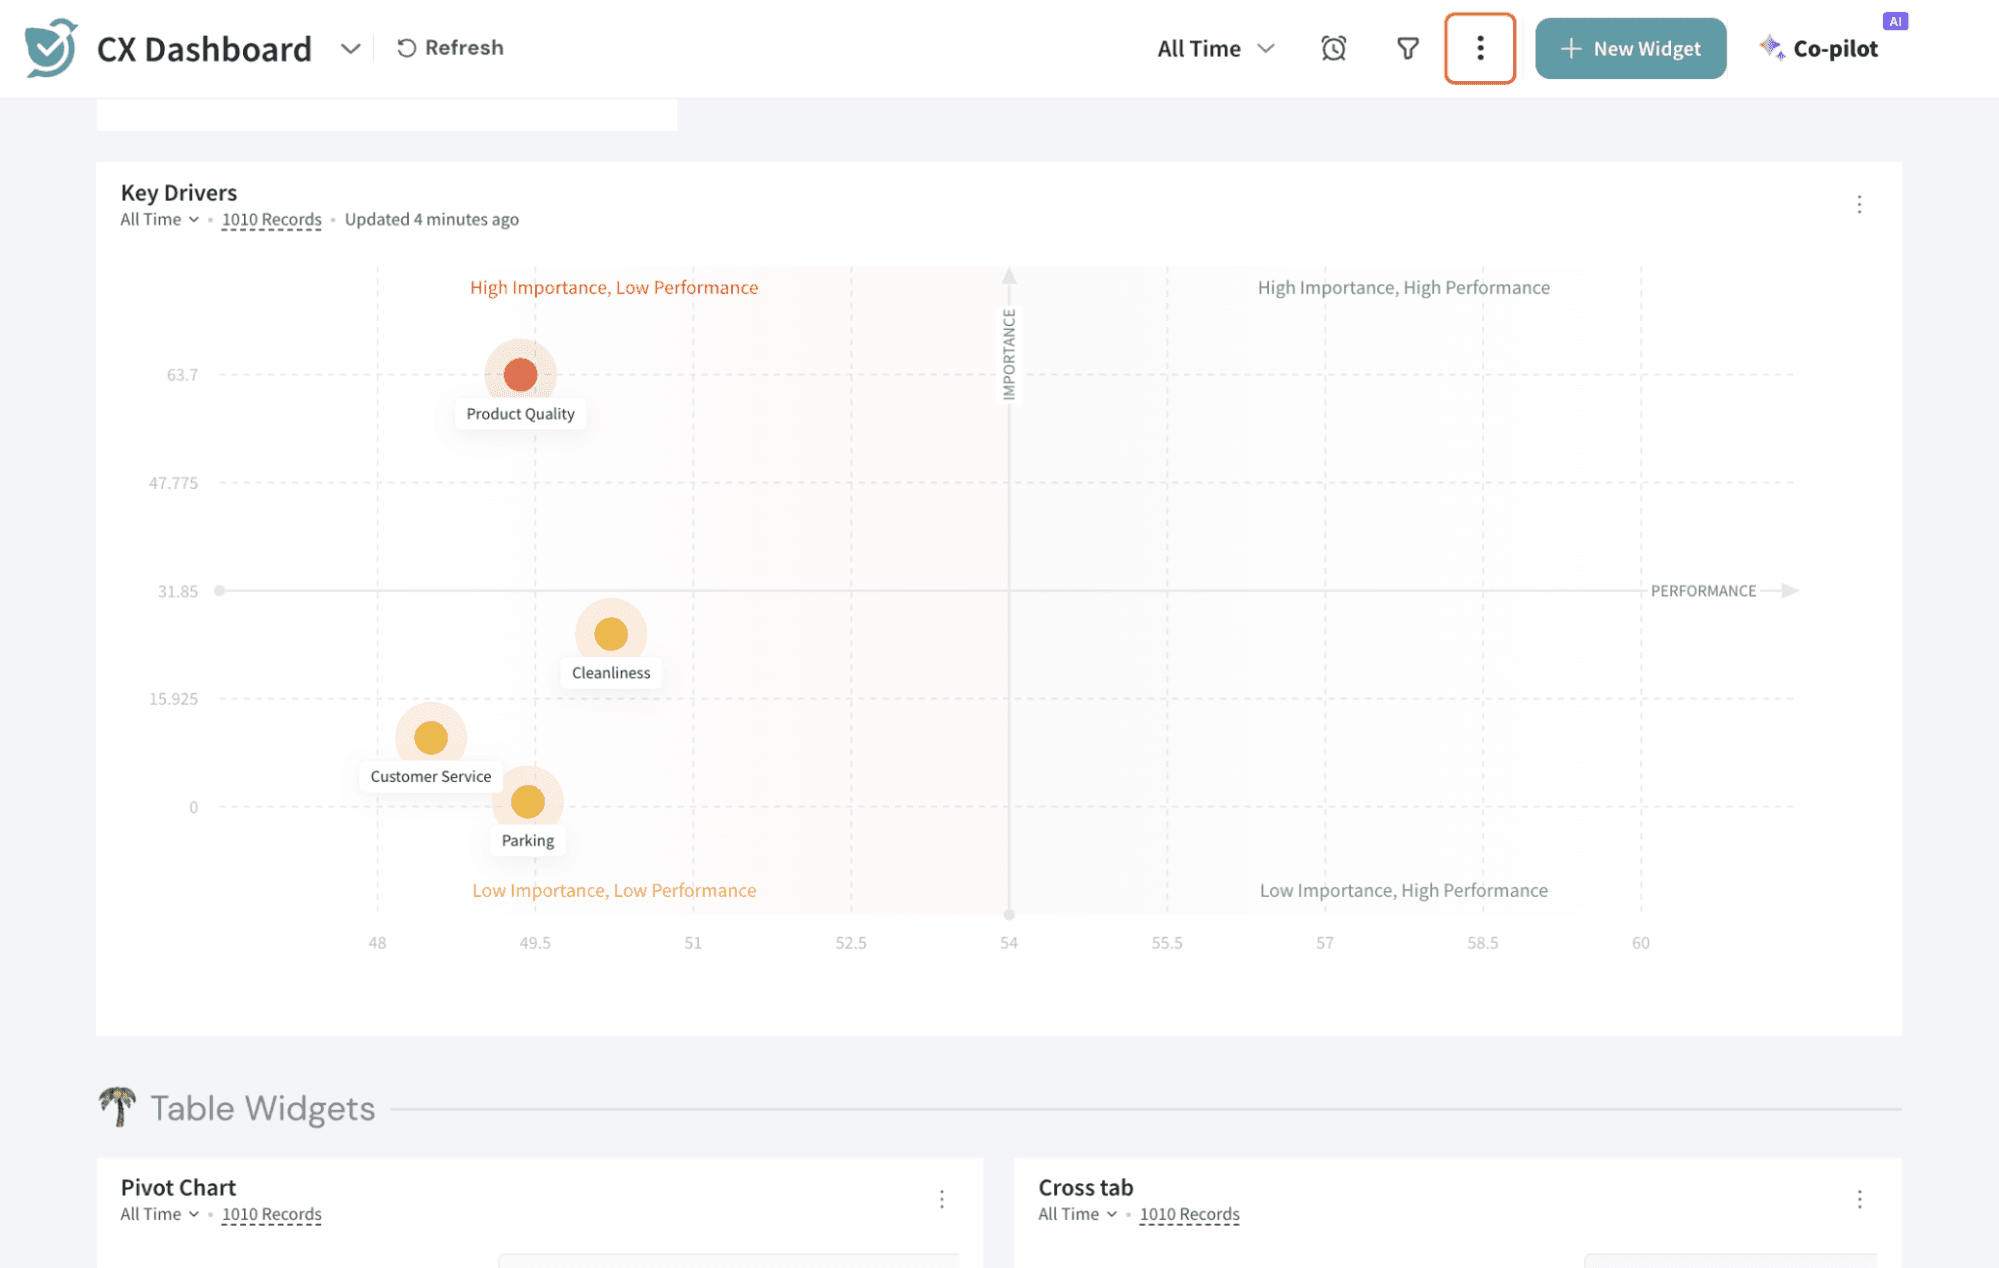
Click on Dashboard Settings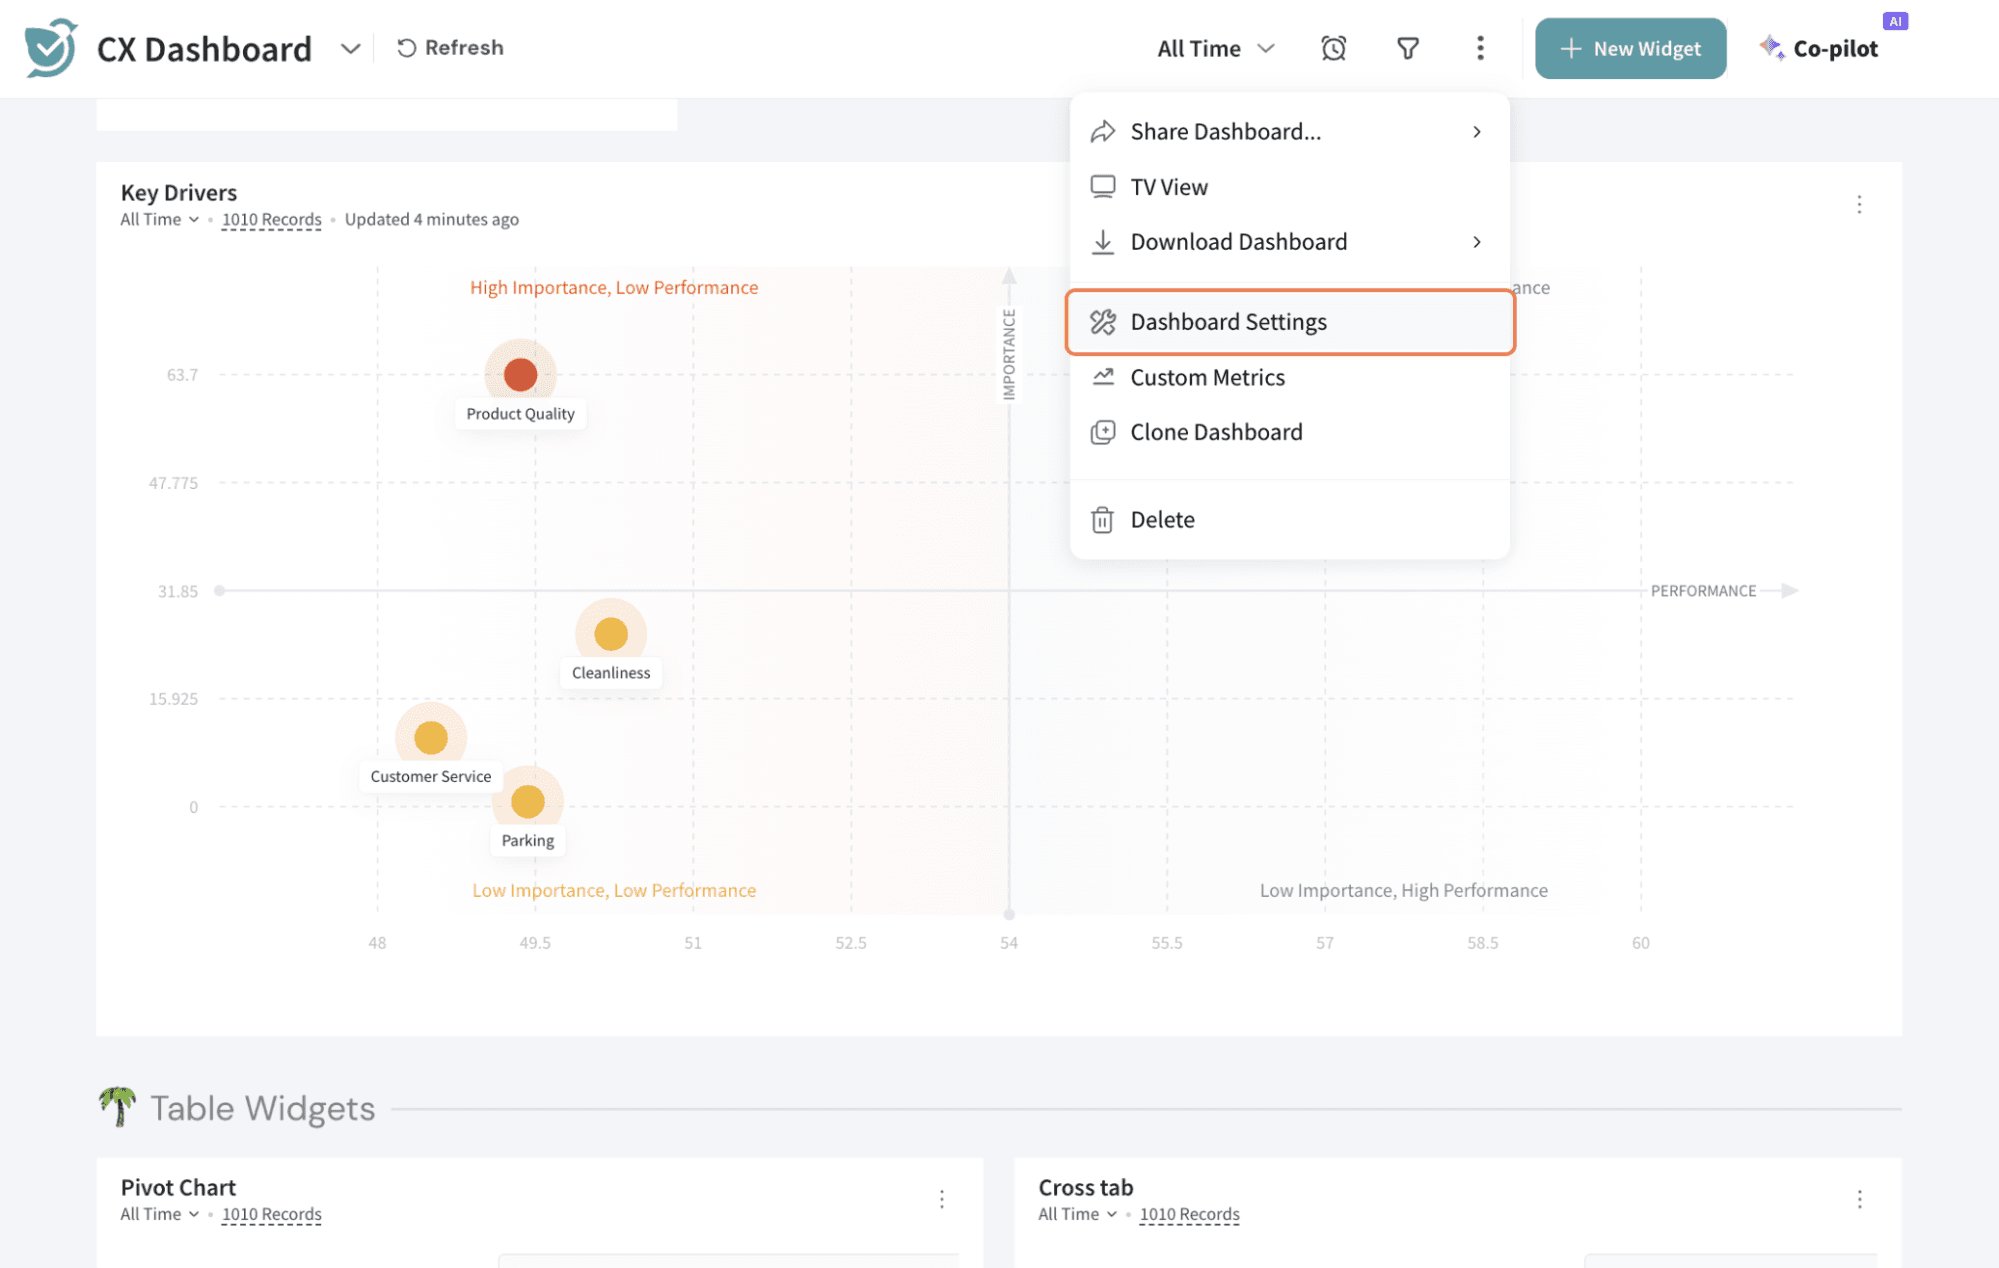
Go to Permissions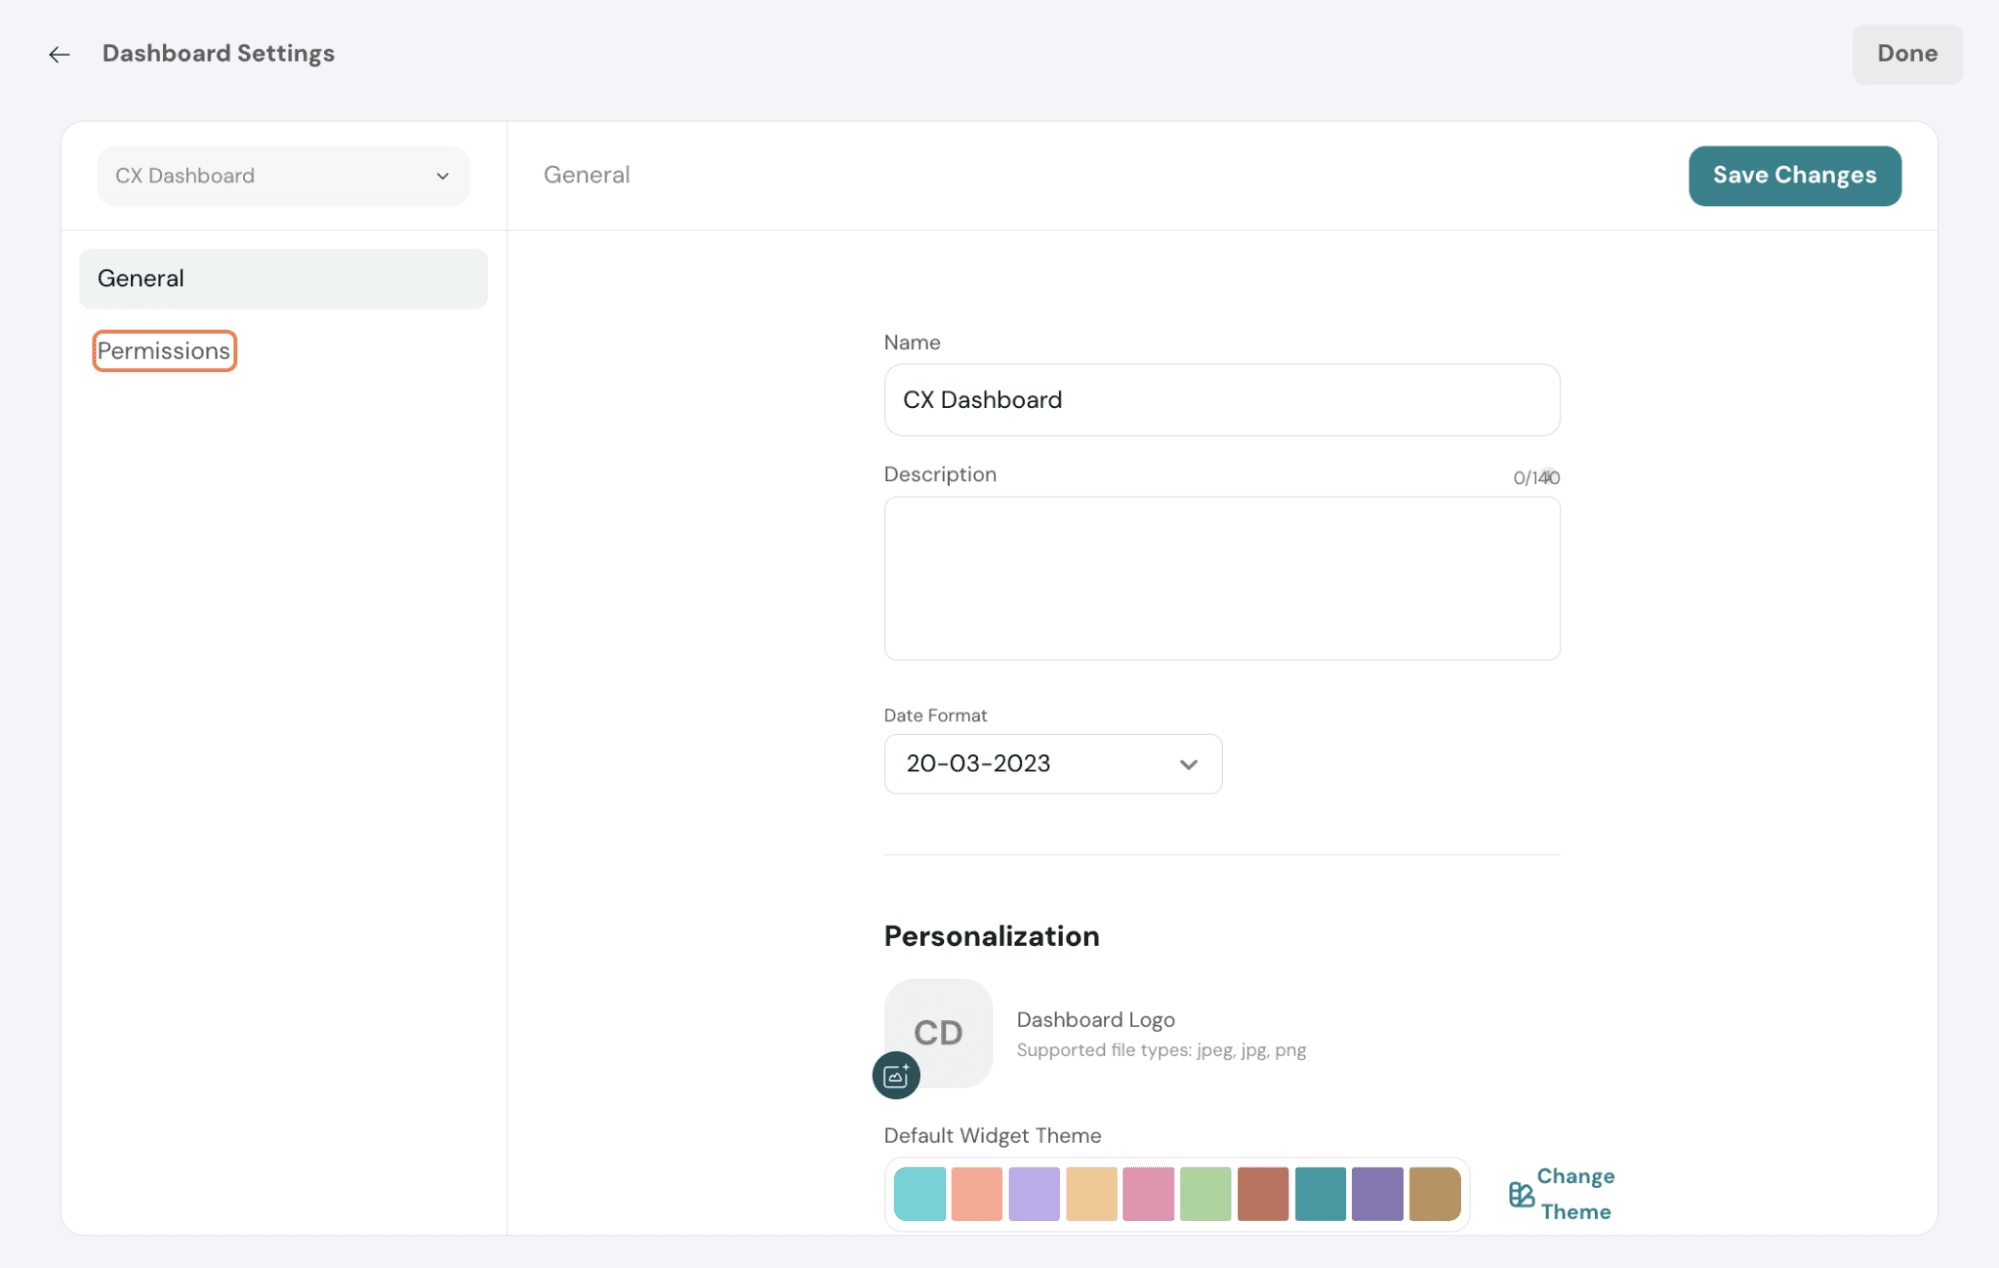
Tick the checkboxes to give access to view and download the underlying data.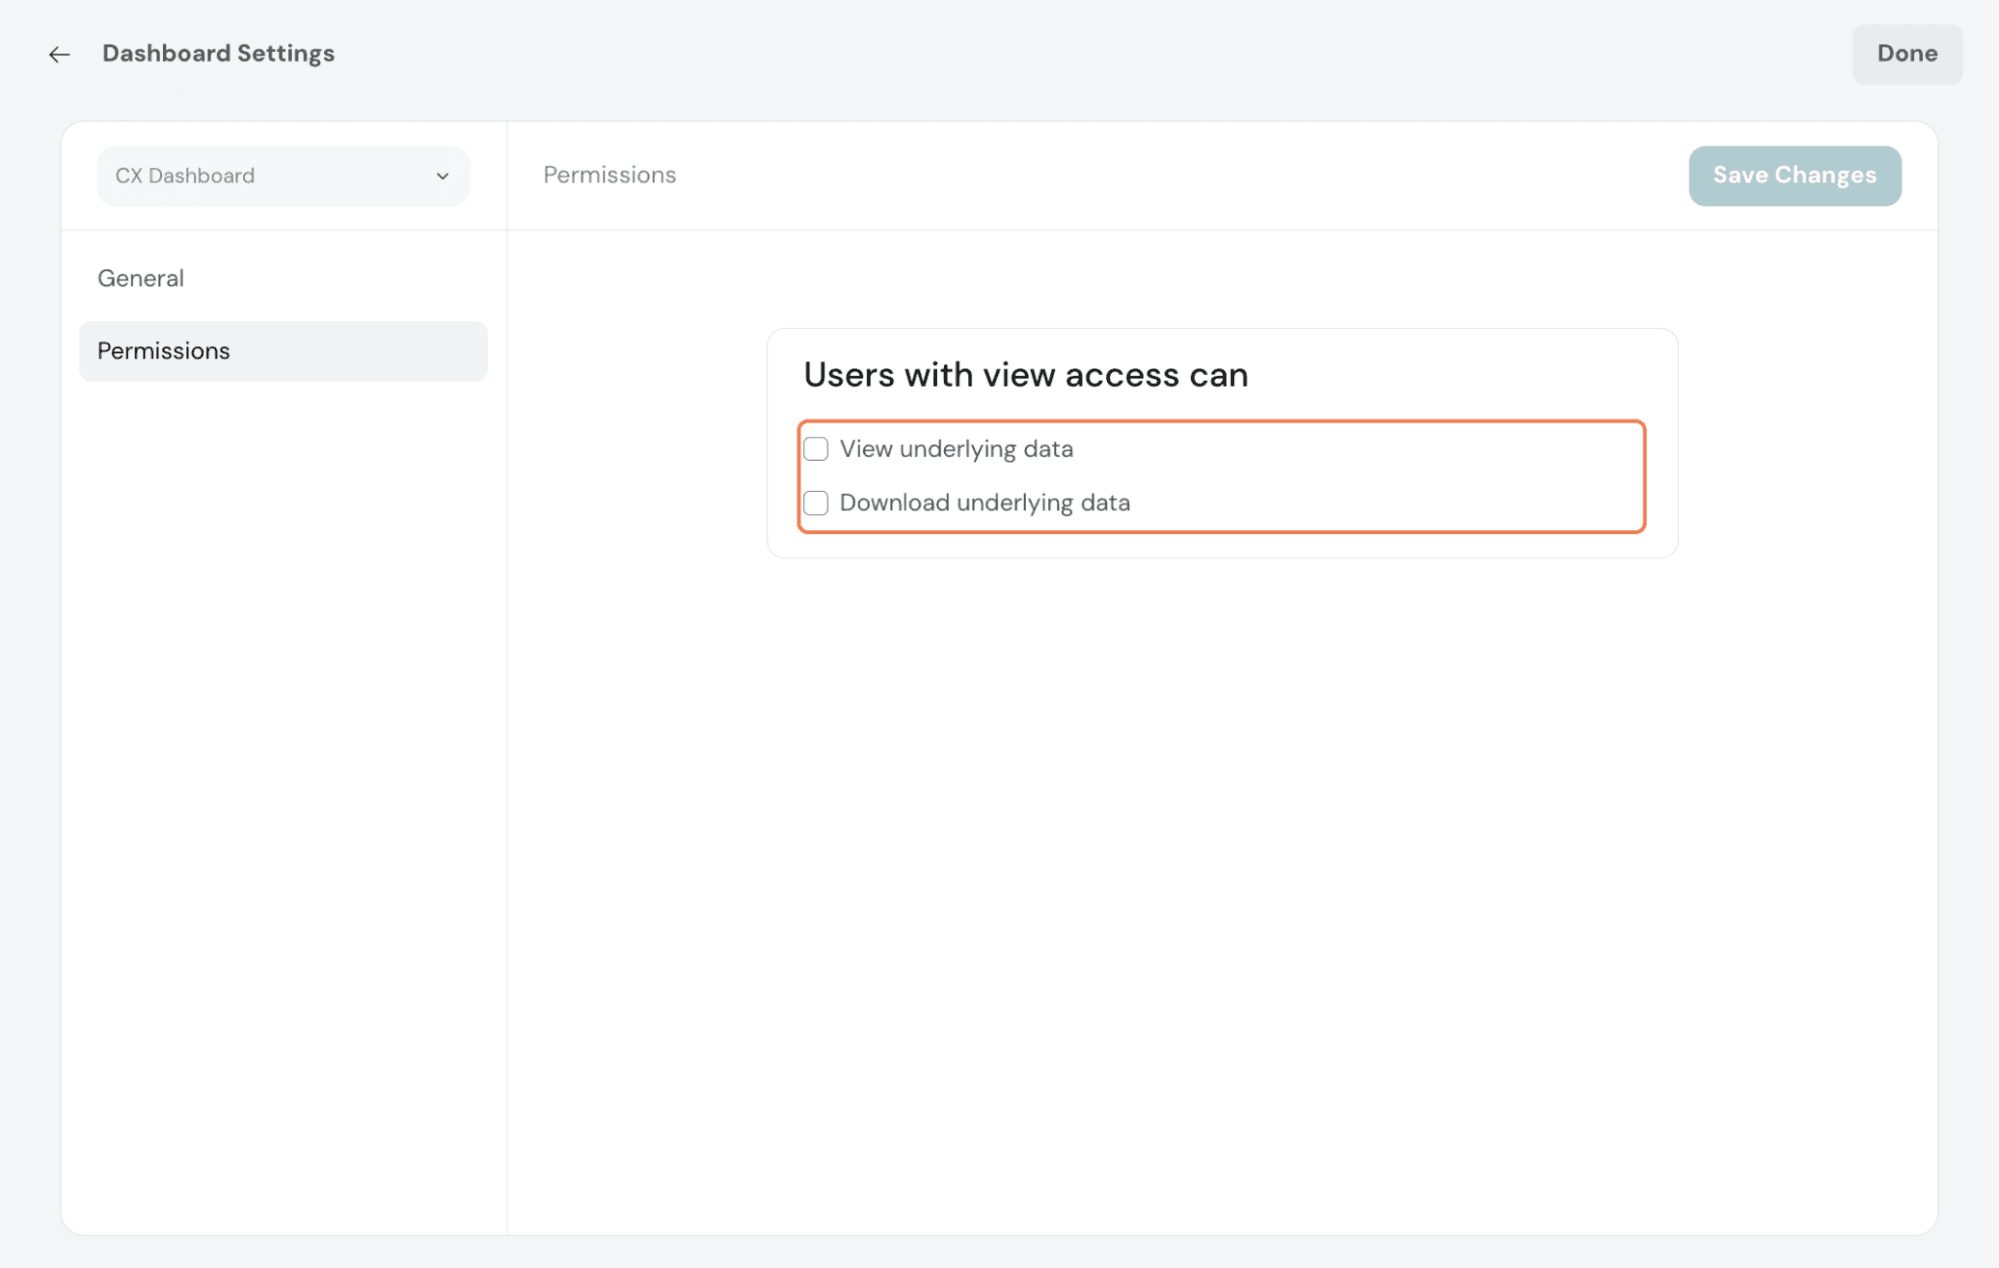
Now, whenever you share the dashboard, based on your permissions, the viewers will get access to the underlying data accordingly. By default, these permissions will be unchecked so you can choose to give view access to underlying data if needed.
For accounts with edit access, the underlying data is available by default.
Note:
There is a list of widgets that have Aggregated View and Underlying View supported, respectively. Find it below.
With this update, your Executive Dashboard is now a unified space to view insights, explore data, and make decisions with confidence.
Feel free to reach out to our community if you have any questions
Powered By SparrowDesk