Search
Response Rate helps you understand how effectively your surveys convert outreach into actual responses. With Custom Response Rate, you can choose how the response rate is calculated across your account, using clearly defined delivery, engagement, and submission metrics.
It is now a configurable metric that lets you define what “responded” means for your account, so all dashboards, reports, and channel analyses stay consistent and meaningful.
SurveySparrow now introduces 2 pre-defined response rate options and the ability to make your own custom response rates.
By default, all accounts have delivery-based response rates configured.
Only Admins and account owners can access the settings to customise the account's response rate.
Only Admins and Account Owners can:
Dashboard users can view and use the metric, but not edit it.
First-time setup behavior
When you access Response Rate settings for the first time, no response rate selection is applied yet.
Existing Executive Dashboard widgets continue to show the previously used response rate until a selection is made.
The moment an Admin or Account Owner:
The chosen calculation is immediately applied across the entire account.
Note: The calculation chosen is always applicable across the entire account.
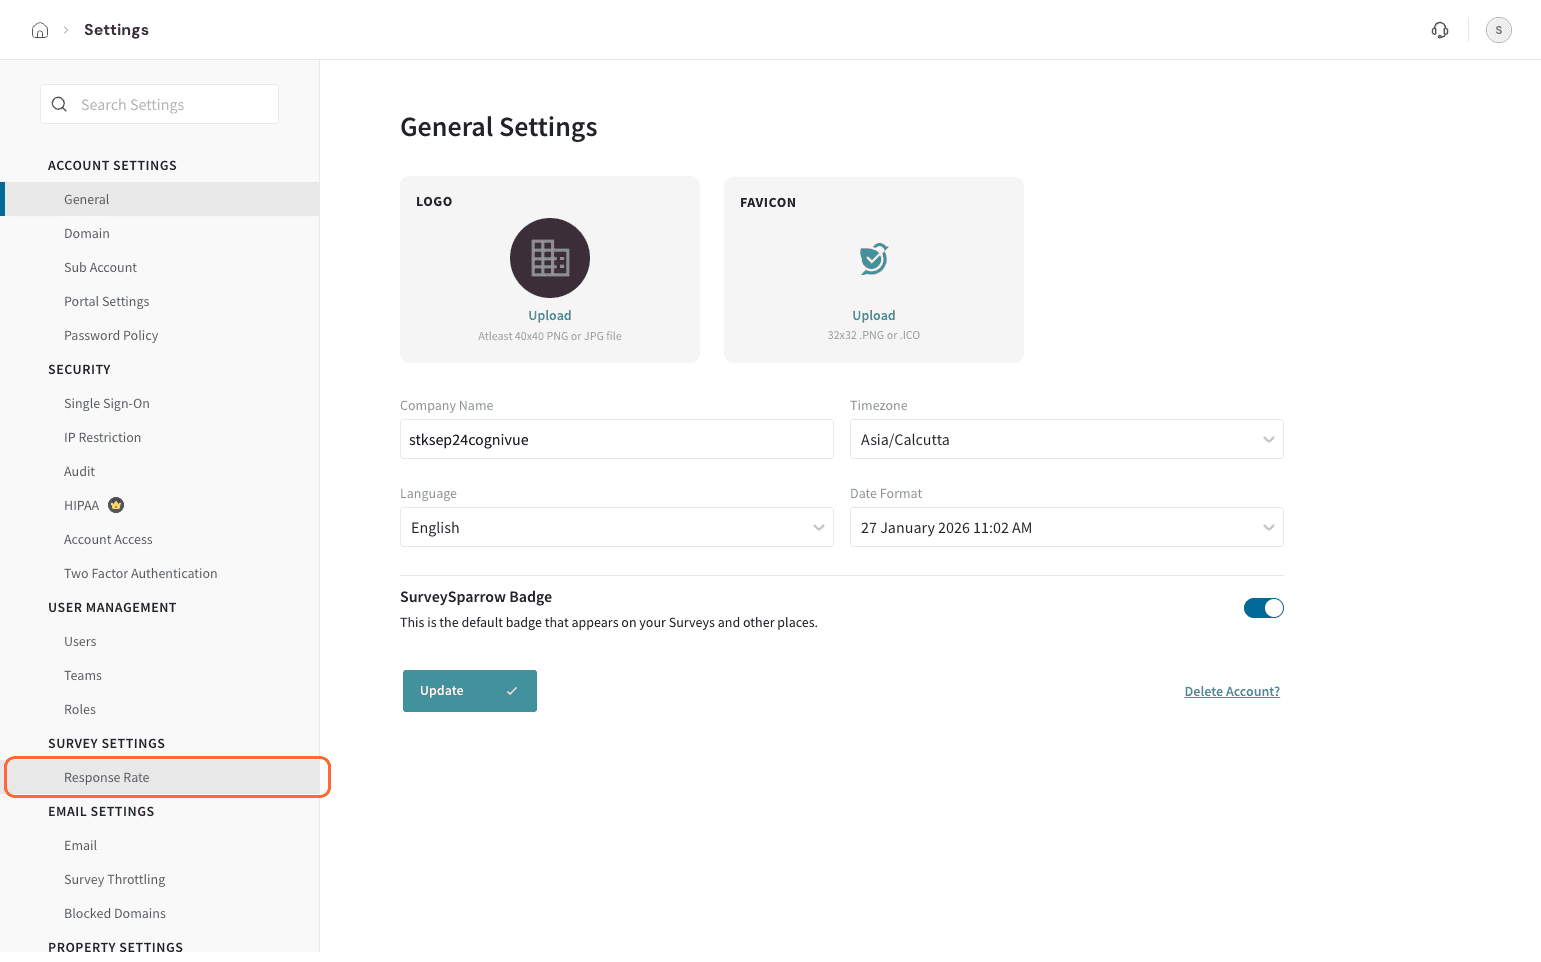
If you want to create your own response rate that makes sense to your brand, go to Settings.

Under Survey Settings, select Response Rate.
Click on Create Custom Calculation.
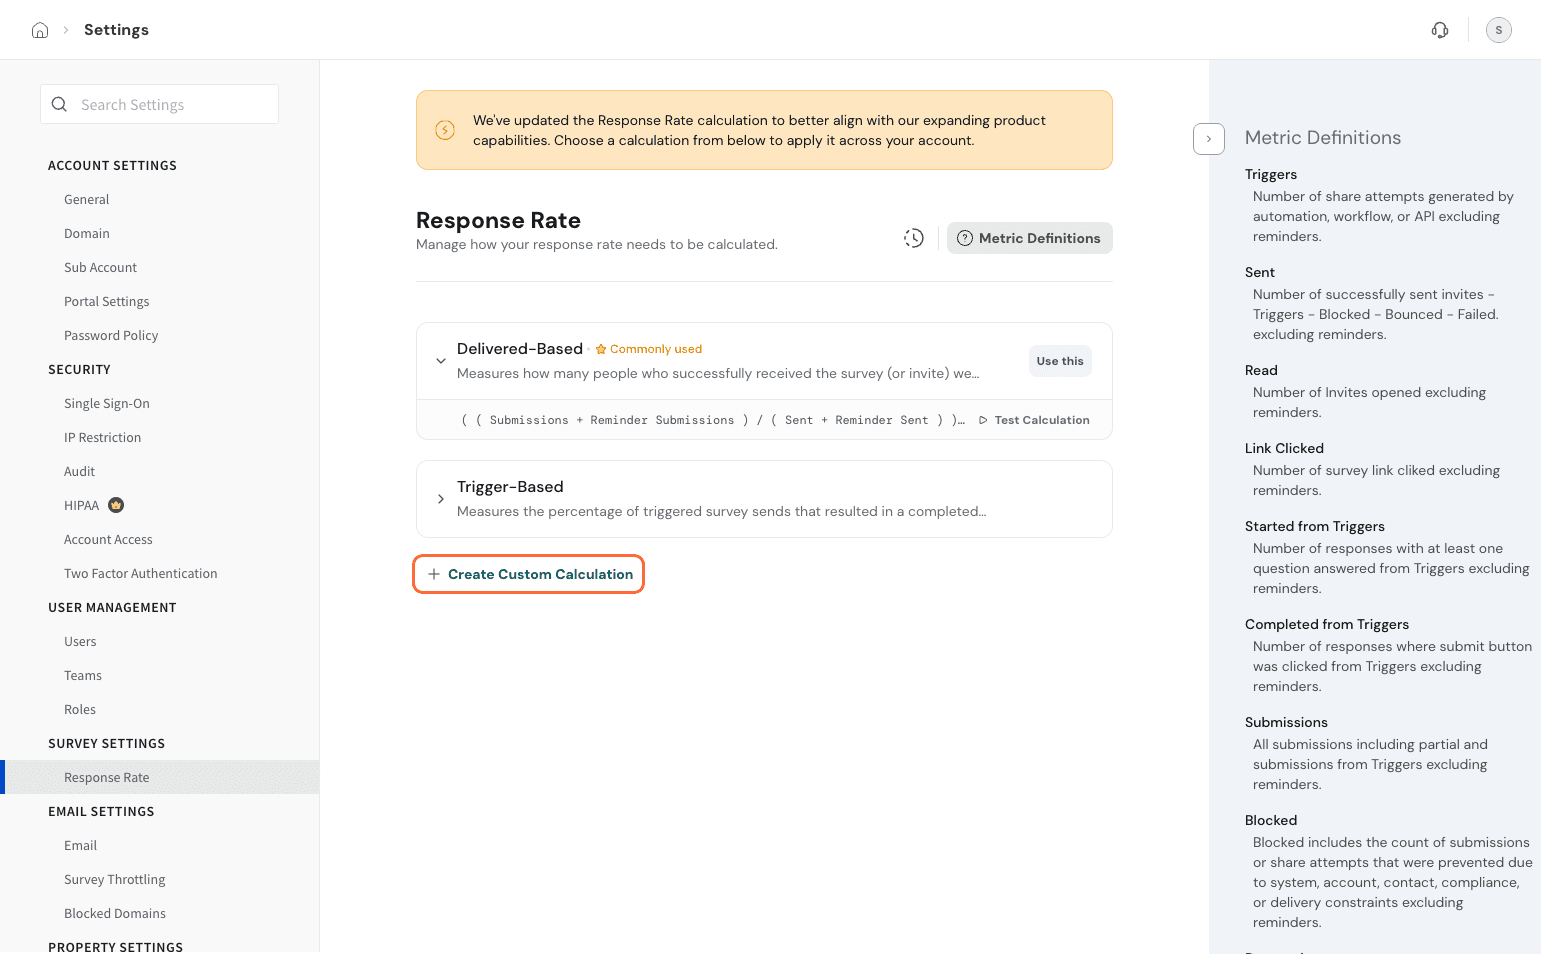
Note: You can only build one custom response rate for your account.
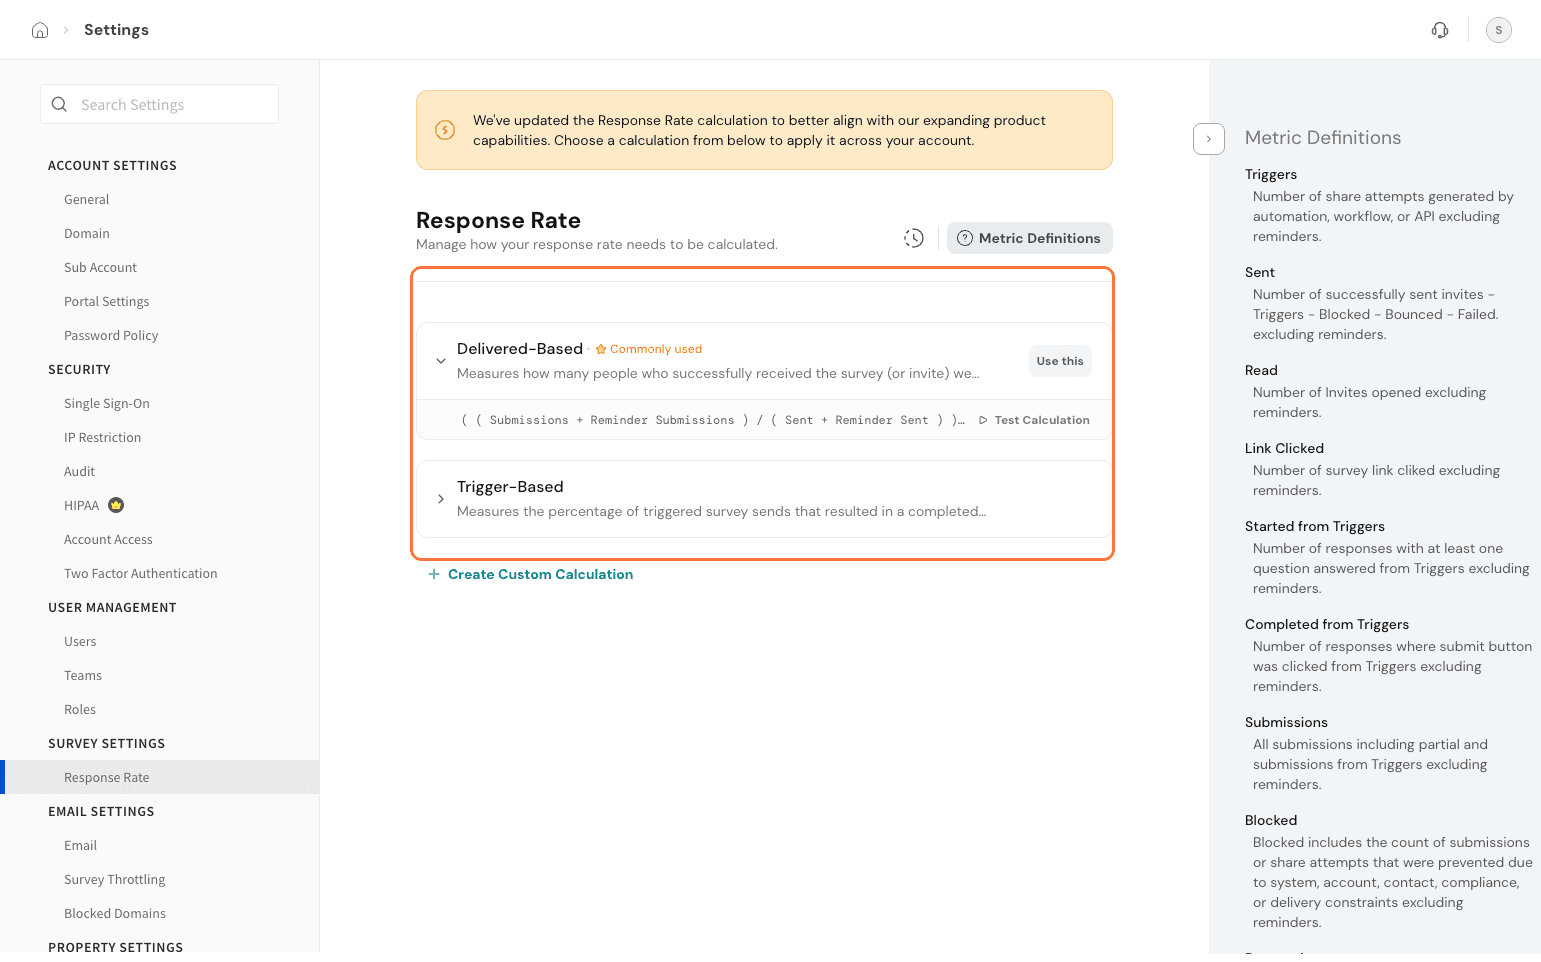
You have a tab open showing a numerator and a denominator. Total submissions are there on numerator by default; you can choose to customise if needed. You can choose from the following submission-based metrics for your numerator.
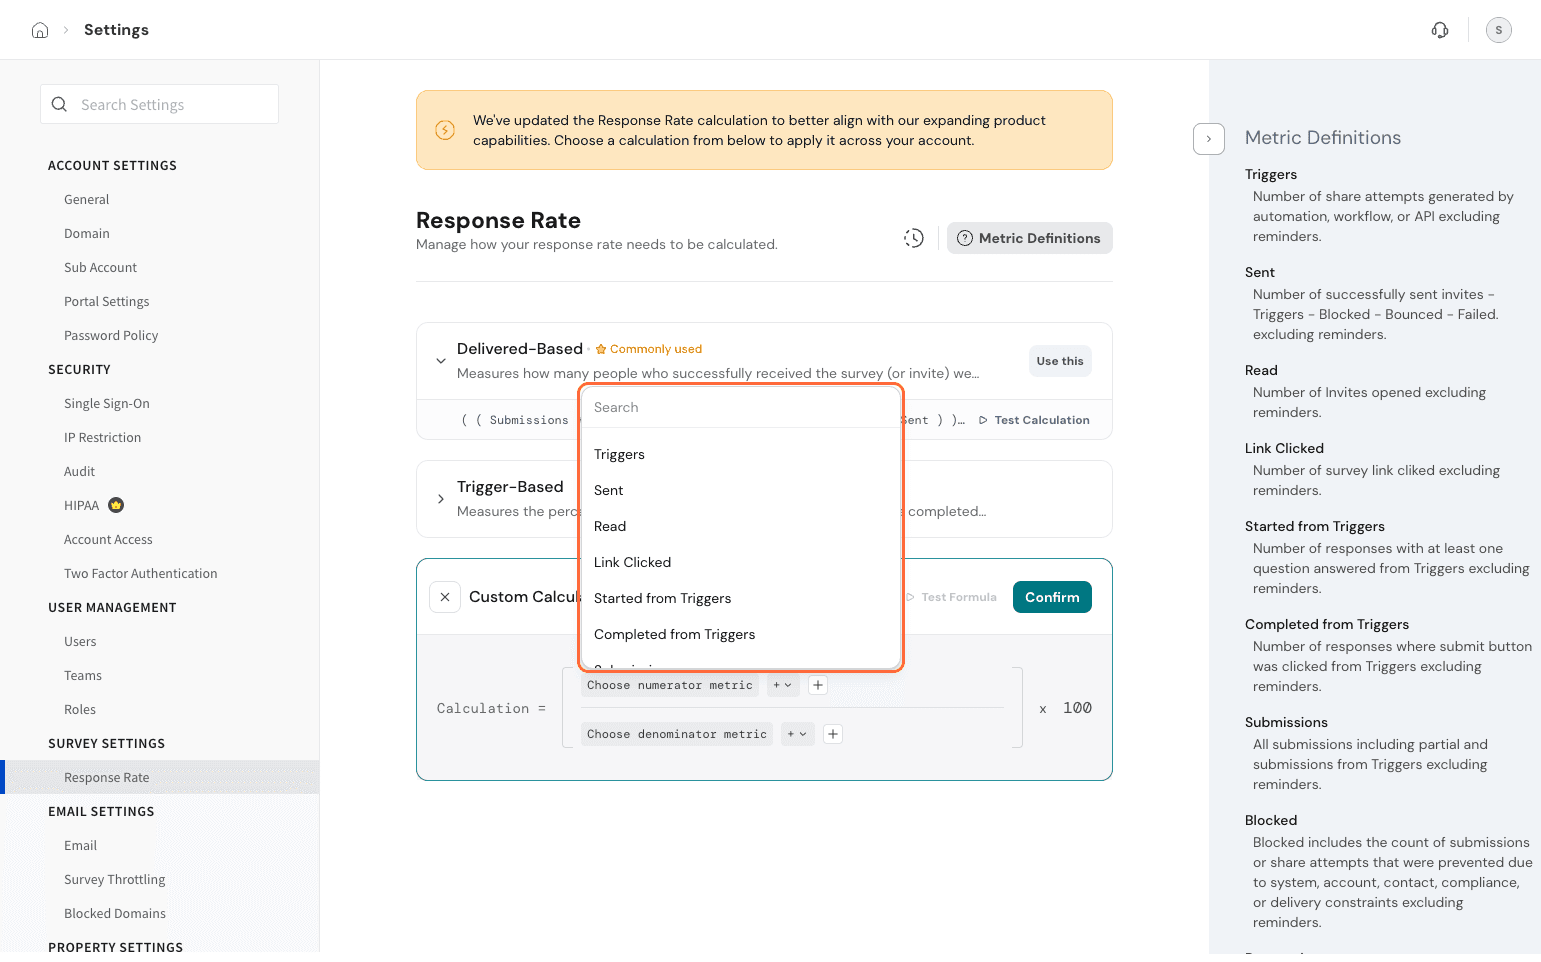
Pick the metric needed for the denominator by tapping on the plus icon. Typically, delivery or engagement-based metrics are preferred for the denominator.
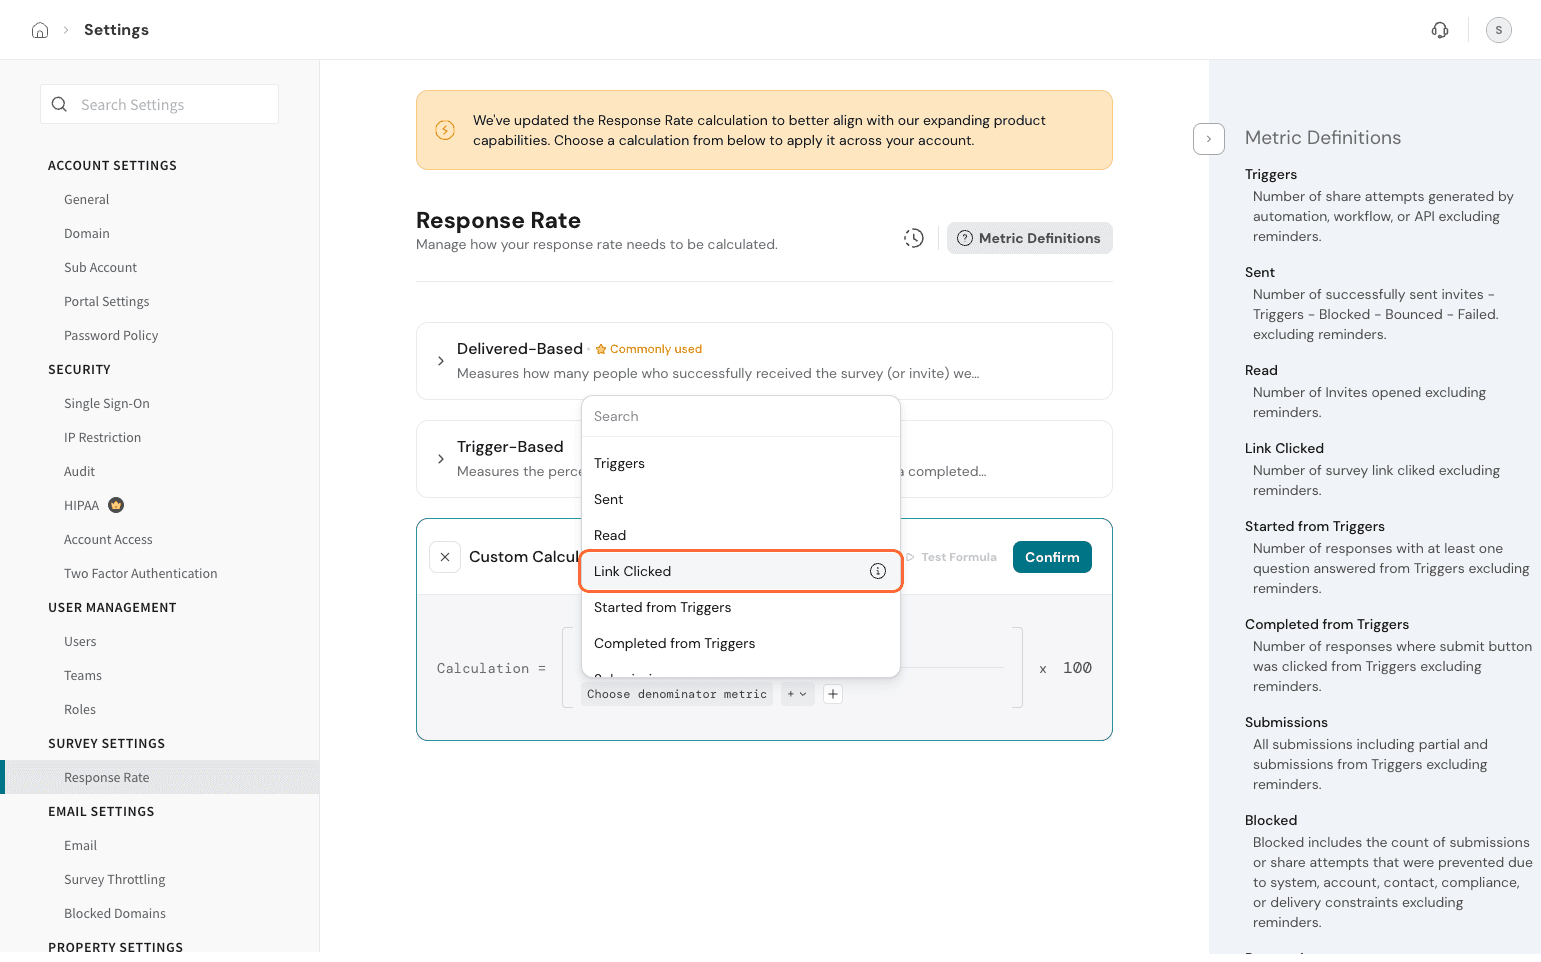
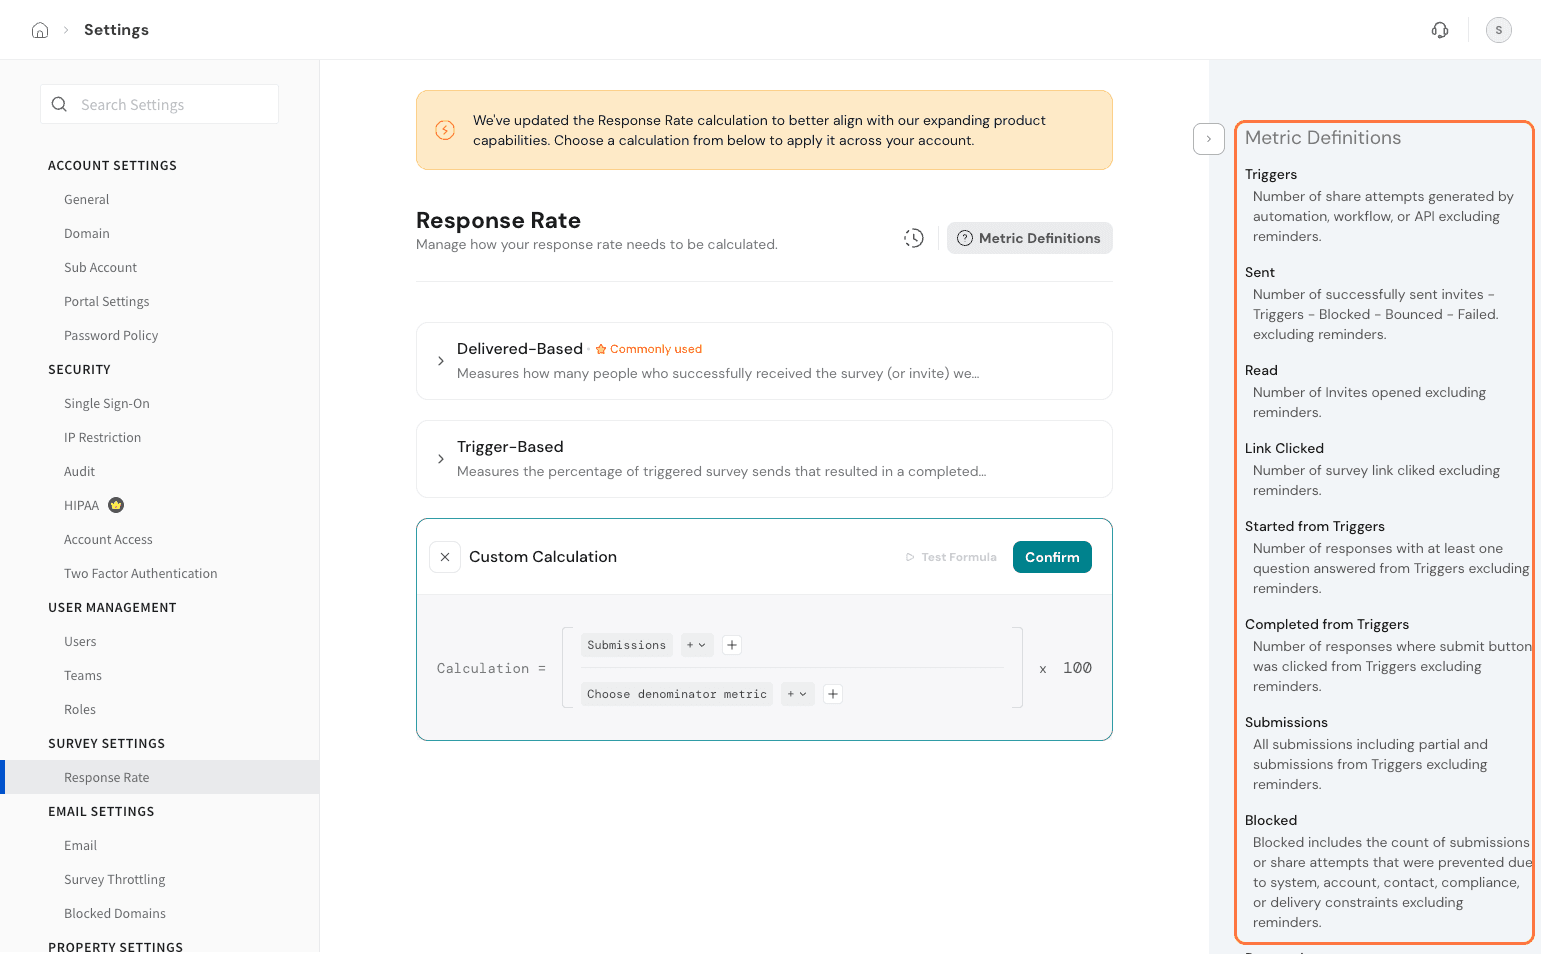
You have the metrics definitions available in the side panel to peruse and understand what they mean.
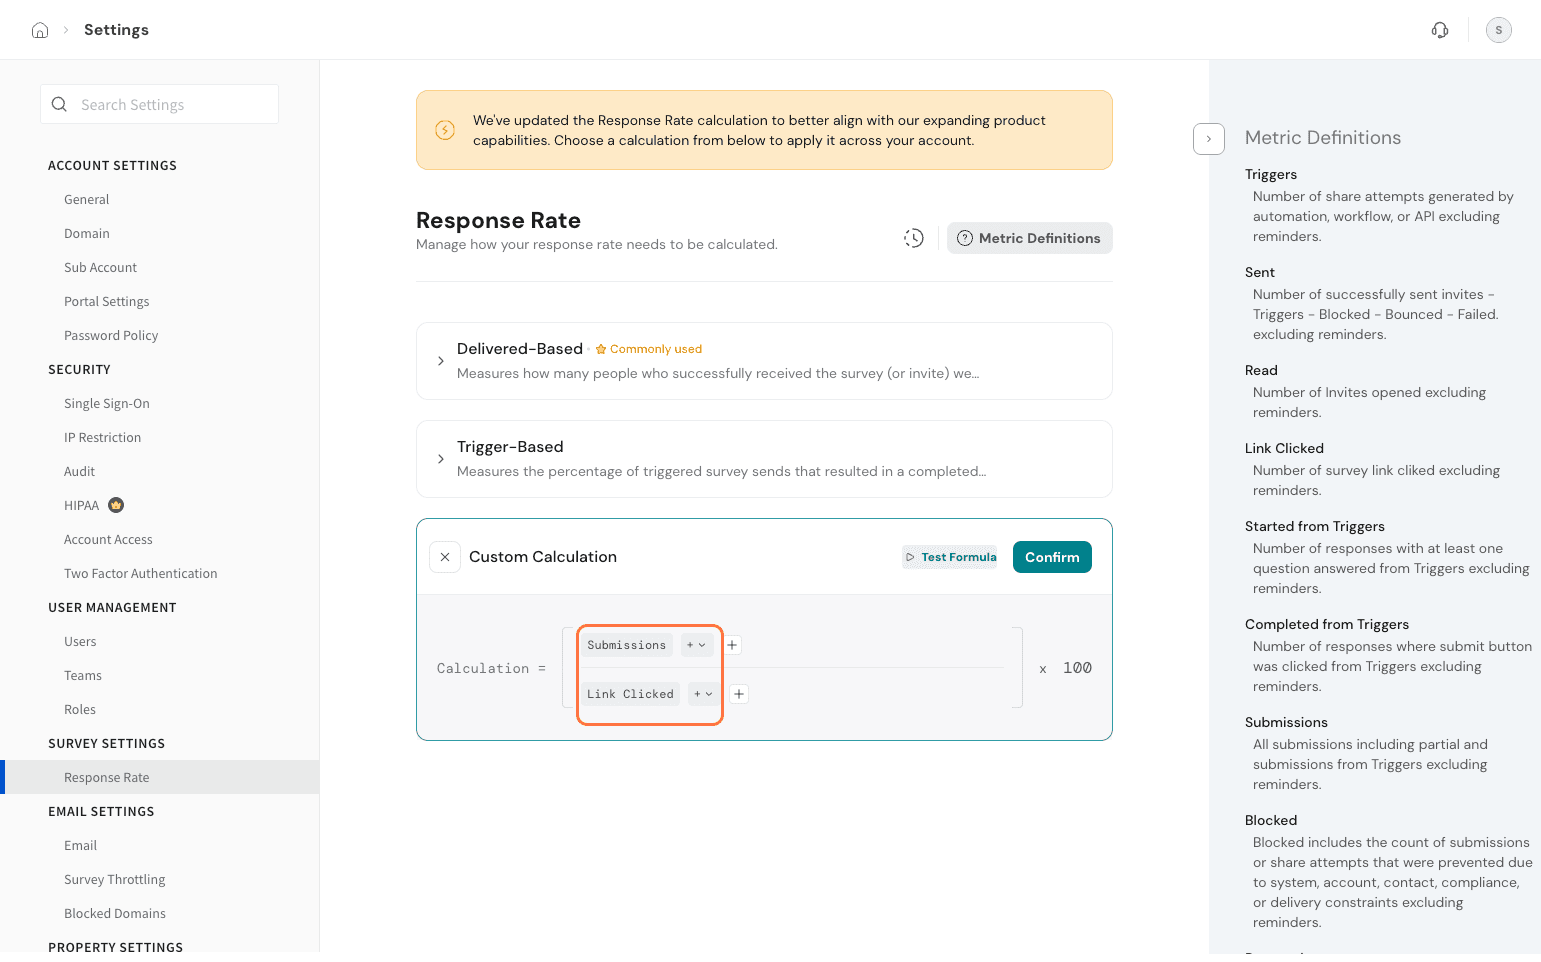
Here, we can customise our response rate as (Submissions/Links Clicked)*100
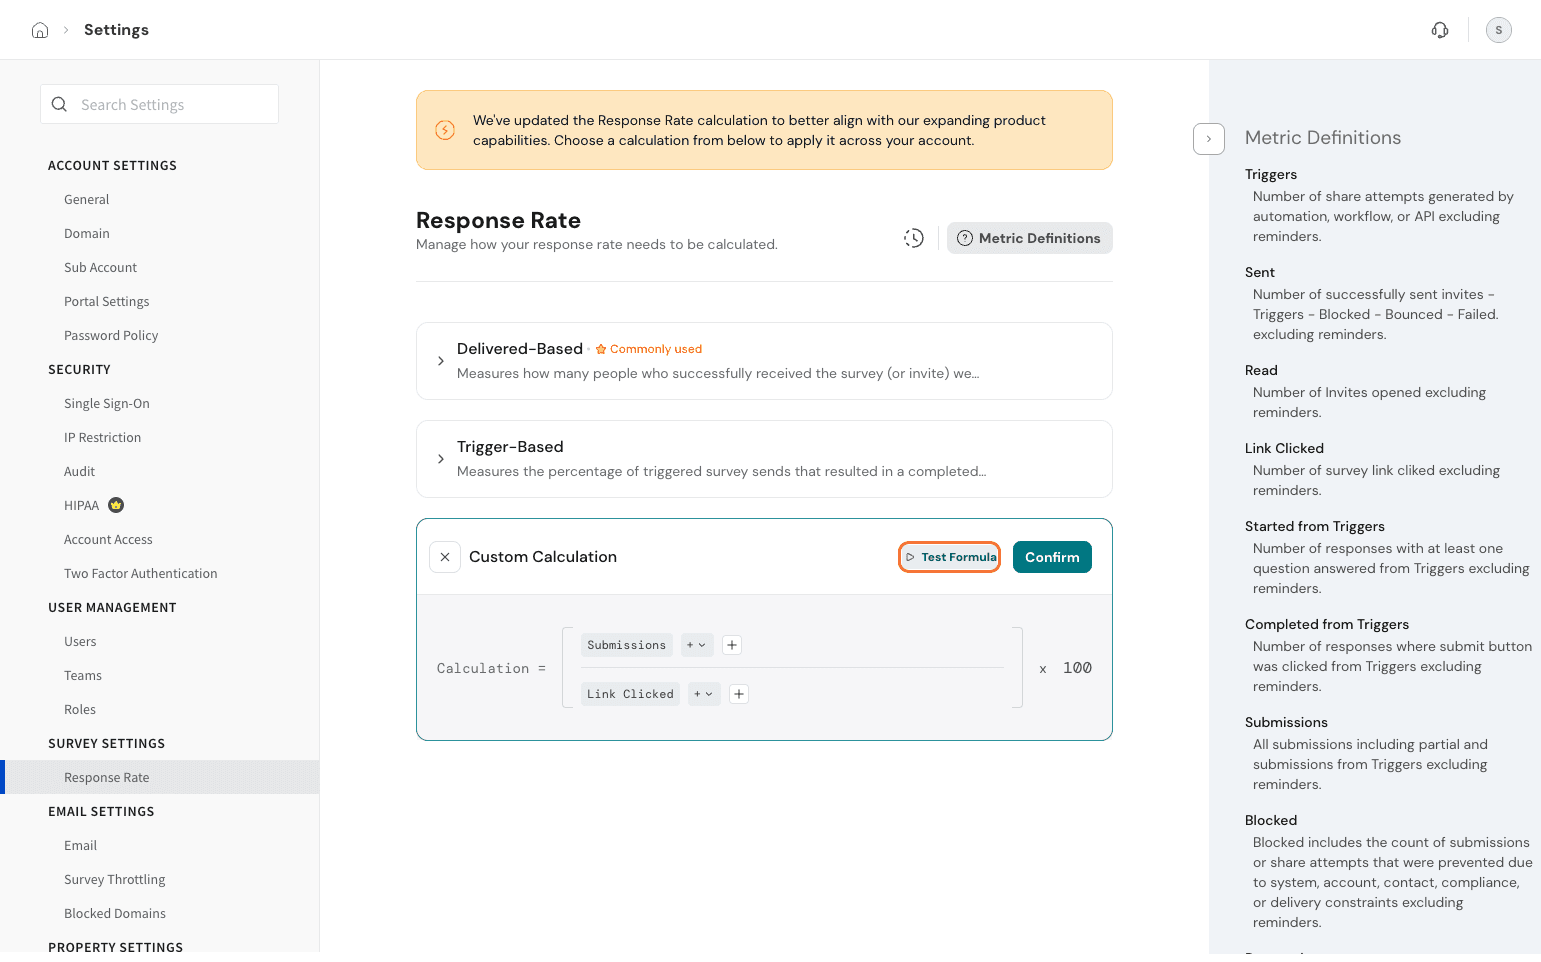
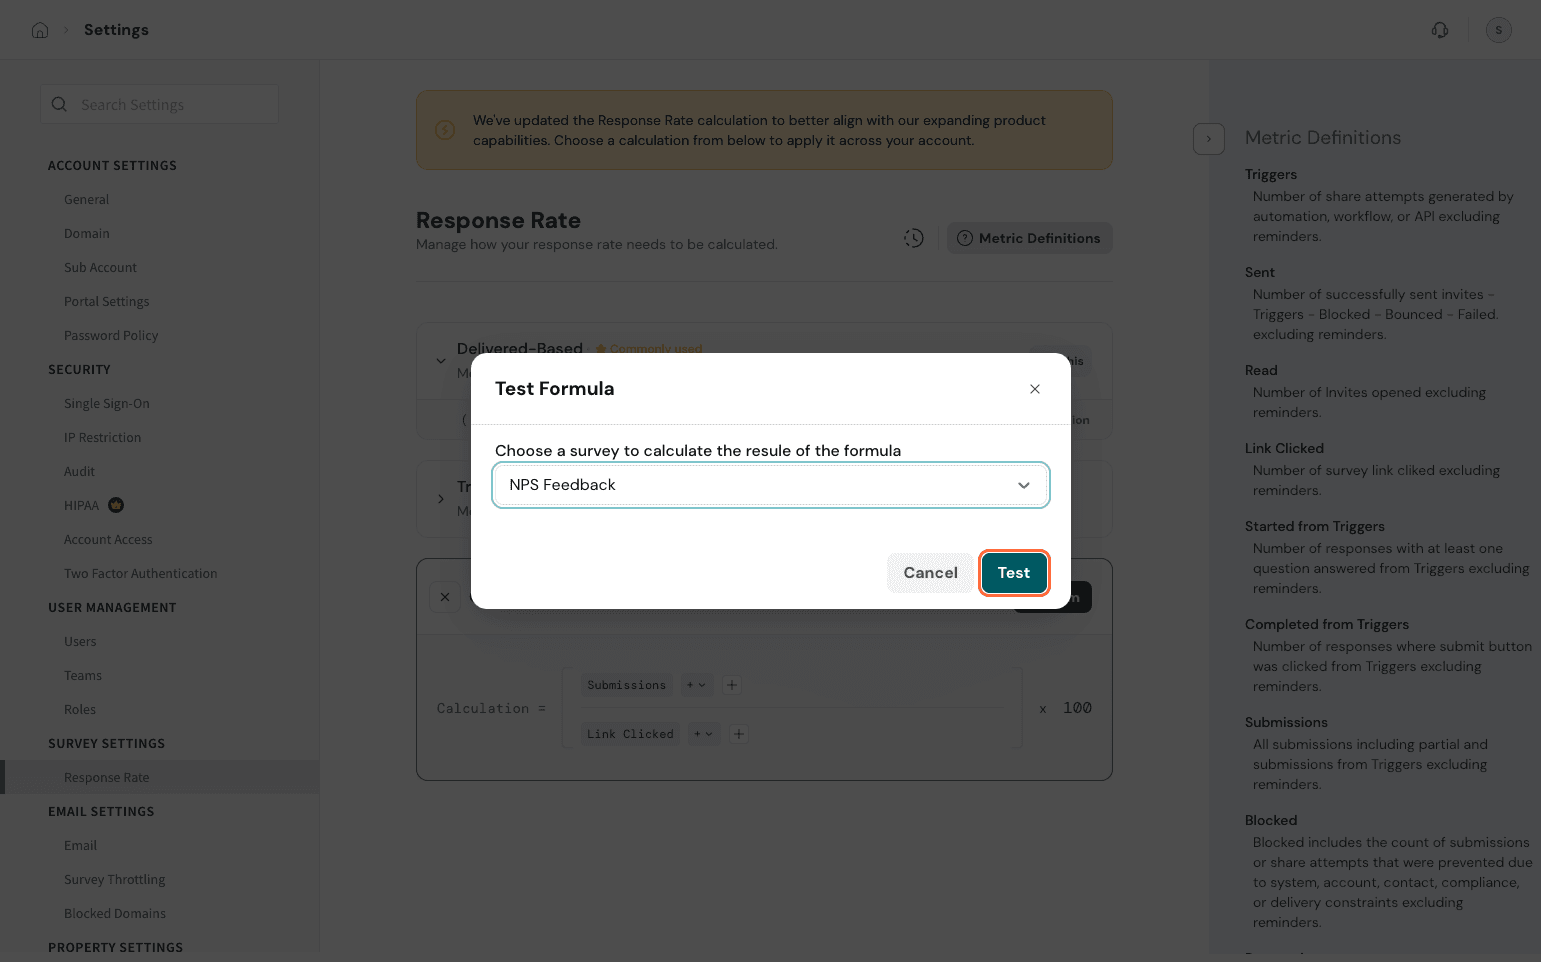
Once you define your custom response rate, you can test it once. Click on Test Calculation.
Pick a survey from the dropdown to validate your formula once. Click on Test.
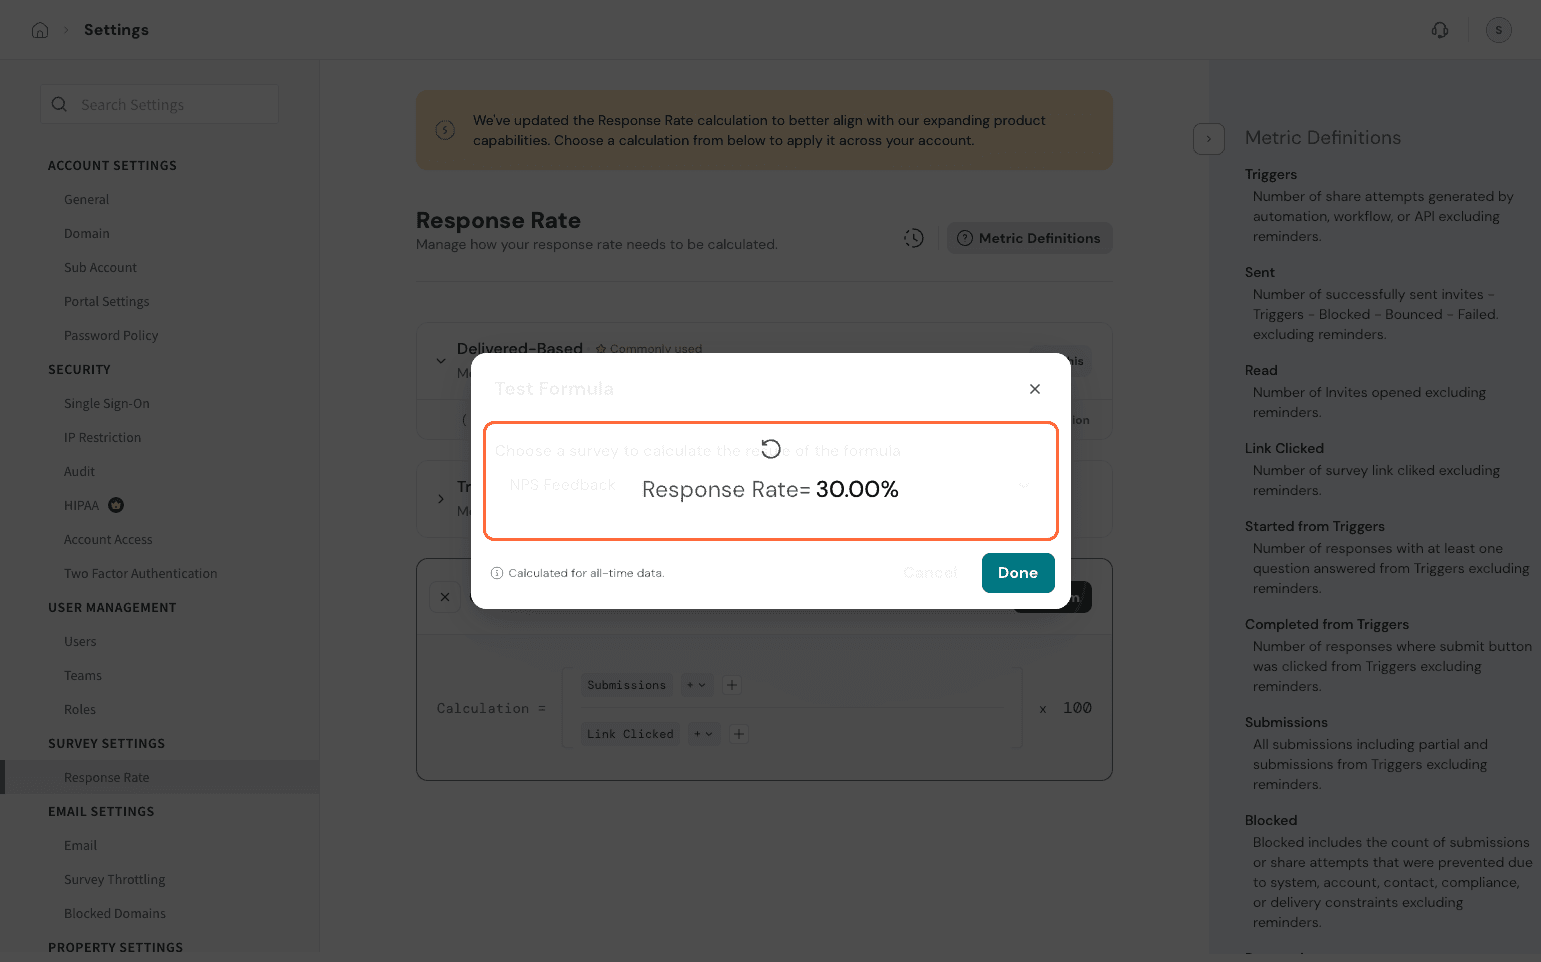
It will display the custom response rate as defined. Cross-verify it with the available stats once.
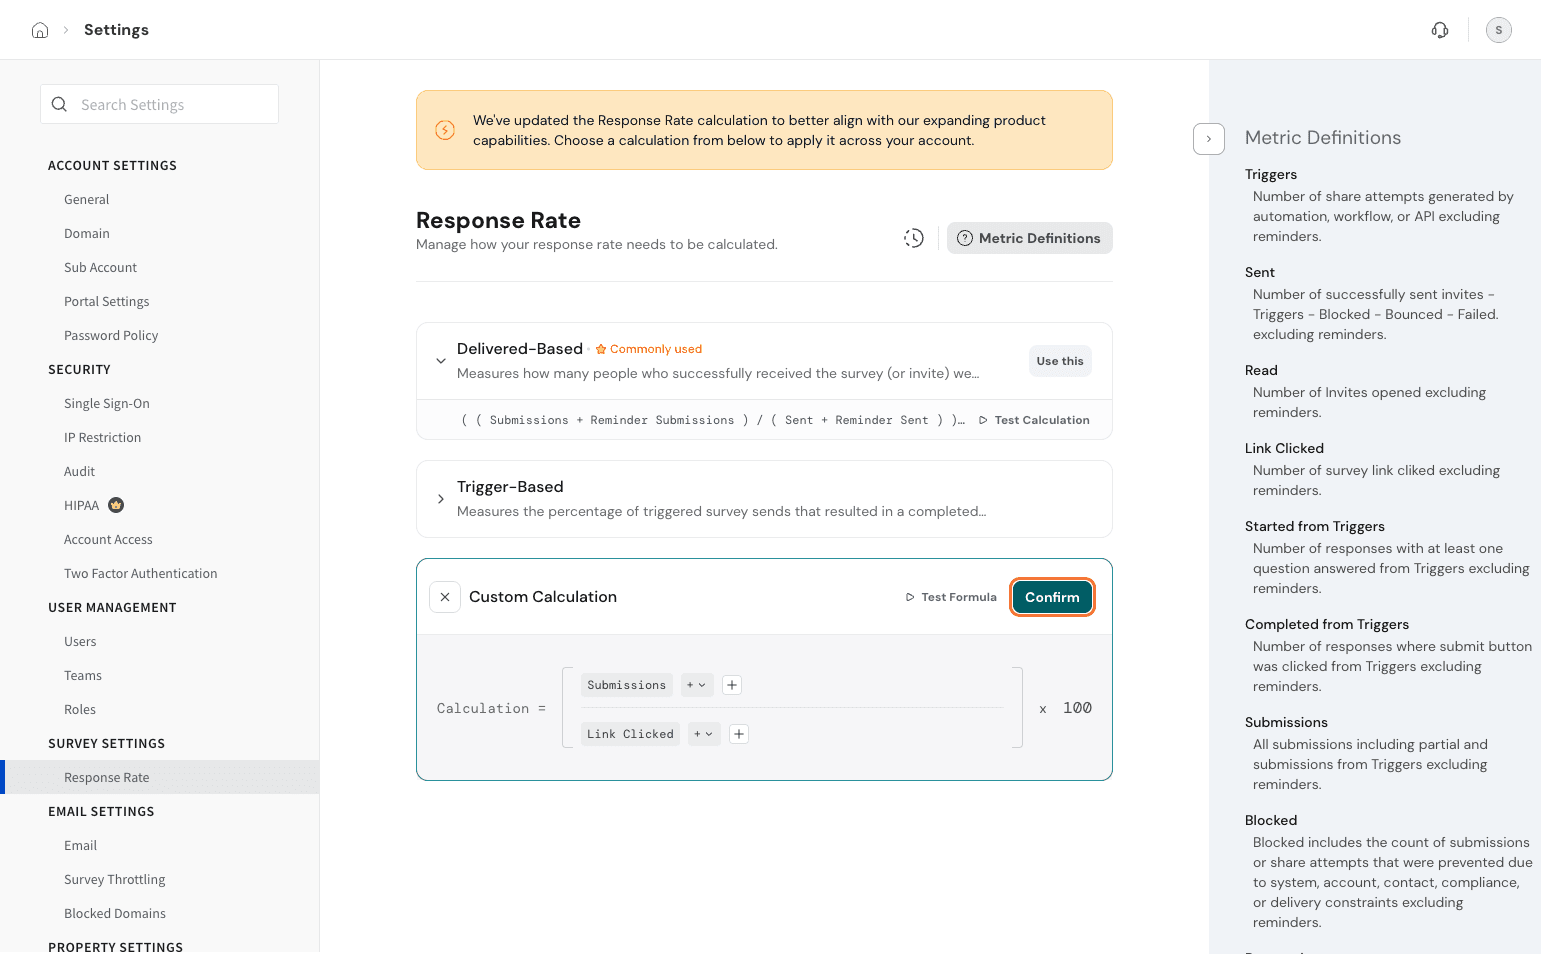
Once you are happy with your formula, click on confirm. Your custom calculation is created.
If you wish to make this your default, click on Use this.
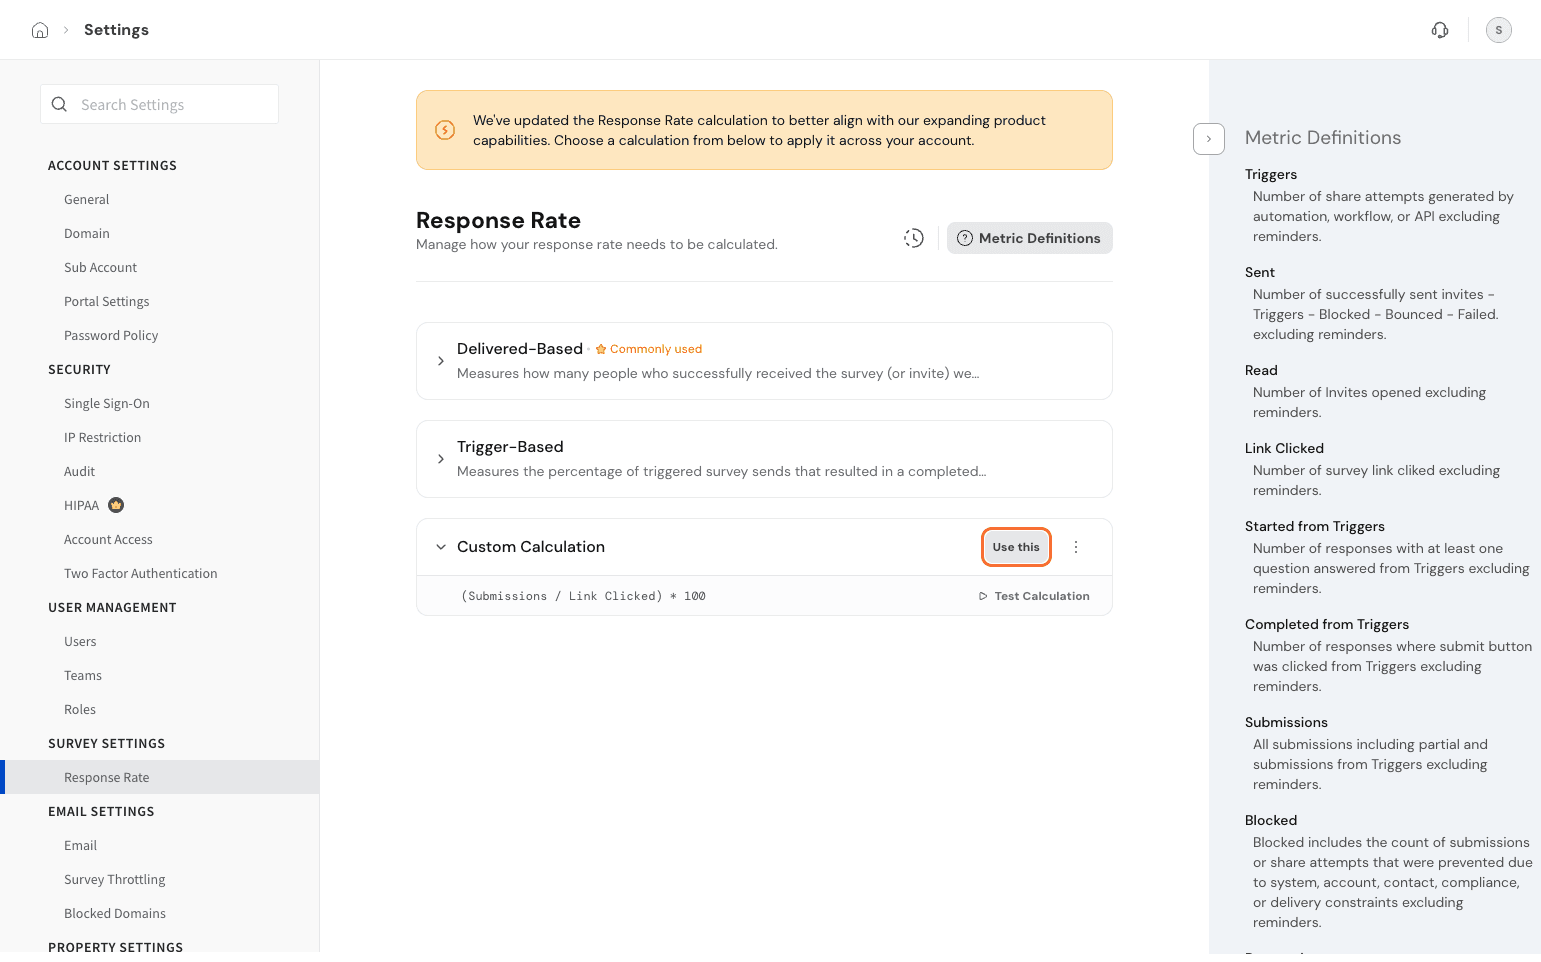
Confirm your choice in the pop-up, and you’re all set!
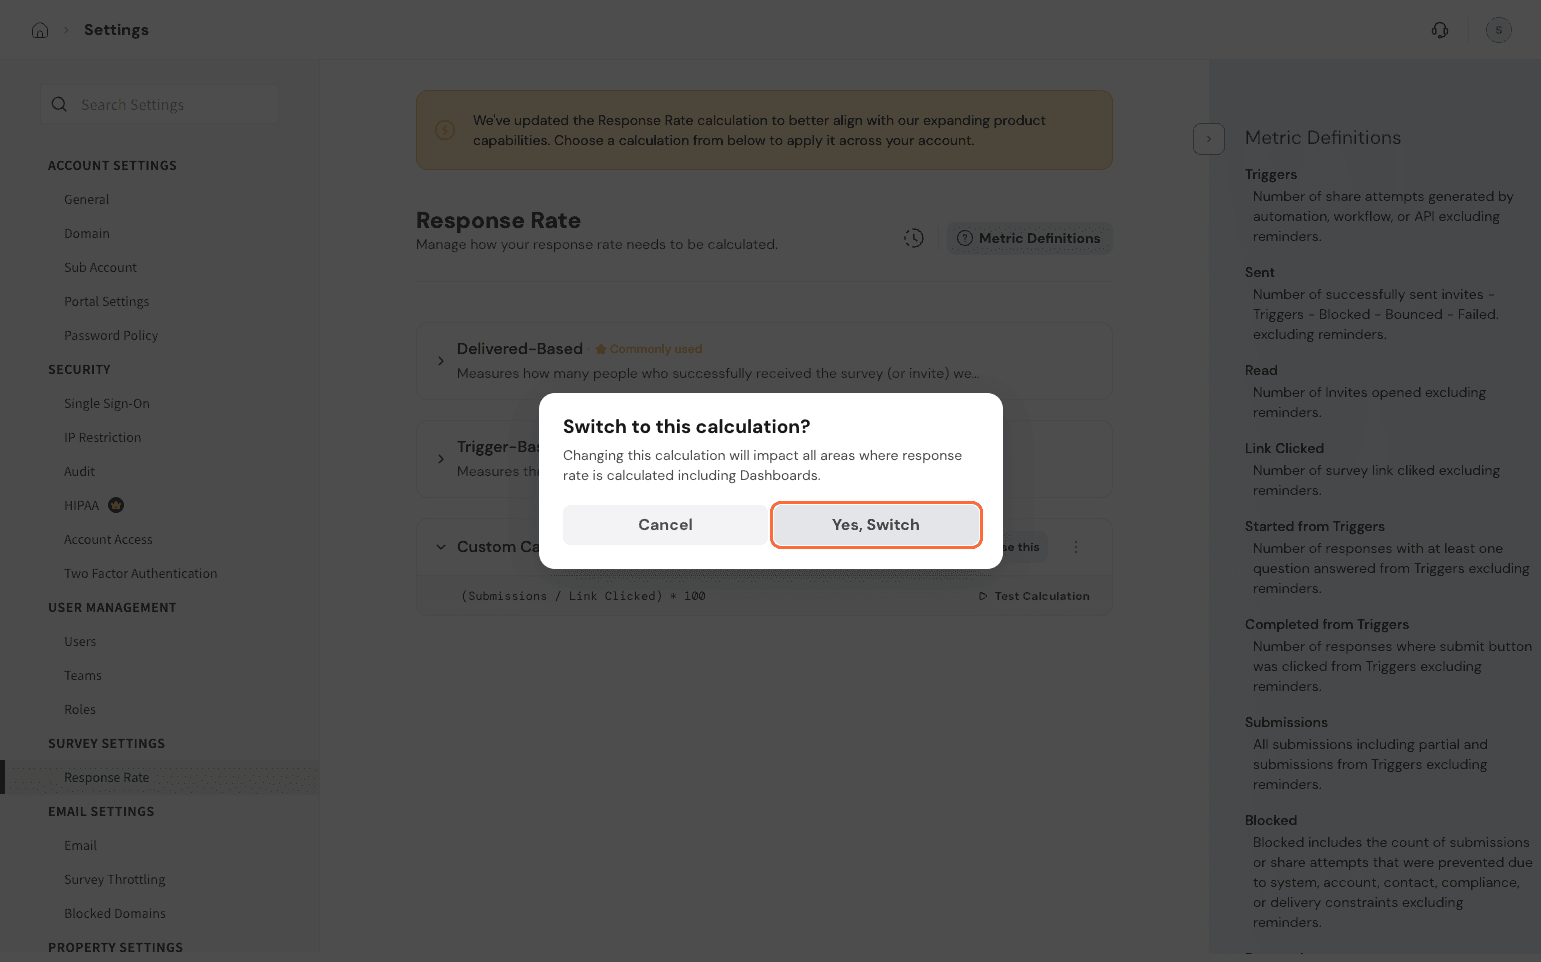
This will now be the default response rate calculation applied across your account.
You can always edit the calculation. Click on the 3 dots by the calculation.
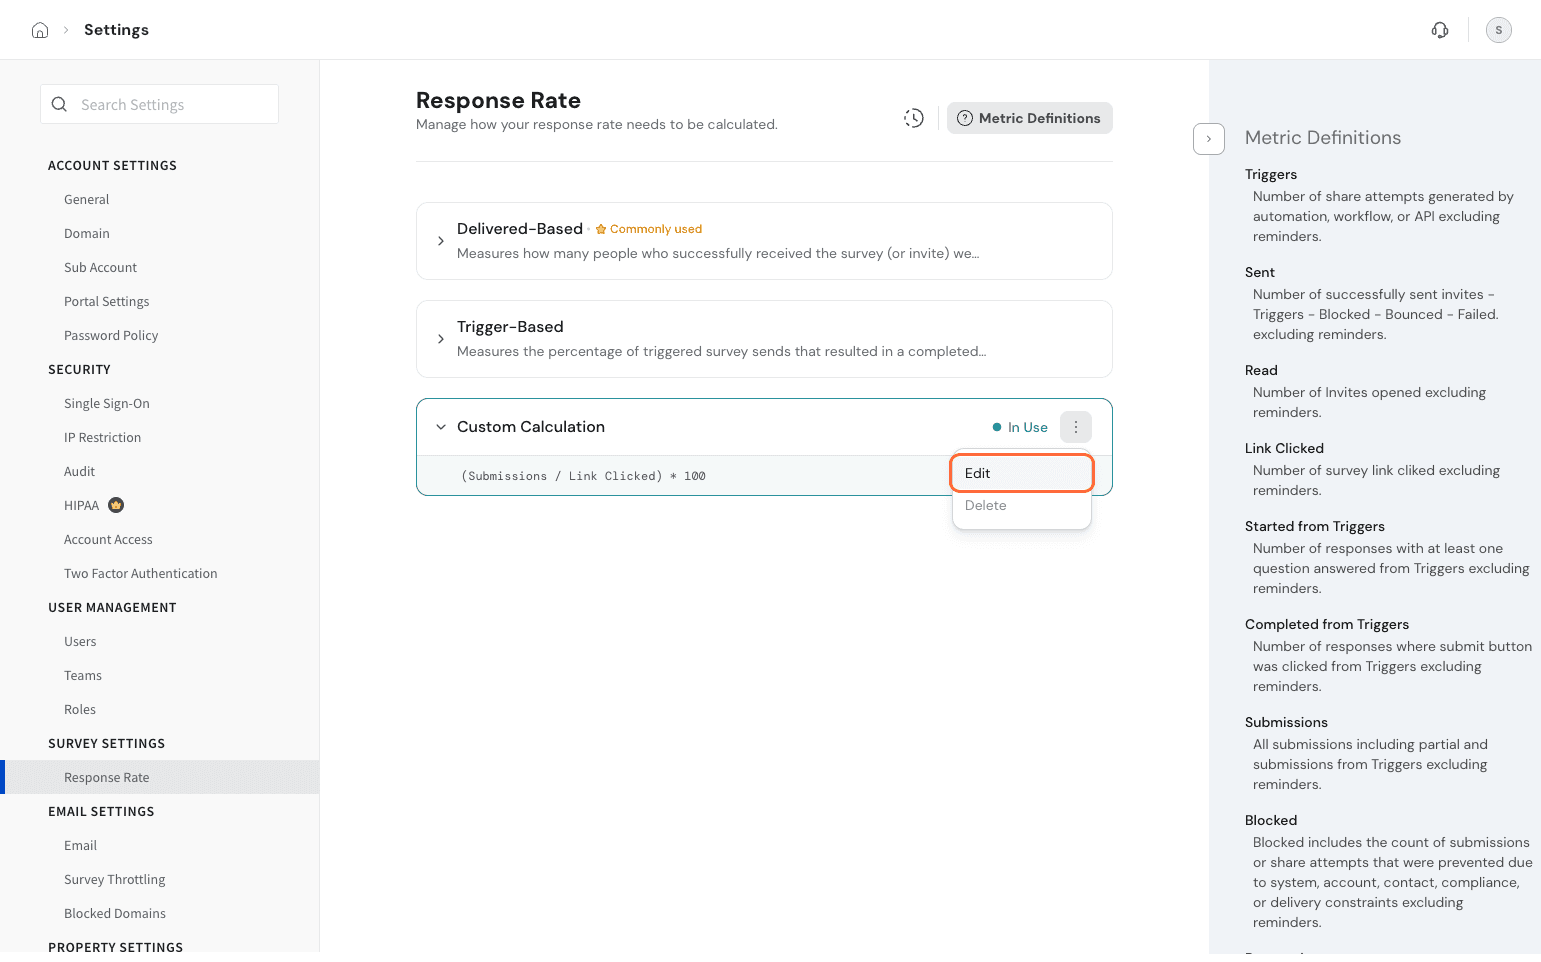
Select Edit and make changes to the calculation.
If you choose to delete it, you can do so as well. Select Delete from the options and delete the calculations. It will revert to the default calculation unless you switch to another calculation.
Note: You cannot delete the custom rate if it’s being used. Switch to another calculation, then proceed to delete the calculation.
We have an audit log available for tracking changes made, so the admins are in sync.
Click on the clock icon.
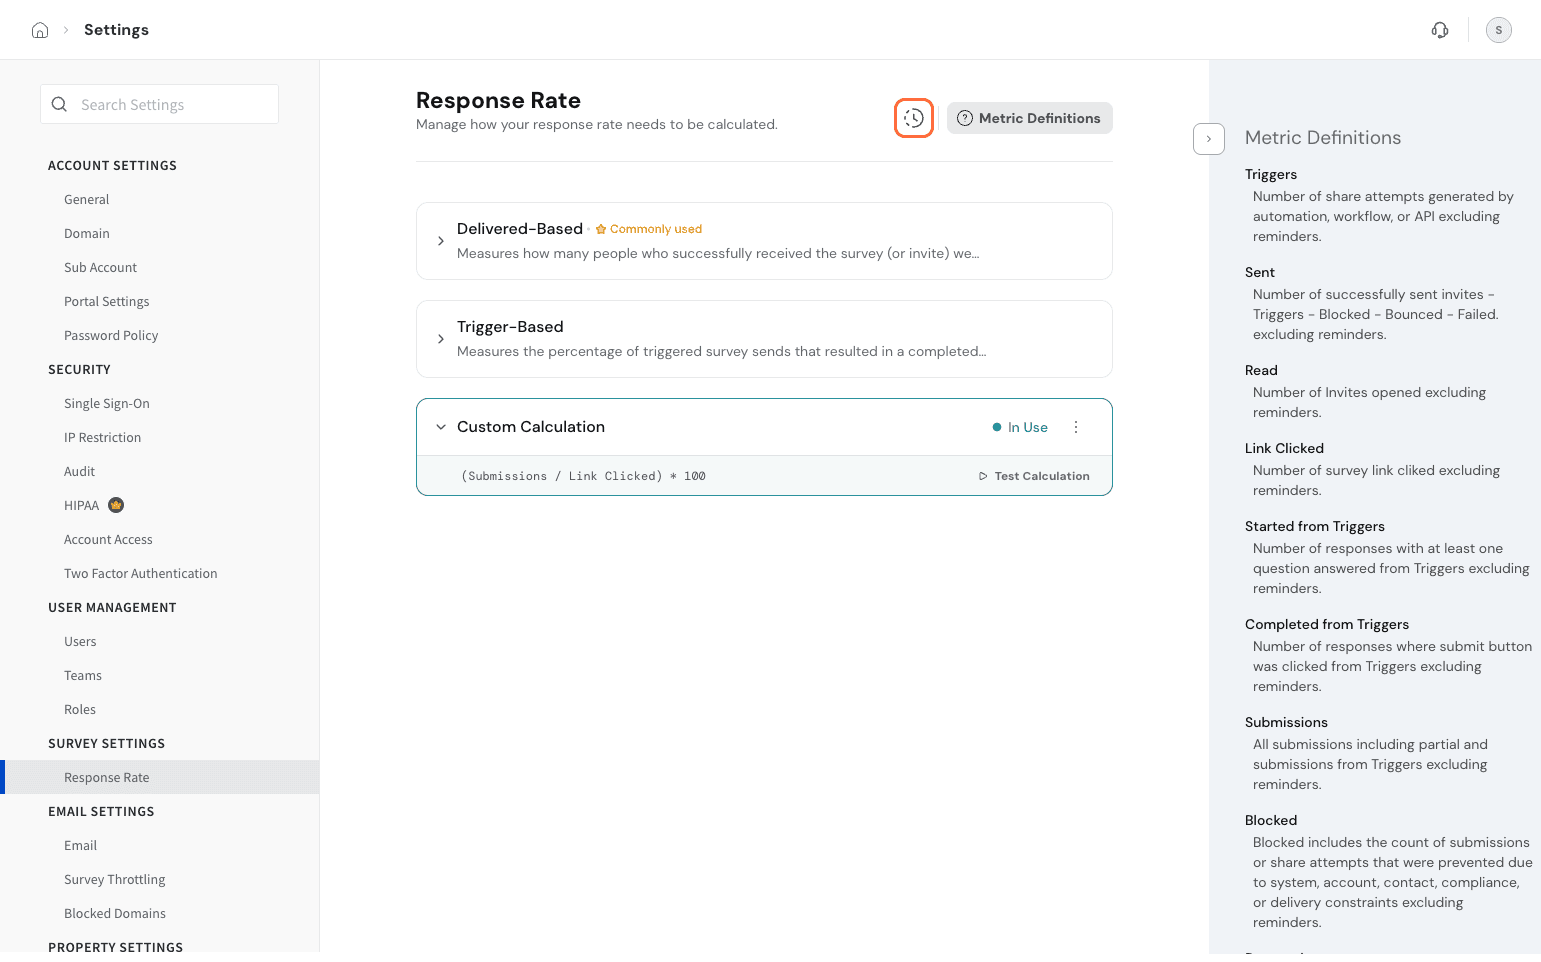
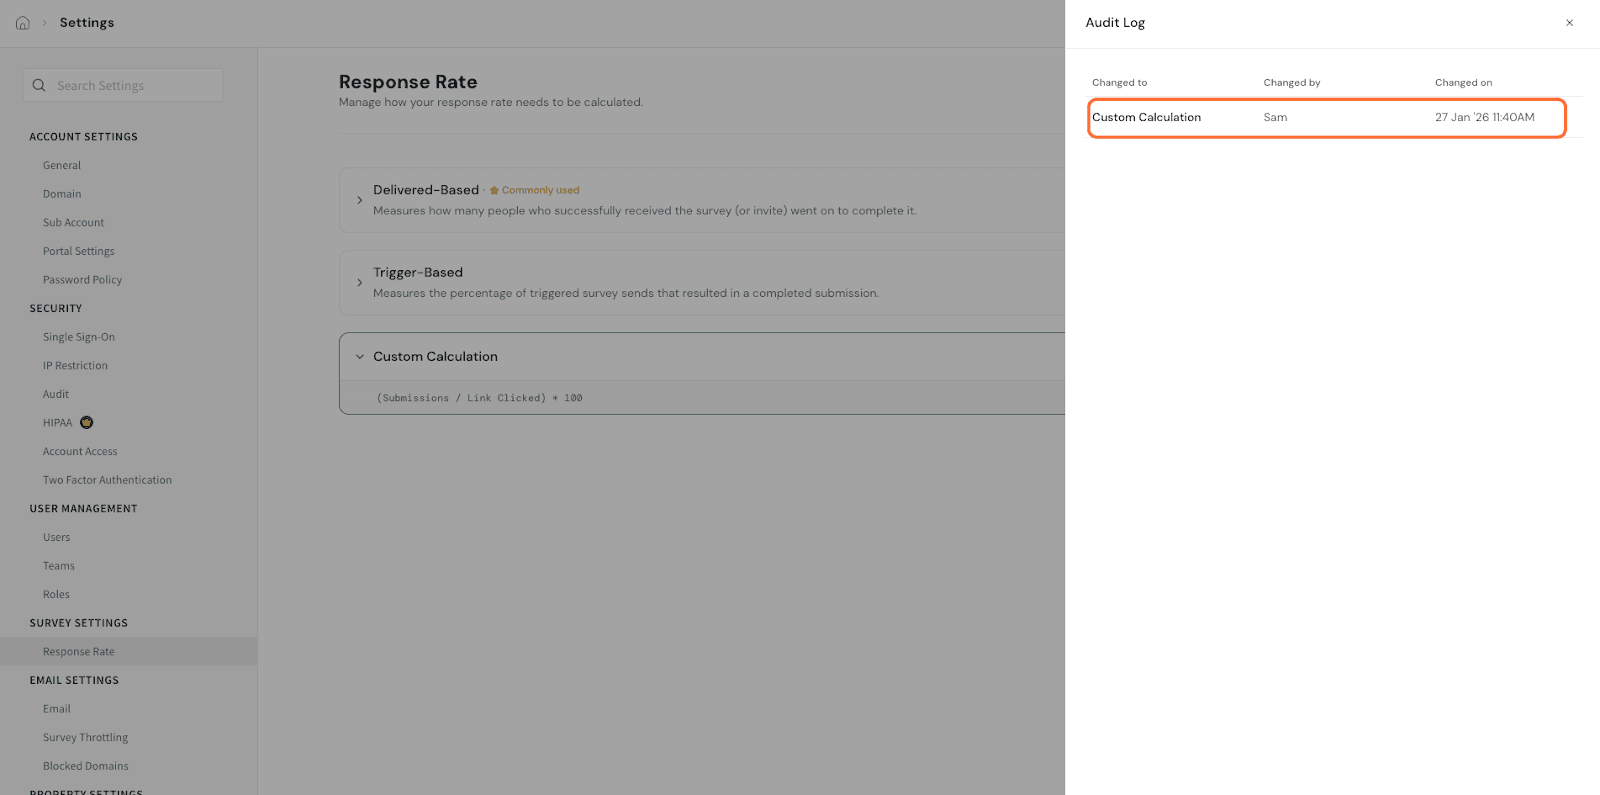
Here, you get the panel open that shows you the name of the user, what change was made, and the time.
Now, let’s look into how this applies in the dashboard.
The custom response rate calculation will apply to the KPI and Data Table widgets. This means that the data shown in existing widgets would be the custom response rate and not the default rate that was previously shown.
When selecting the KPI widget, in the drop-down, if response rate is chosen to be displayed, the account’s preferred custom response rate gets displayed.
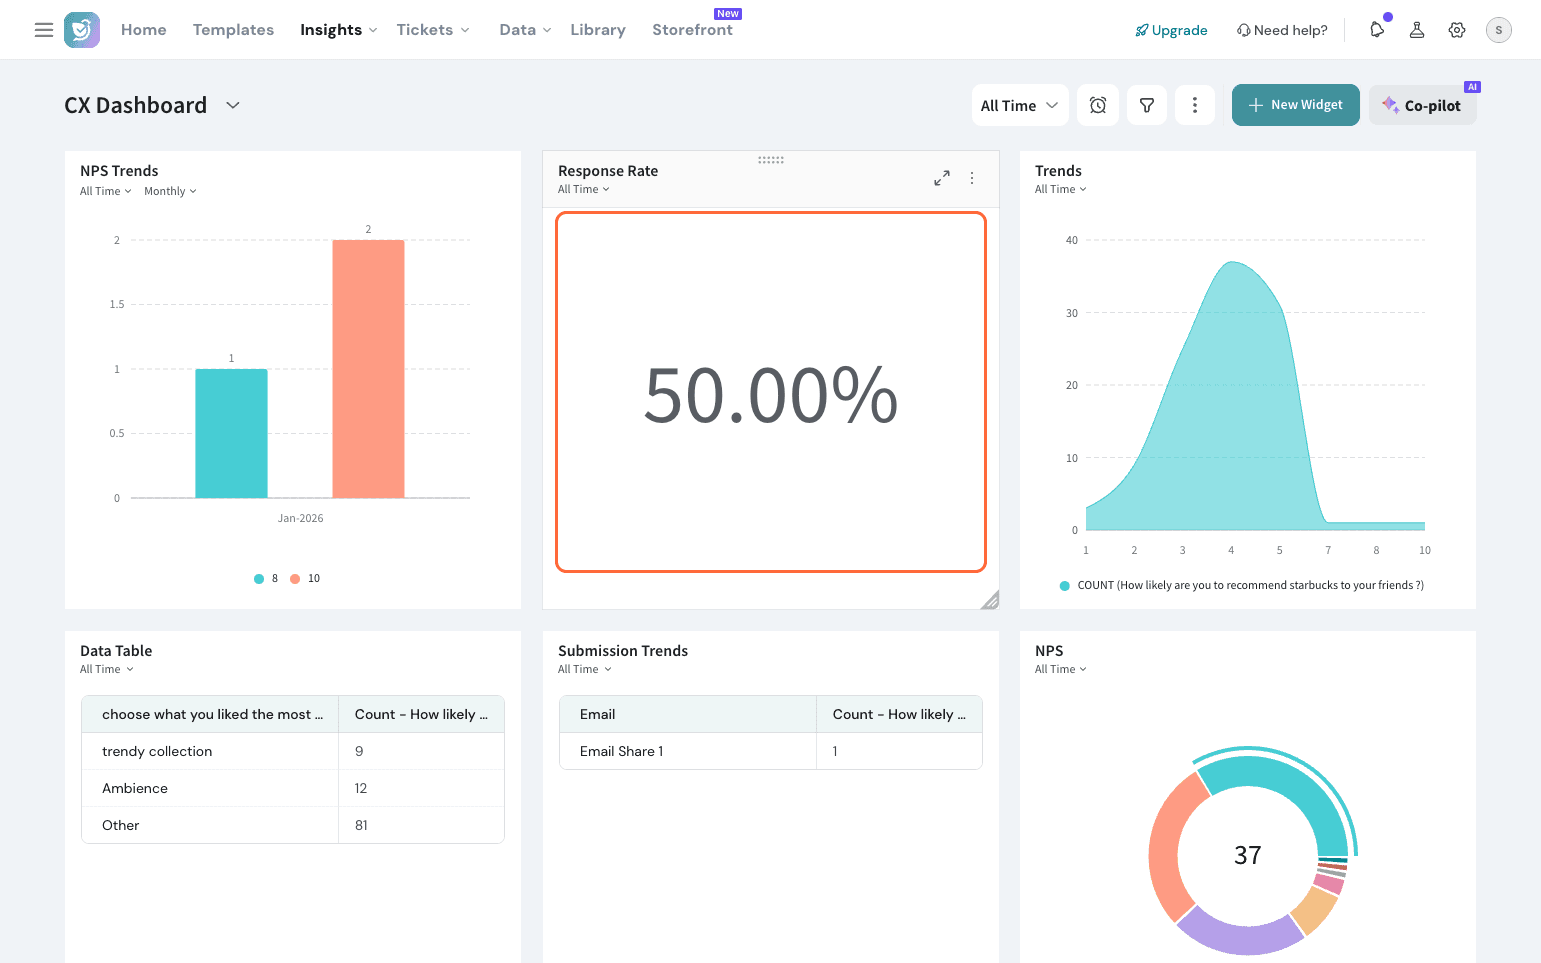
Let’s switch to a dashboard to see it in action.

Here, after the custom response rate gets applied, the response rate is changed and reflected as 50%.
In case of Data Table:
Under the Share Metrics dropdown, the response rate option would show the custom response rate applied for the account.
Now, when building your custom metric in the dashboard, you have an additional filter of custom response available. Let’s see how to use this.
Go to the 3 dots -> Select Custom Metrics
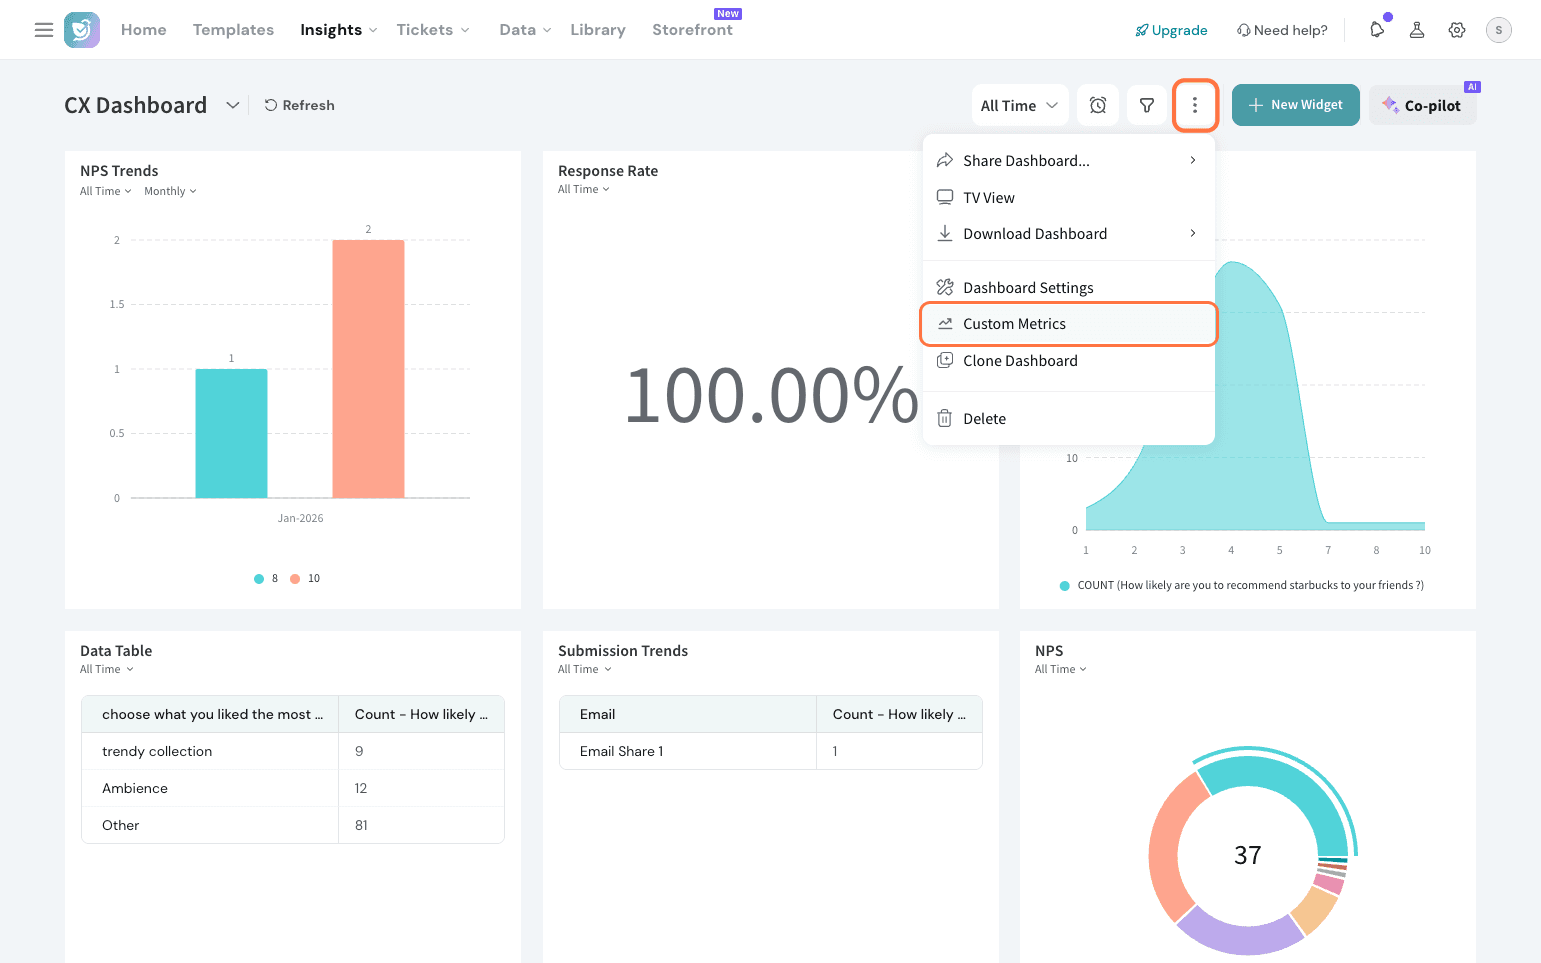
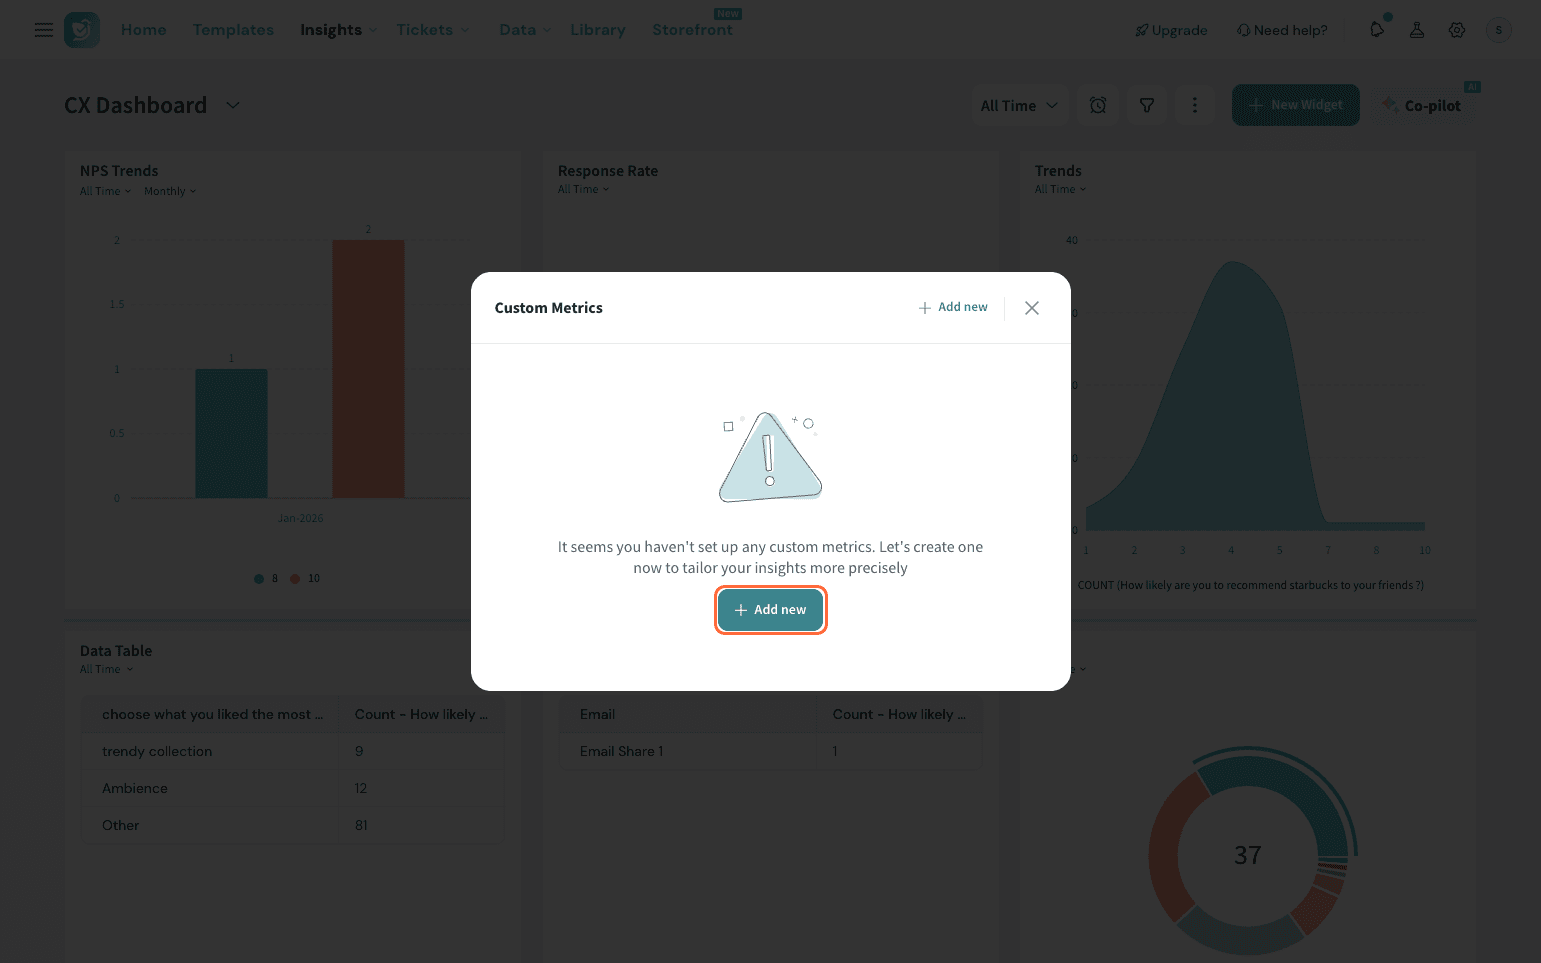
Click on New Custom Metric.
Choose share channels from the dropdown. Confirm if you need it for a specific dashboard or across dashboards.
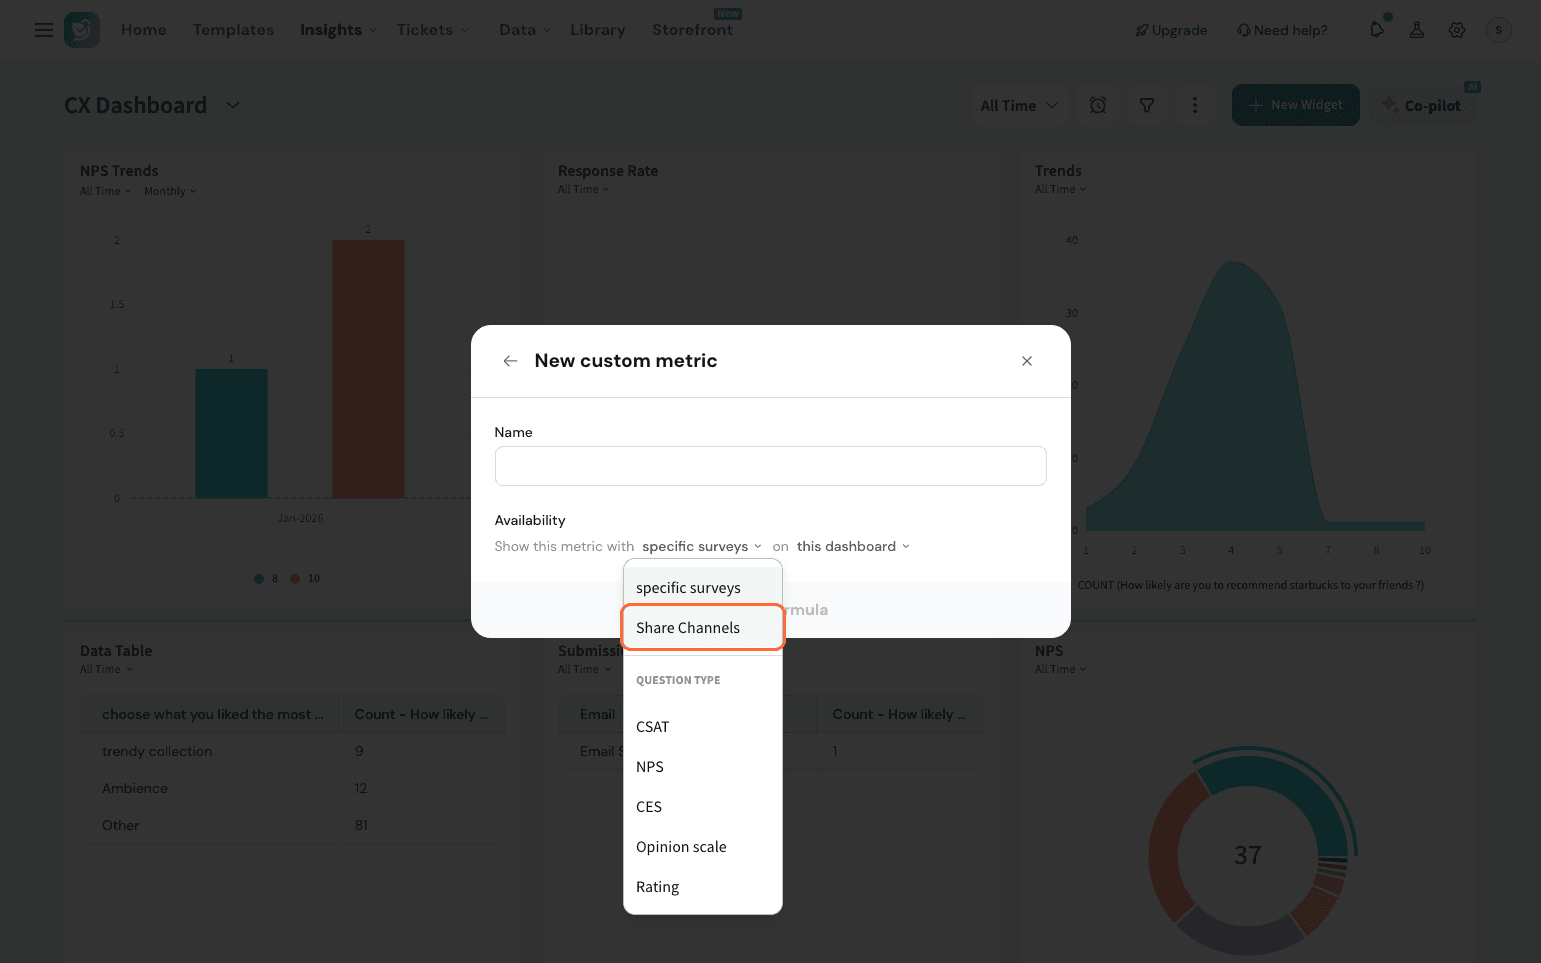
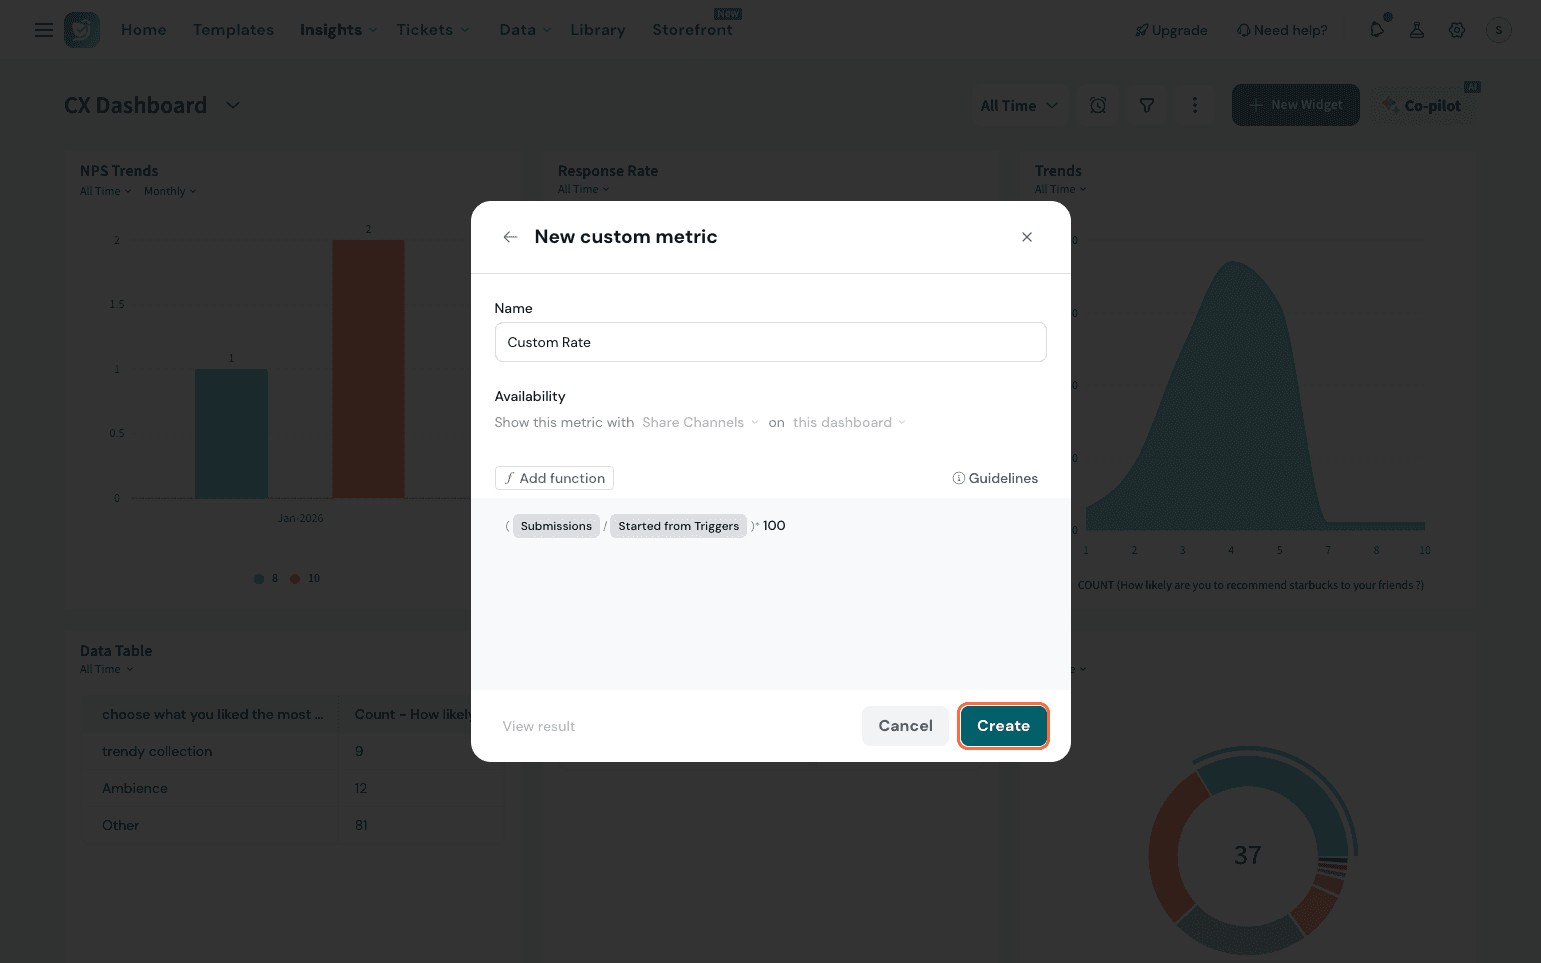
Now, build your custom calculation by picking a submission metric for the numerator and a denominator metric.
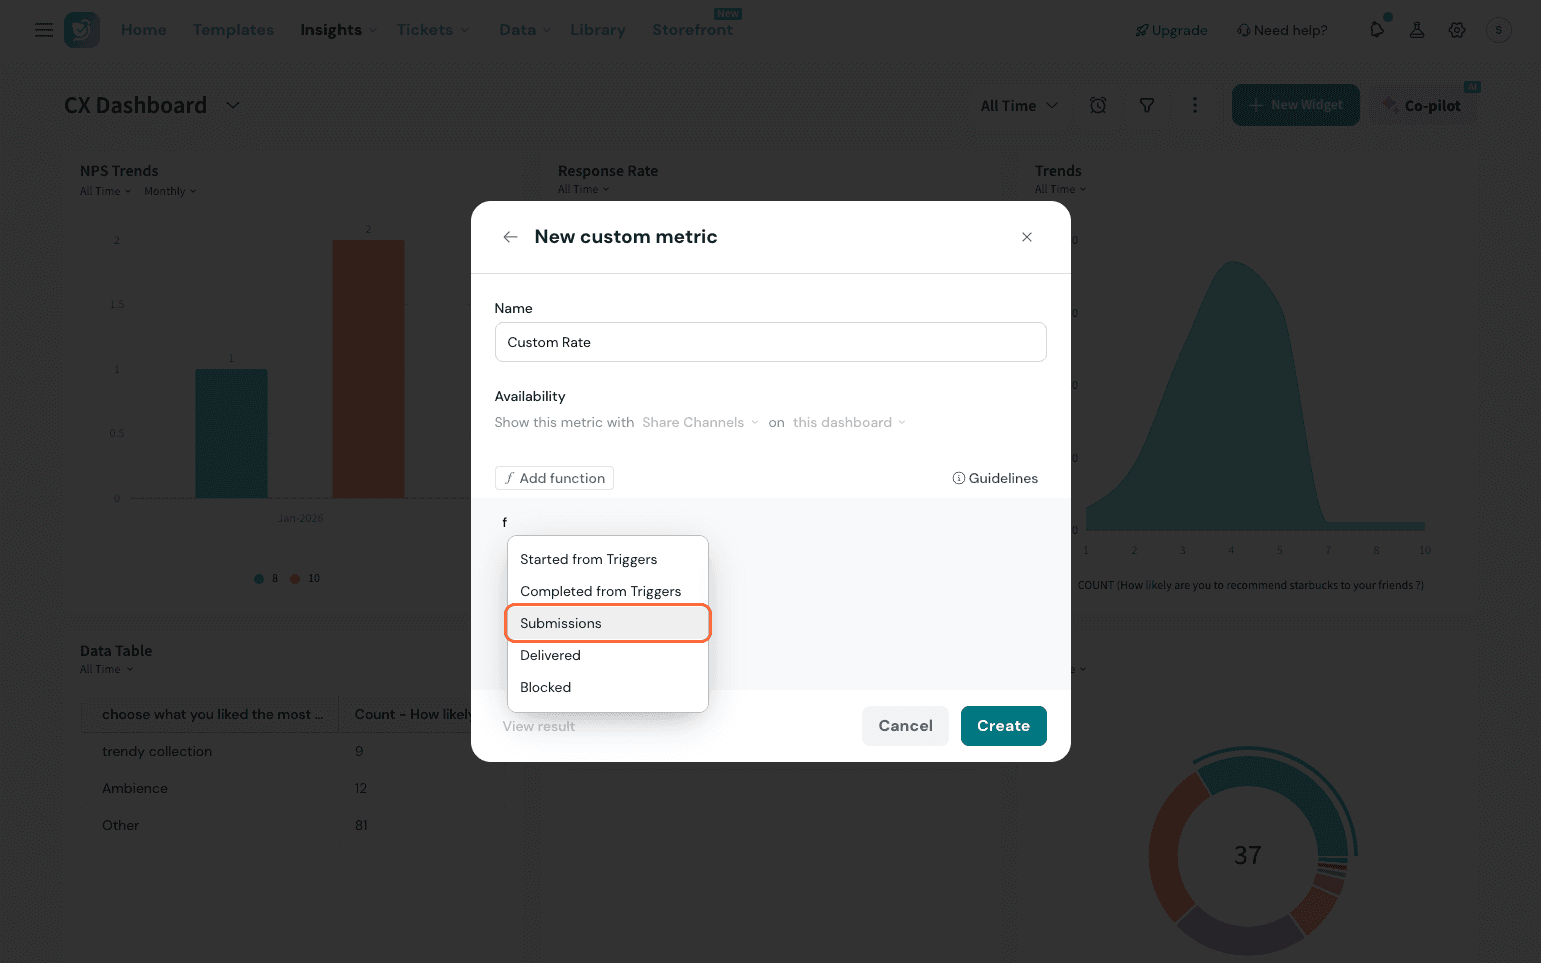
Test it once and then hit Create.
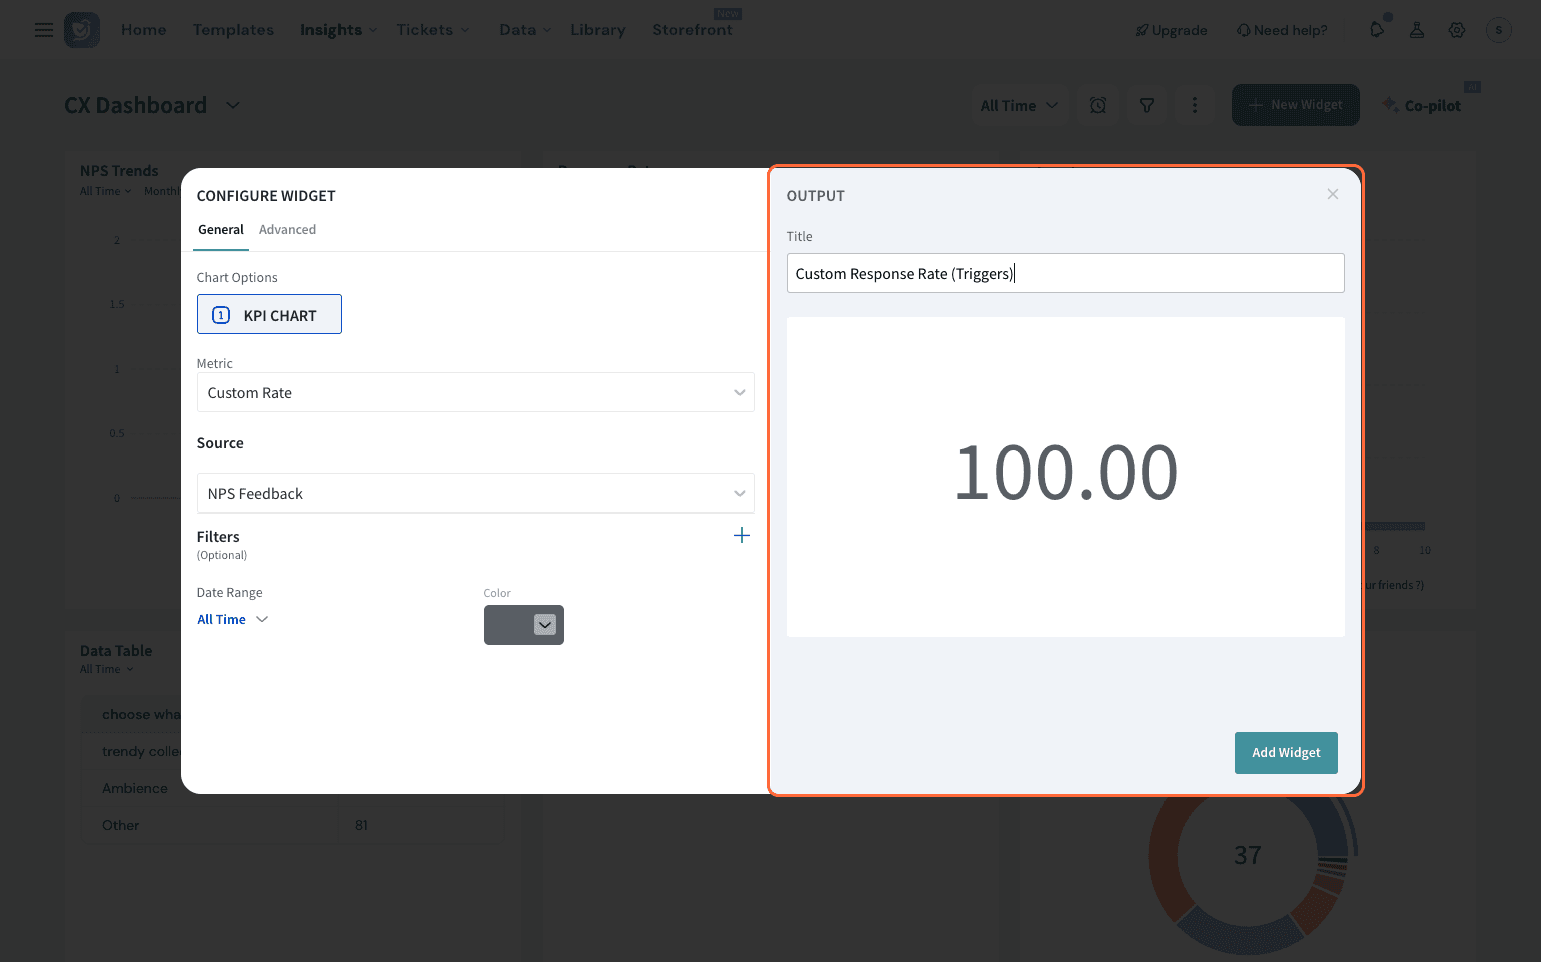
We can use this in widgets in the Executive Dashboard. Here, when creating a KPI Widget, the custom metric built using Custom Response Rate appears in the dropdown.
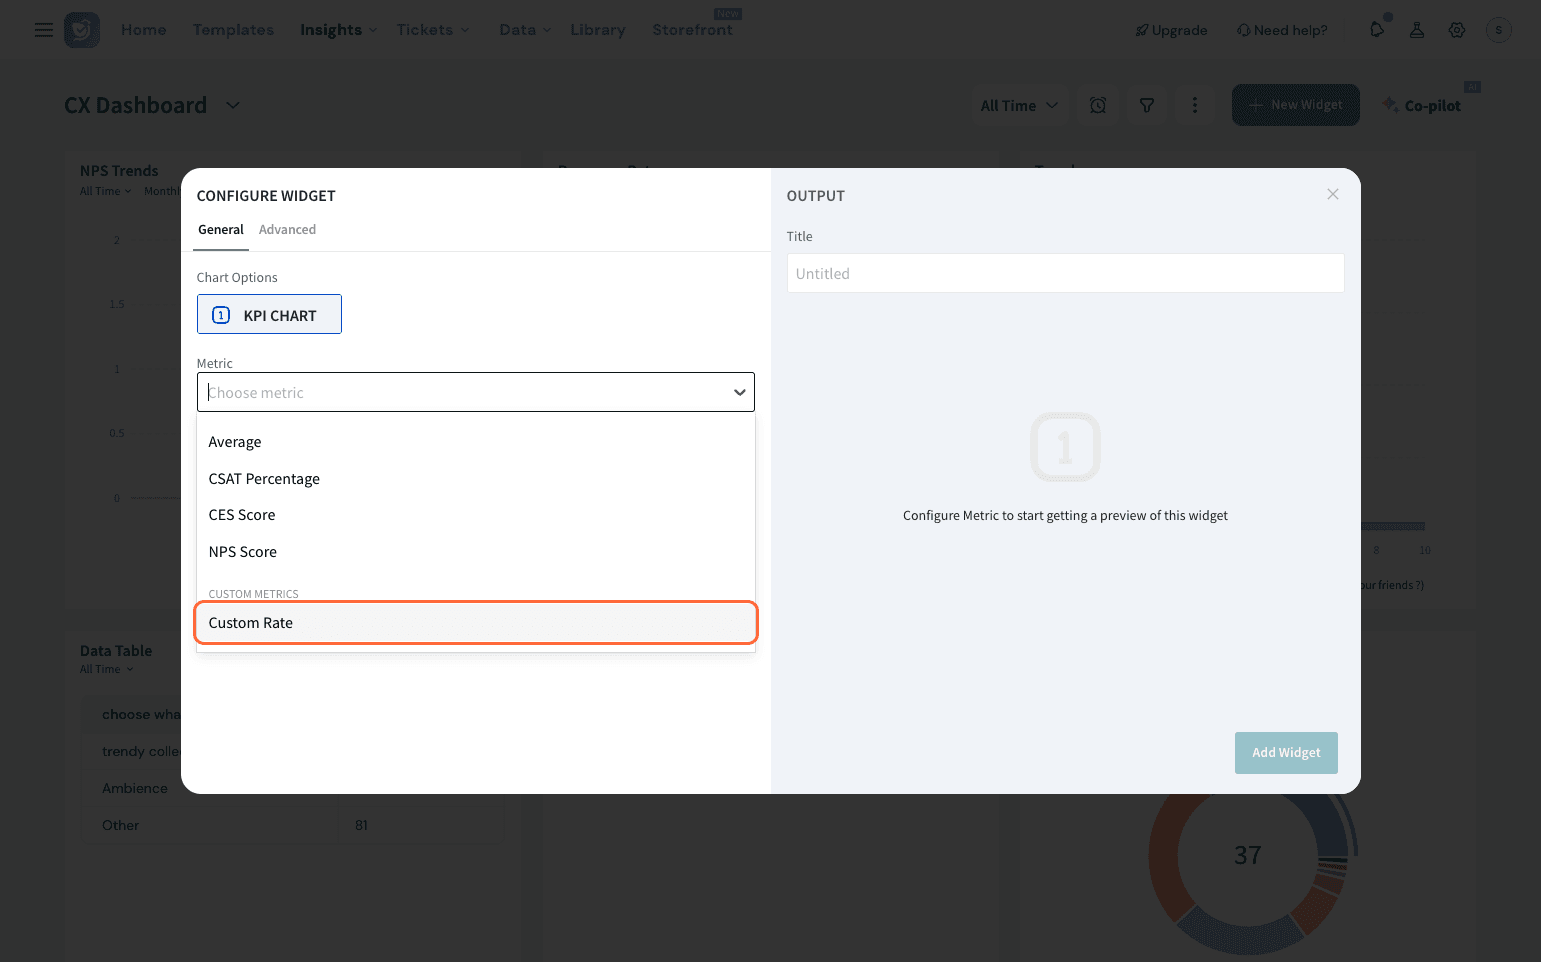
Selecting it displays the response rate calculated using your configured formula.
Custom Response Rate applies only to dashboards and reports used for analysis.
Share Channel analytics always use a fixed delivery-based response rate to ensure consistent channel performance comparisons.
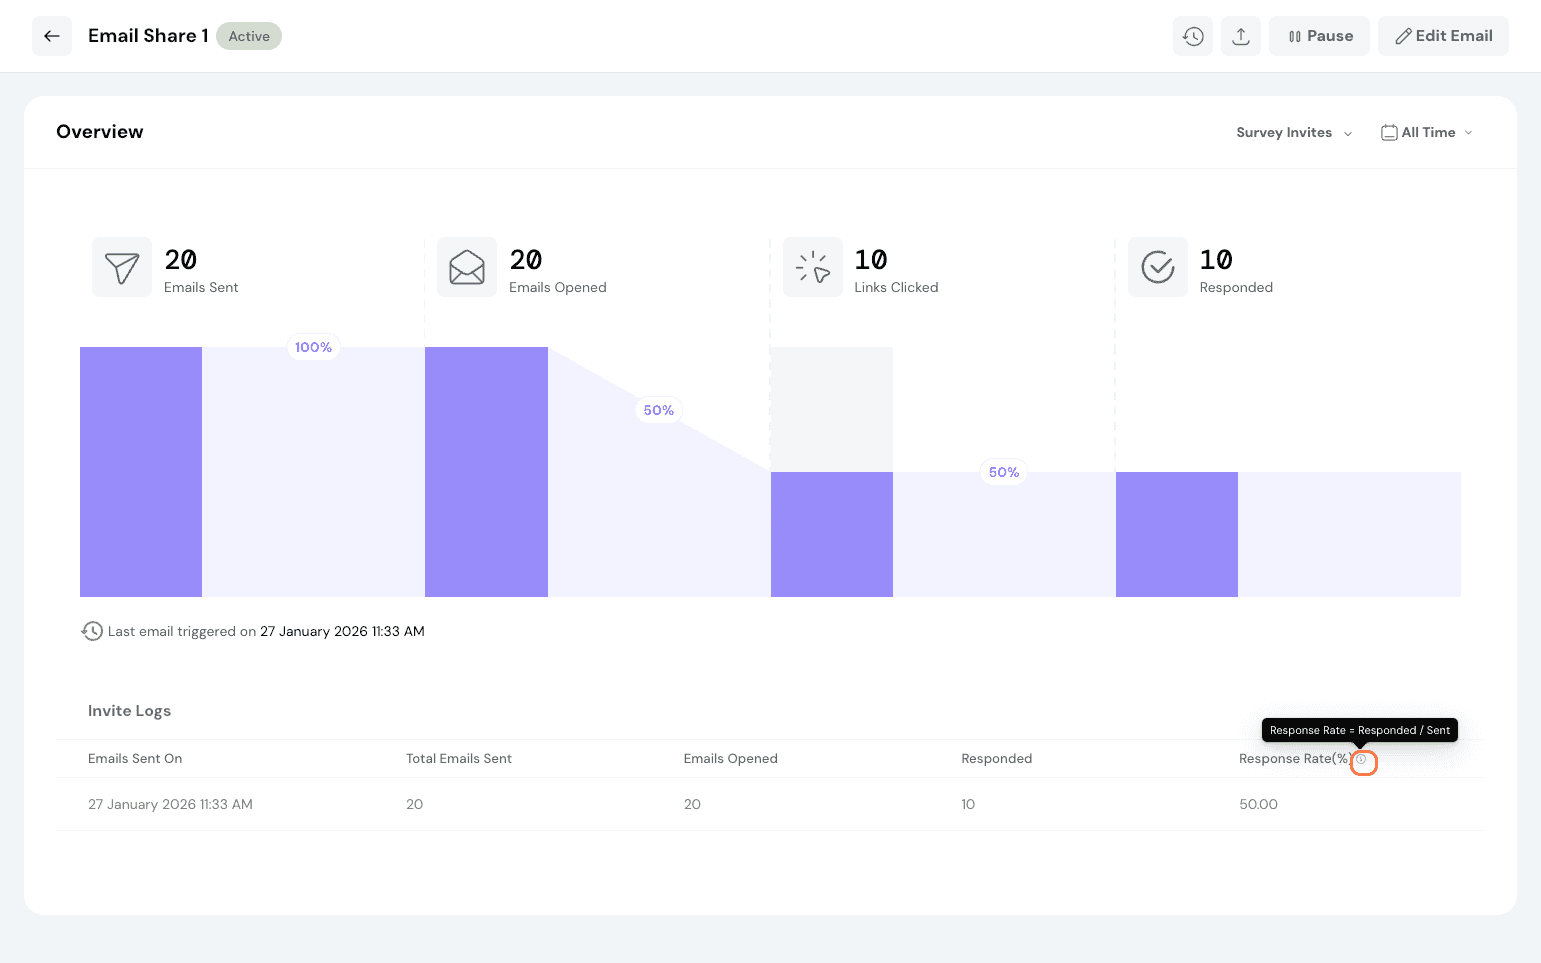
The (i) icon indicates the exact response rate formula used (Responded/Sent) in share channels, so it’s clear to users that the custom response rate is not applicable here.
That’s it on Custom Response Rate! Feel free to reach out to our community if you have any questions.
Powered By SparrowDesk