Search
Compare helps you understand the relationship between the data in different survey questions in a survey report. It helps to focus on the required segment of data alone.
Let’s see how it works:
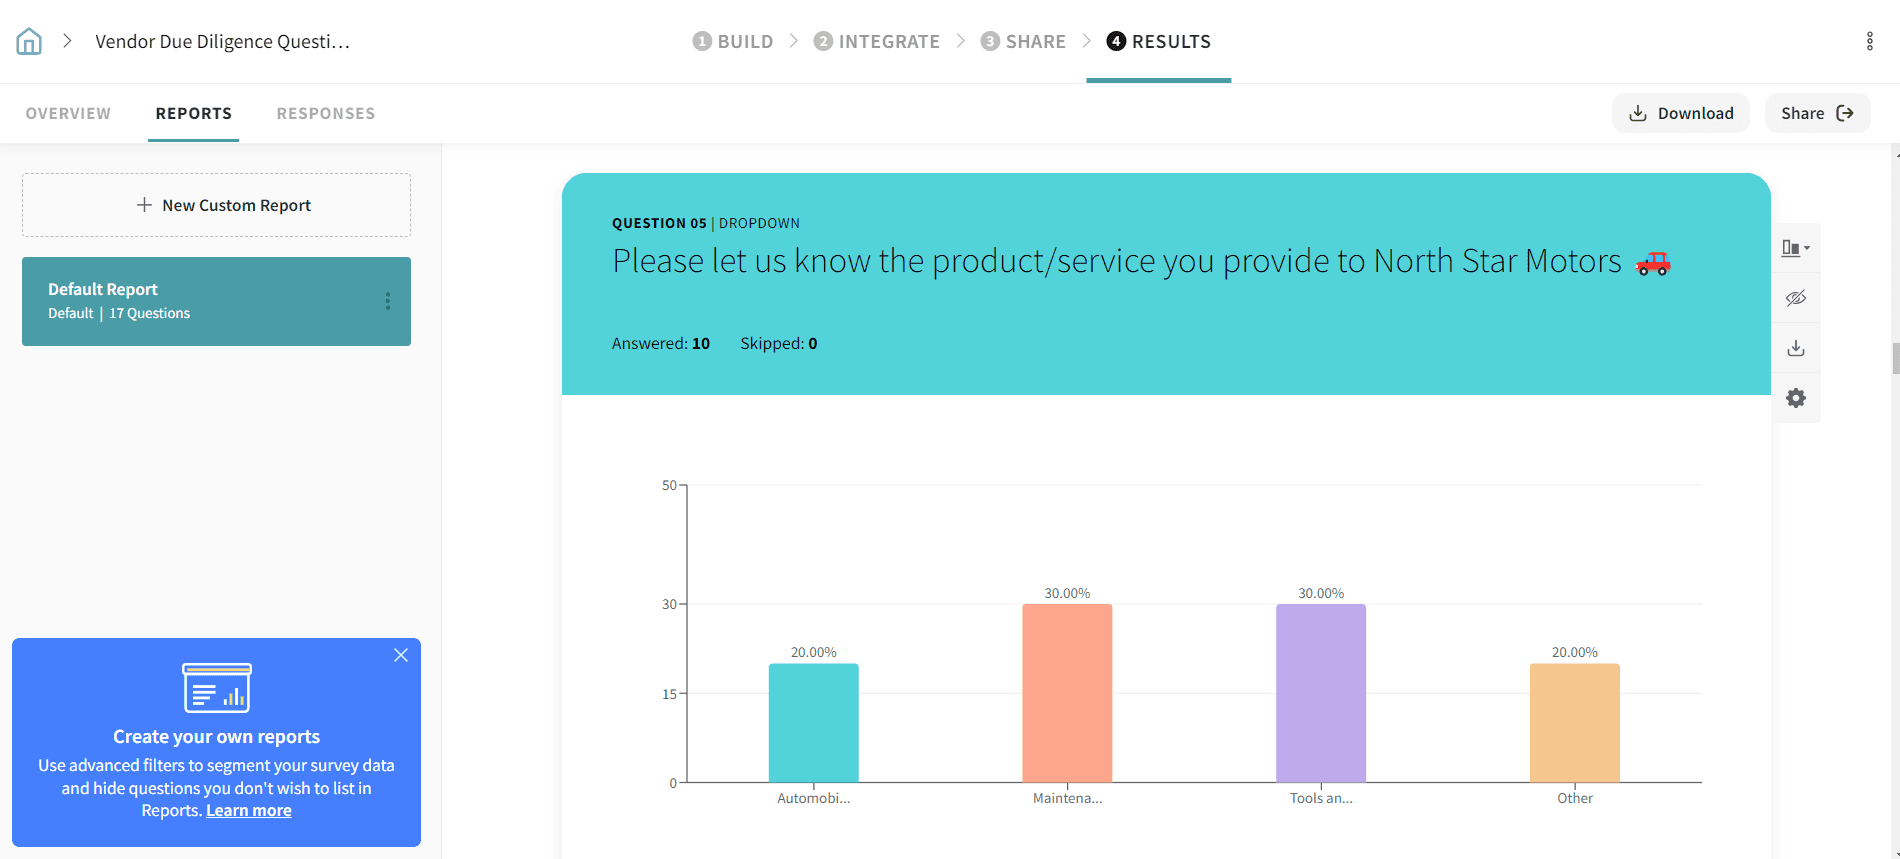
1. After collecting feedback, go to Results and then to the Reports tab.
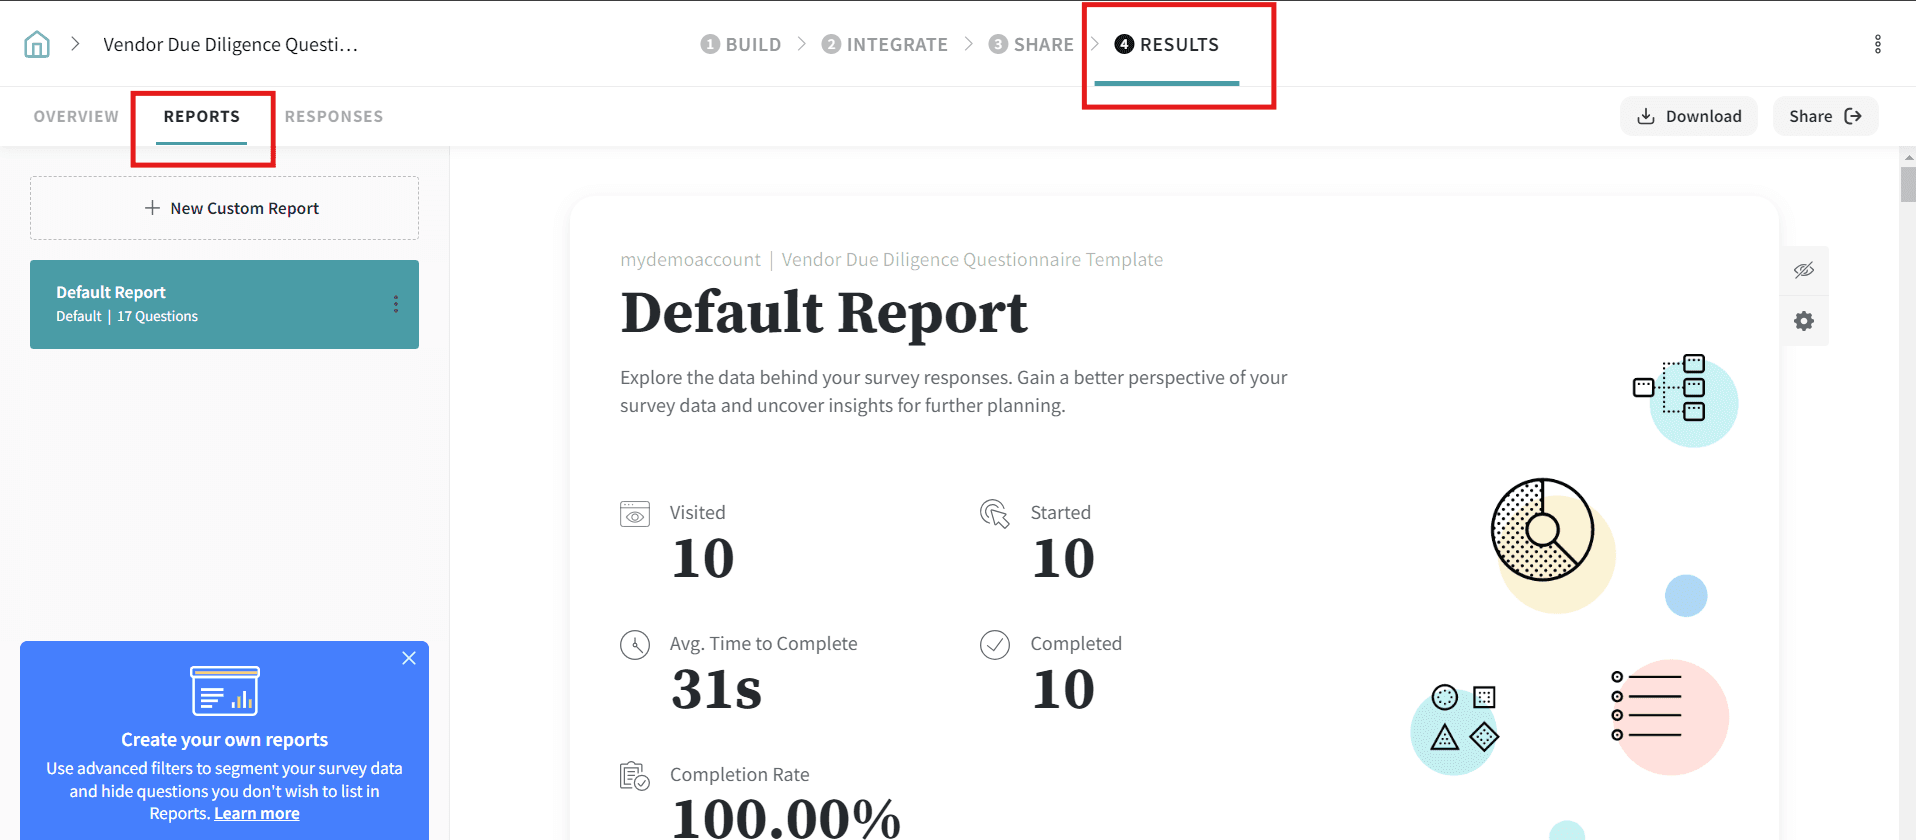
2. Here, you’ll see the question-wise details of the data collected.
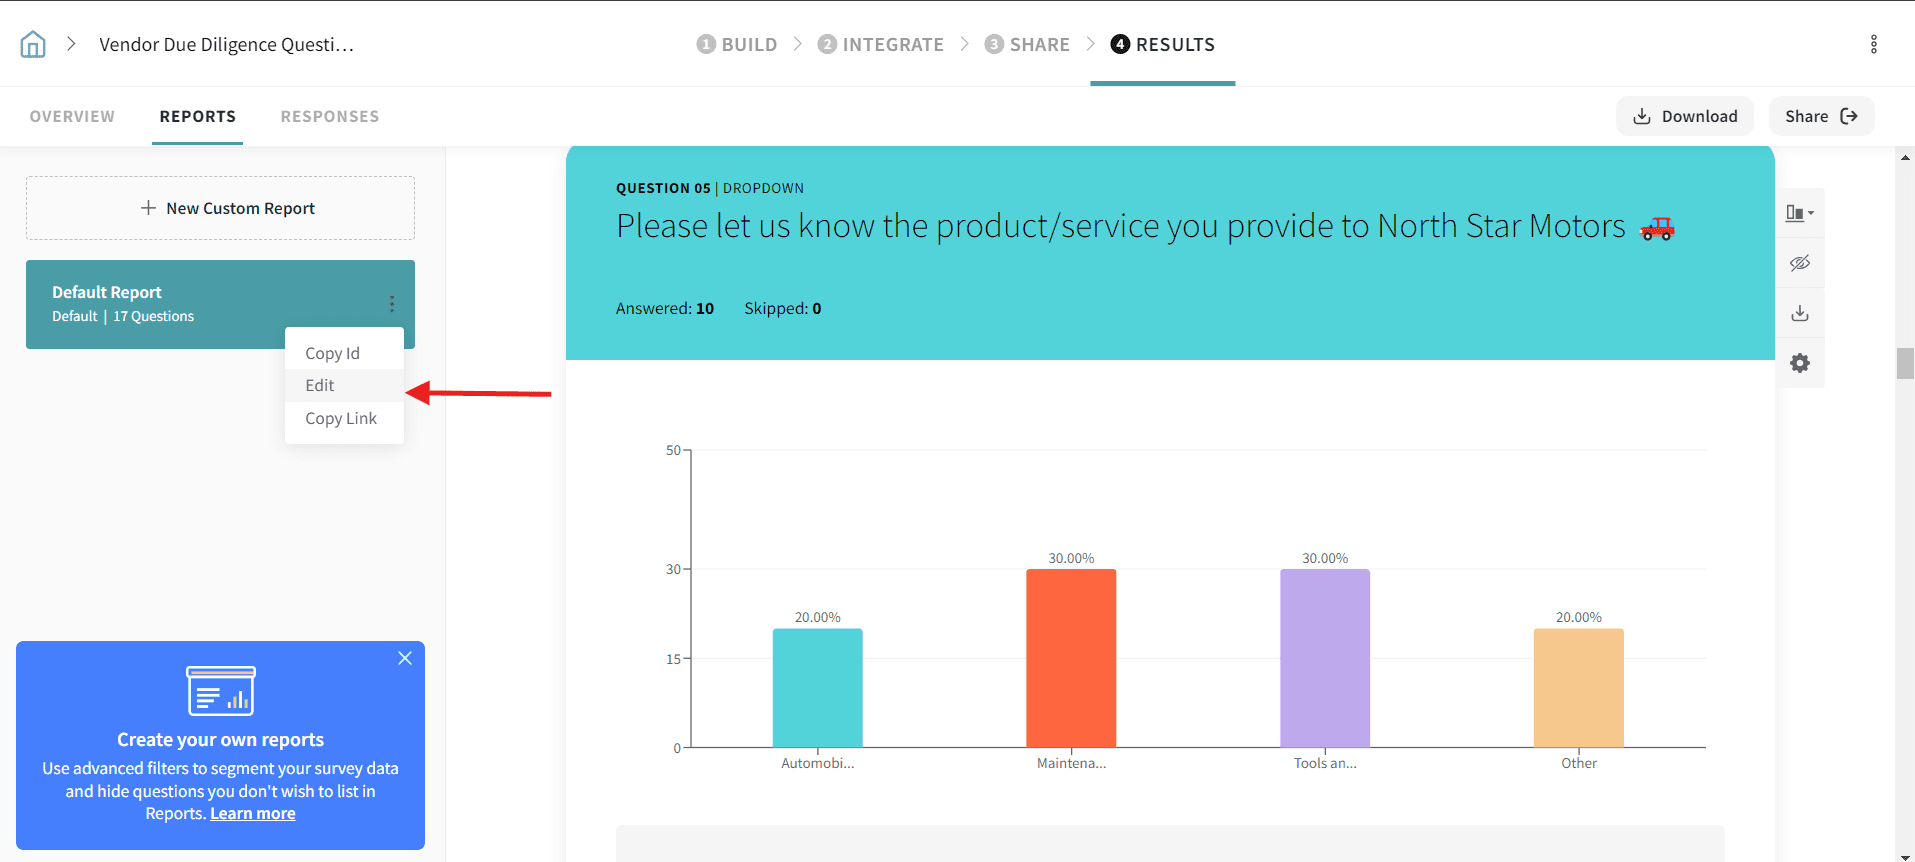
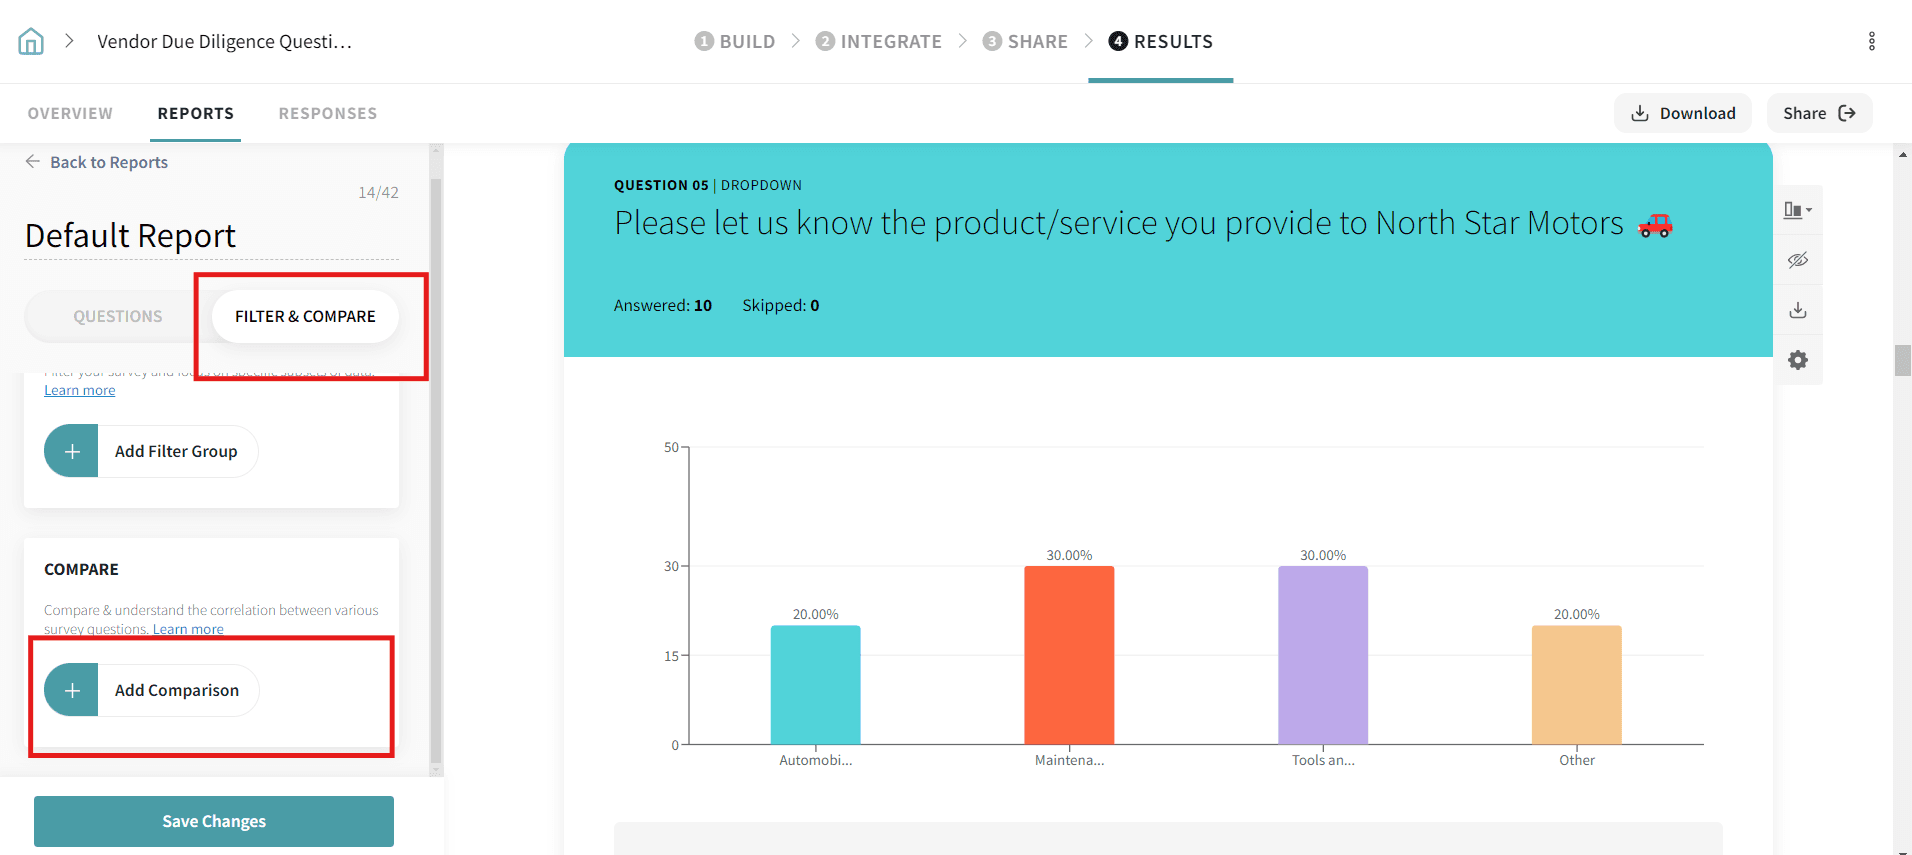
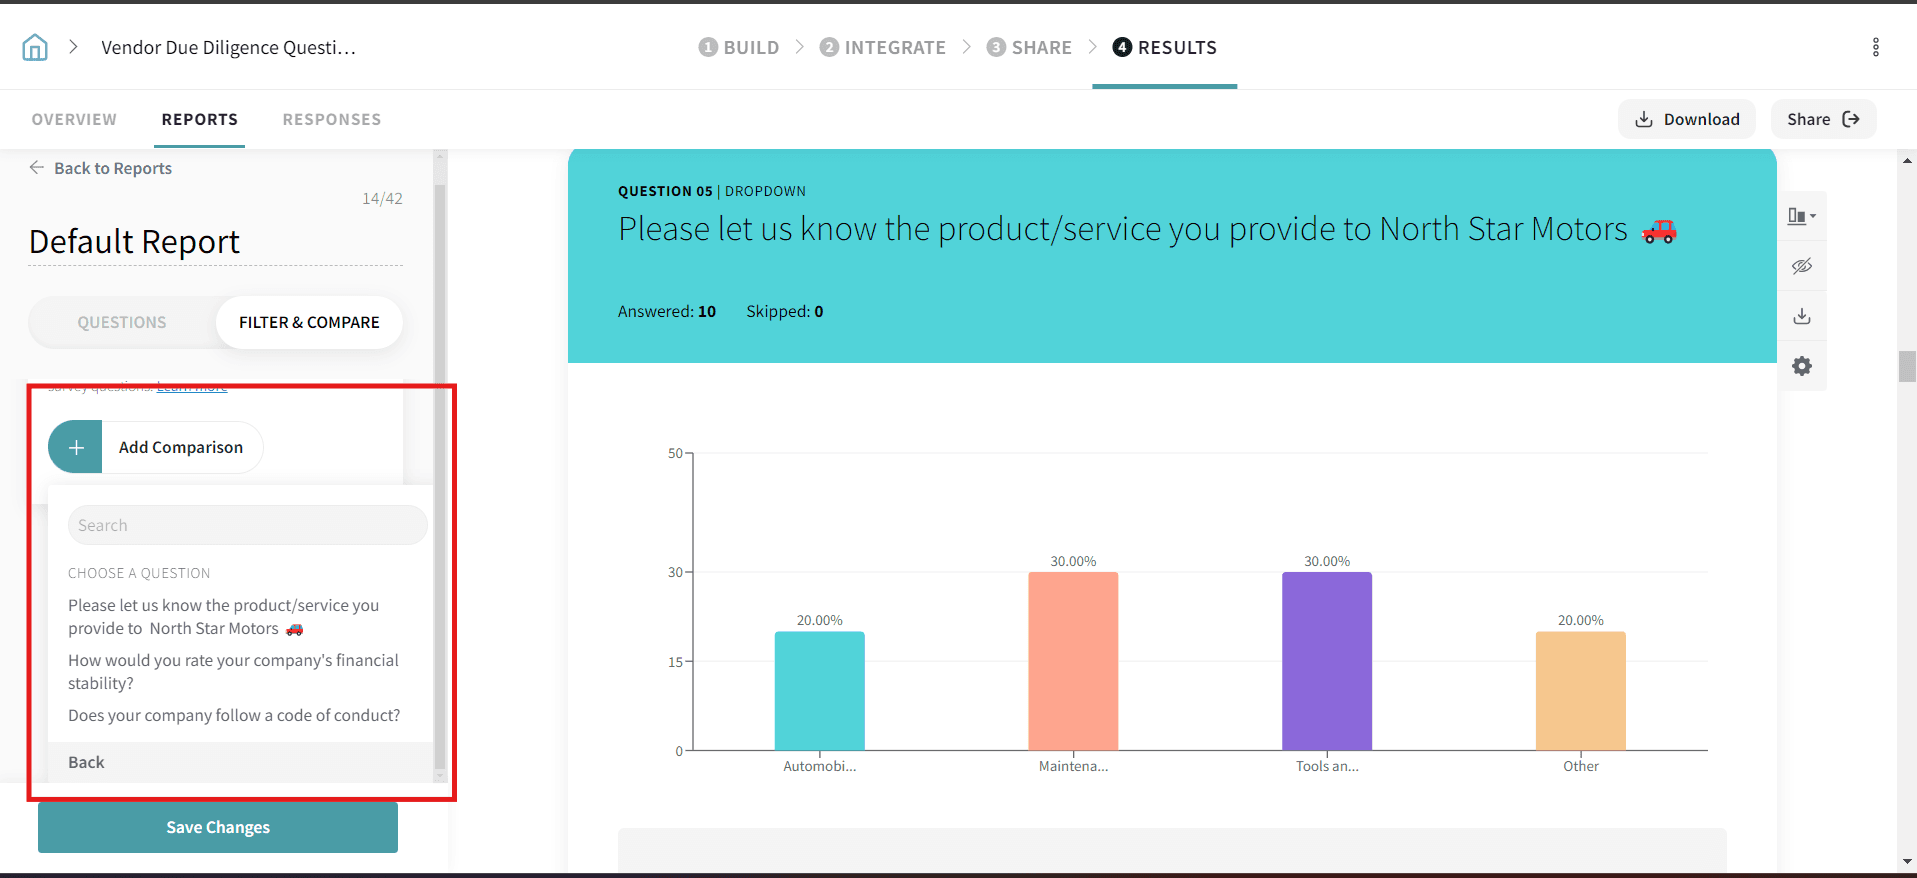
3. On the left side panel, you have the customization options available for the Reports section. Choose Filter & Compare and click ‘+ Add’ against Compare.
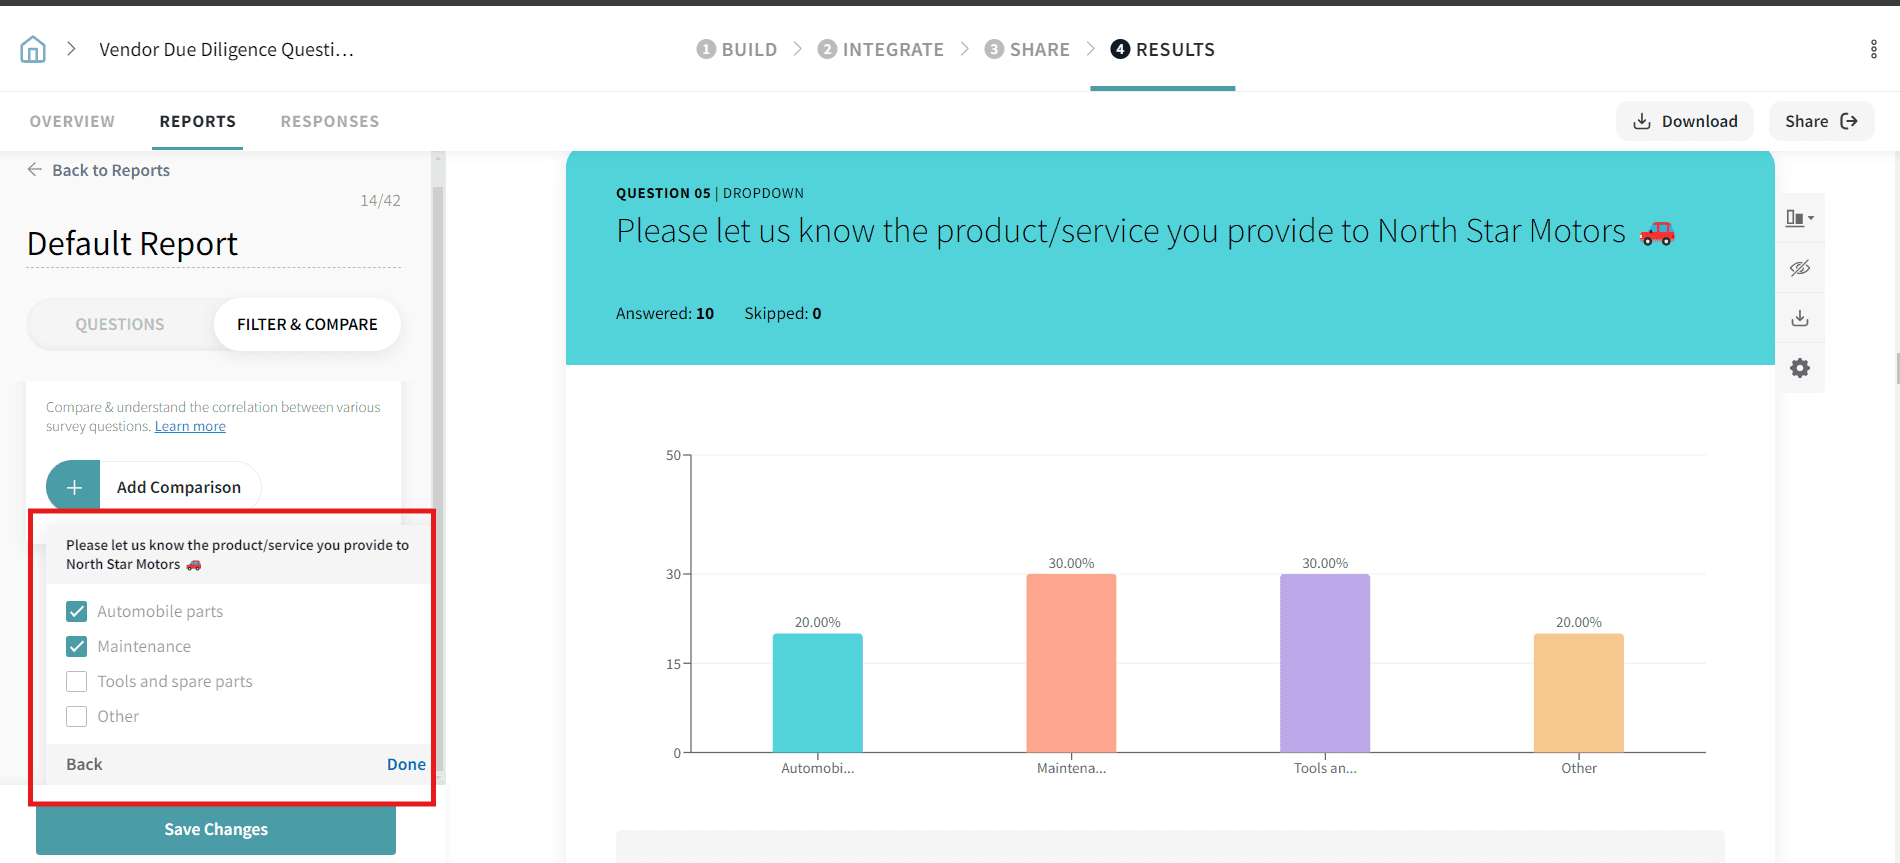
4. Select the question and answer(s) that you want to cross-tabulate with the rest of the data.

5. Choose the data and click Done to display the cross-tabulated report.
6. Select ‘Save Changes’ to save the report as shown.
That’s all. Your report with a sharp comparison based on the parameter you have chosen is ready.
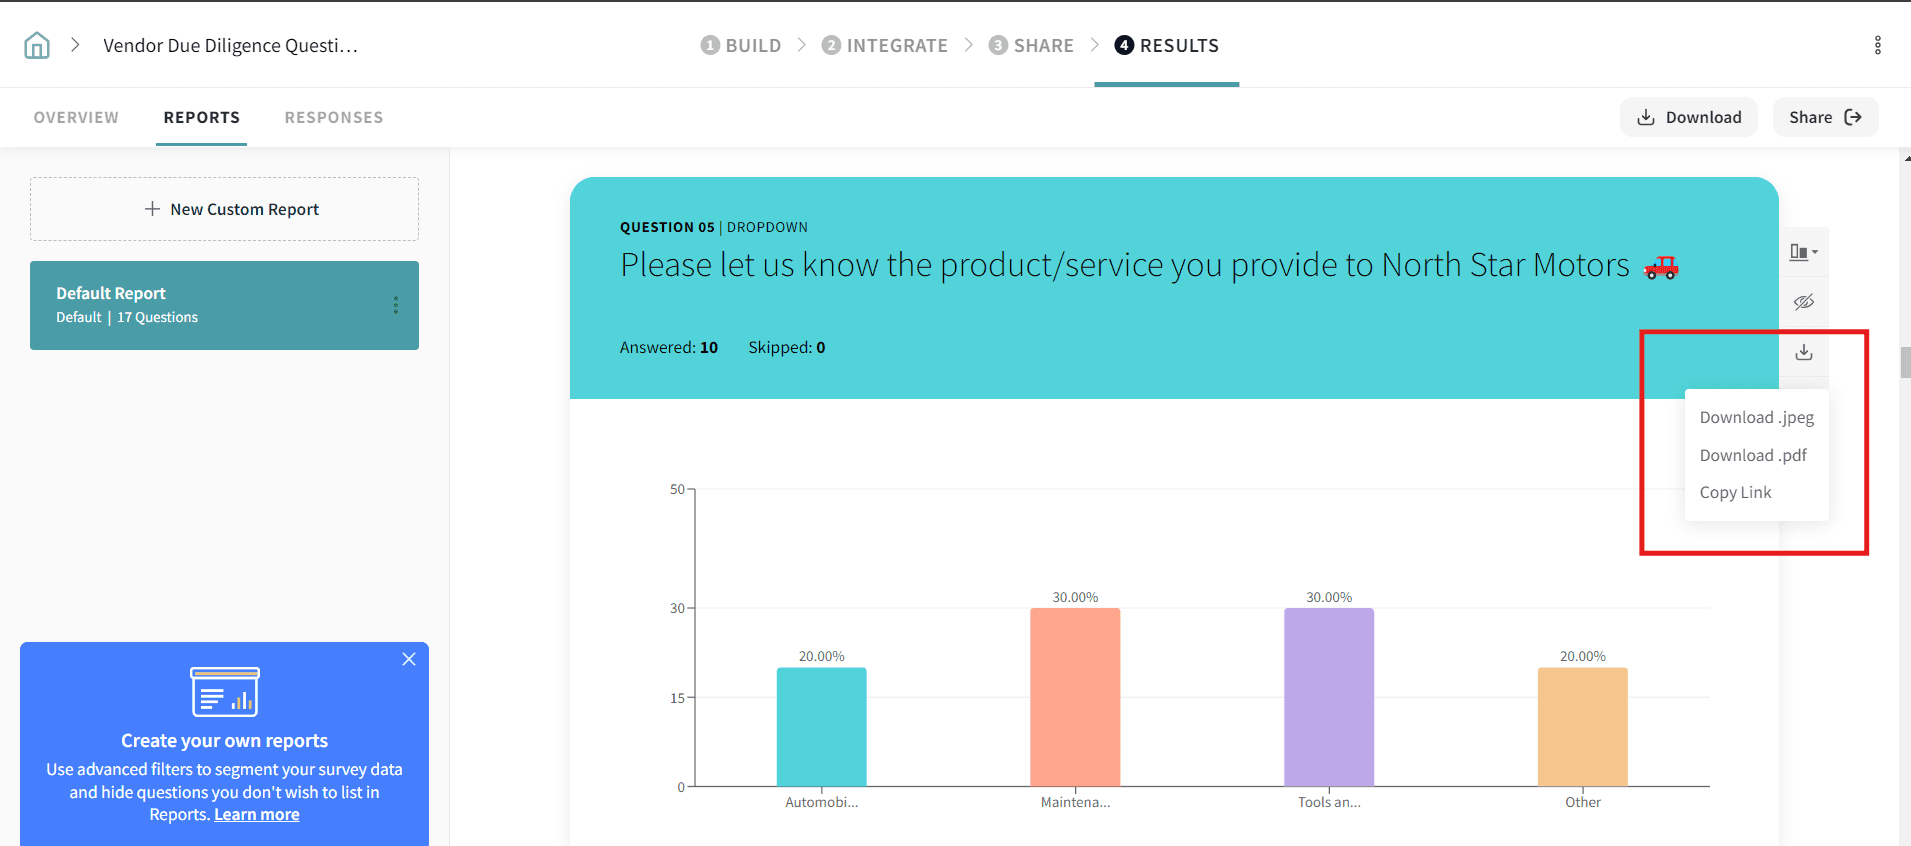
To export the report, click on Export button to either download it as a PDF or send a copy of the report link.
You run a supermarket with many outlets all over the country. You conduct employee engagement feedback surveys every quarter, and want to know how your employees at the junior level from your outlet in LA have answered the survey.
1. Go to the Reports section to begin the process.

2. Click Compare and select the question that asks the employees to mark the outlet they are in.
3. Select the outlet that you want to see the responses for and click Apply.

4. Graphical correlations between the question you selected and the rest of the questions will be displayed.

With this feature, you can also:
In short, Compare transforms a normal report into one with rich insights about customer trends and patterns.
Example: You want to identify the customer attitude of millennials for your brand from a particular geographical area. You can initiate this feature by selecting the responses against age and pin code. A report to show how millennials from a certain pin code have responded to the rest of the survey will be displayed.
The reports generated can be saved, downloaded or scheduled to reach the inbox at your convenience.
Powered By SparrowDesk