Search
Journey charts in Executive Dashboard lets you compare and correlate the survey data between different touch points in one visually immersive frame. You can easily create multiple stages in one dashboard and analyze the performance metrics of all the stages.
It is supported for the following question types.
NPS Survey: NPS Question and Opinion scale question type
Classic Survey: Opinion scale question type
Let’s see how it works.
1. On your Home page, click on Dashboards and create a new dashboard or open an existing one. Once you are in the dashboard page, click on +New Widget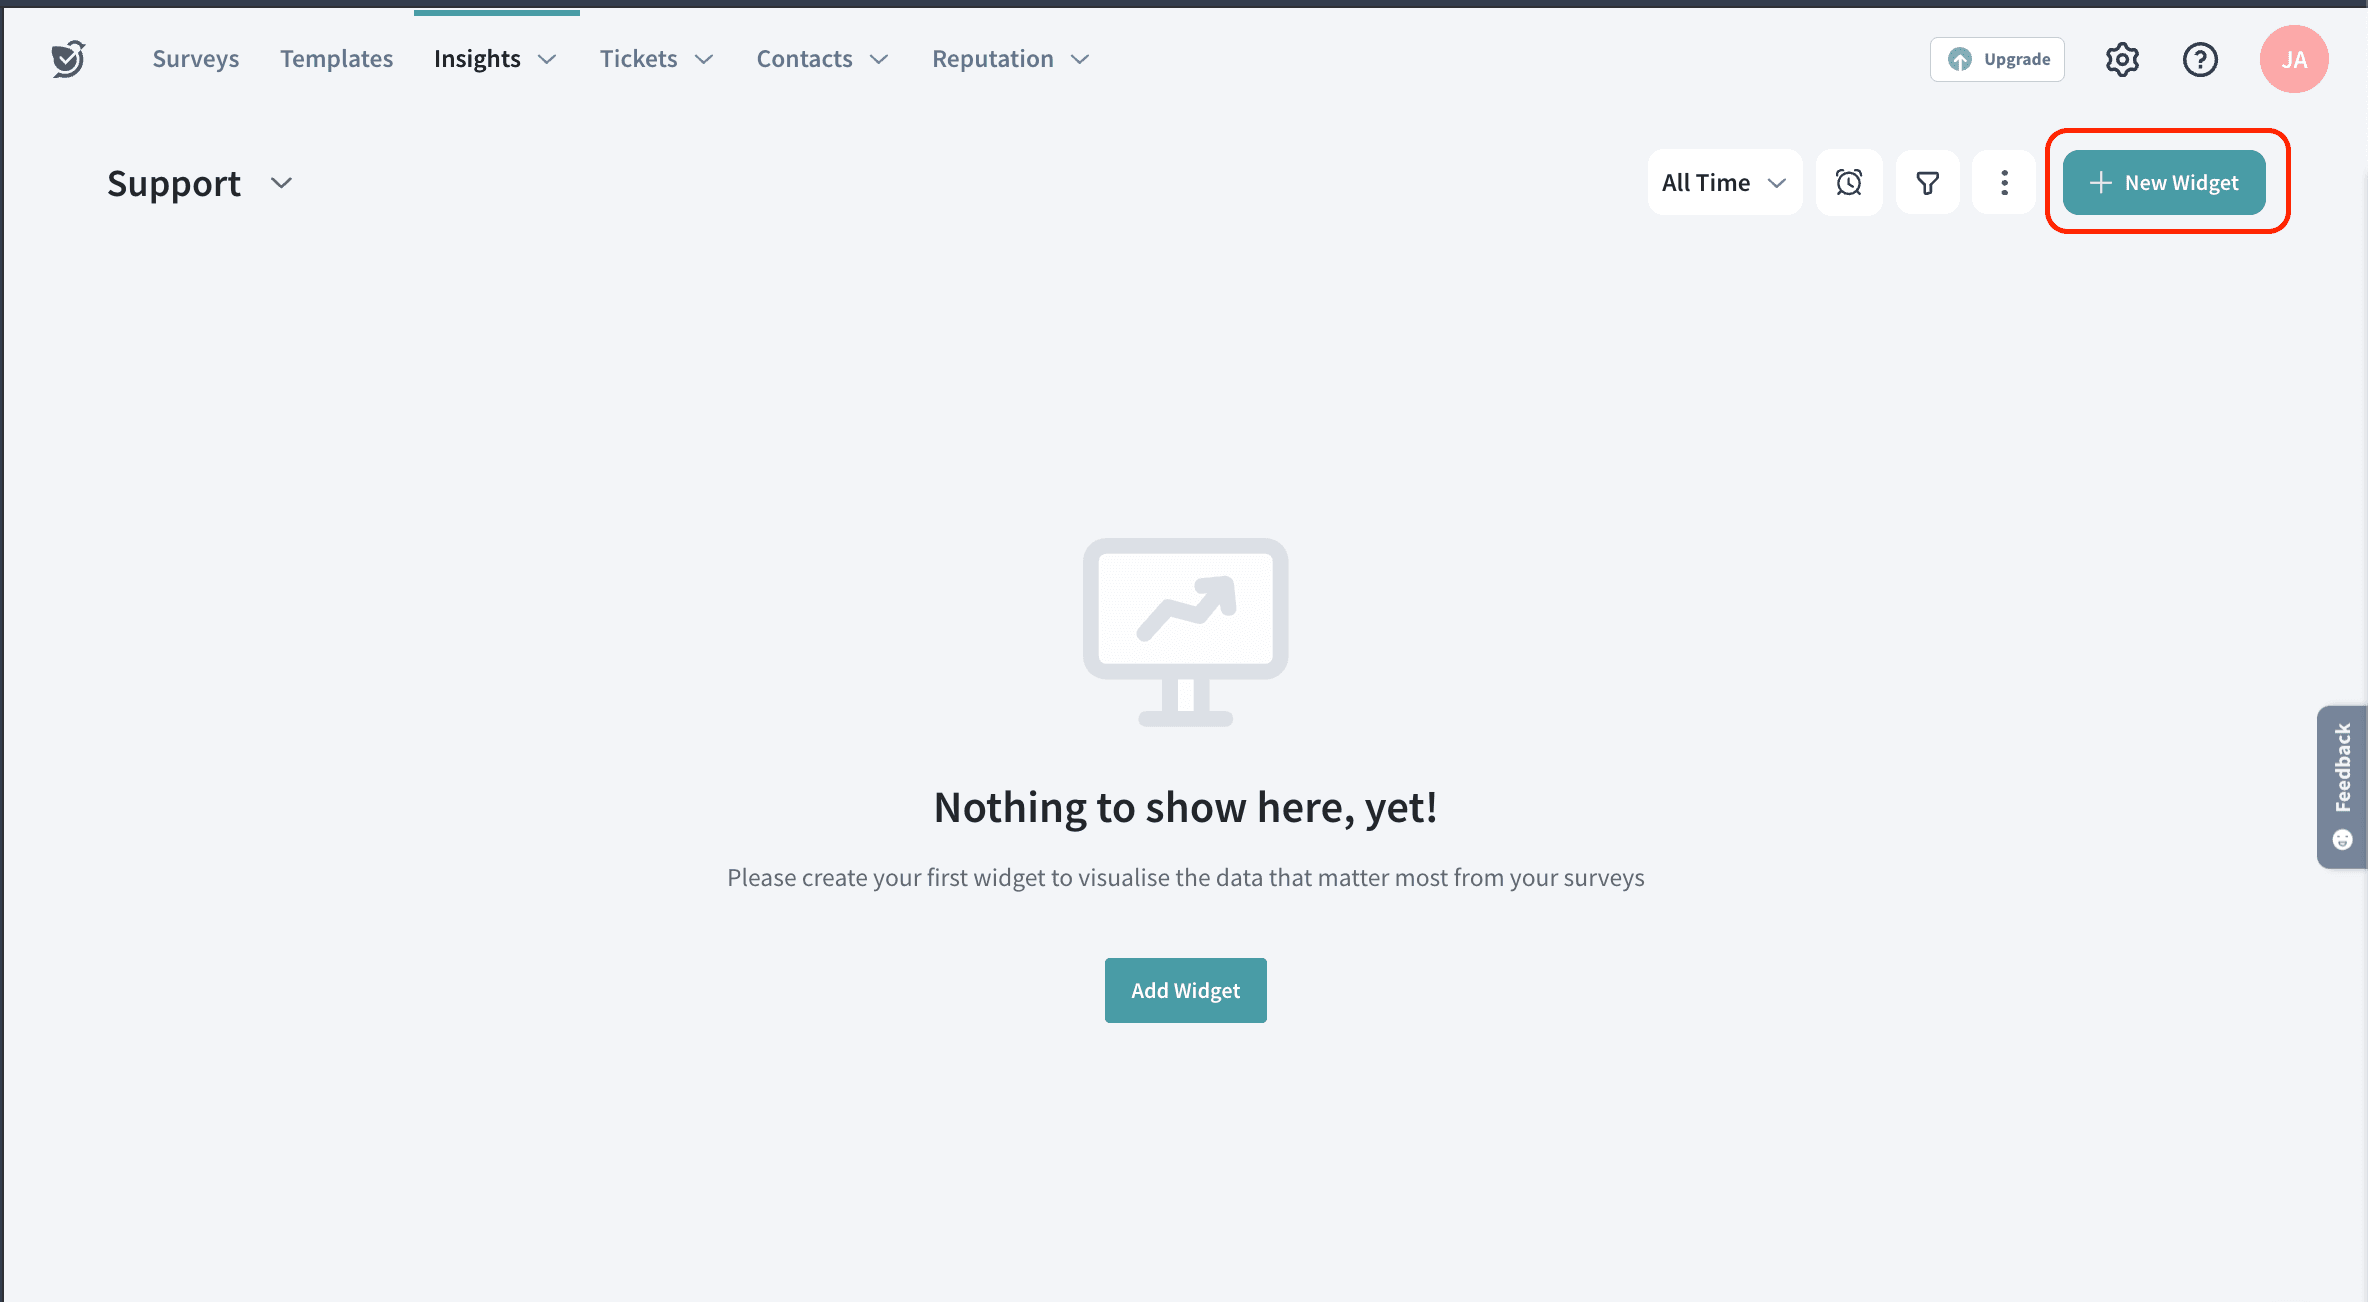
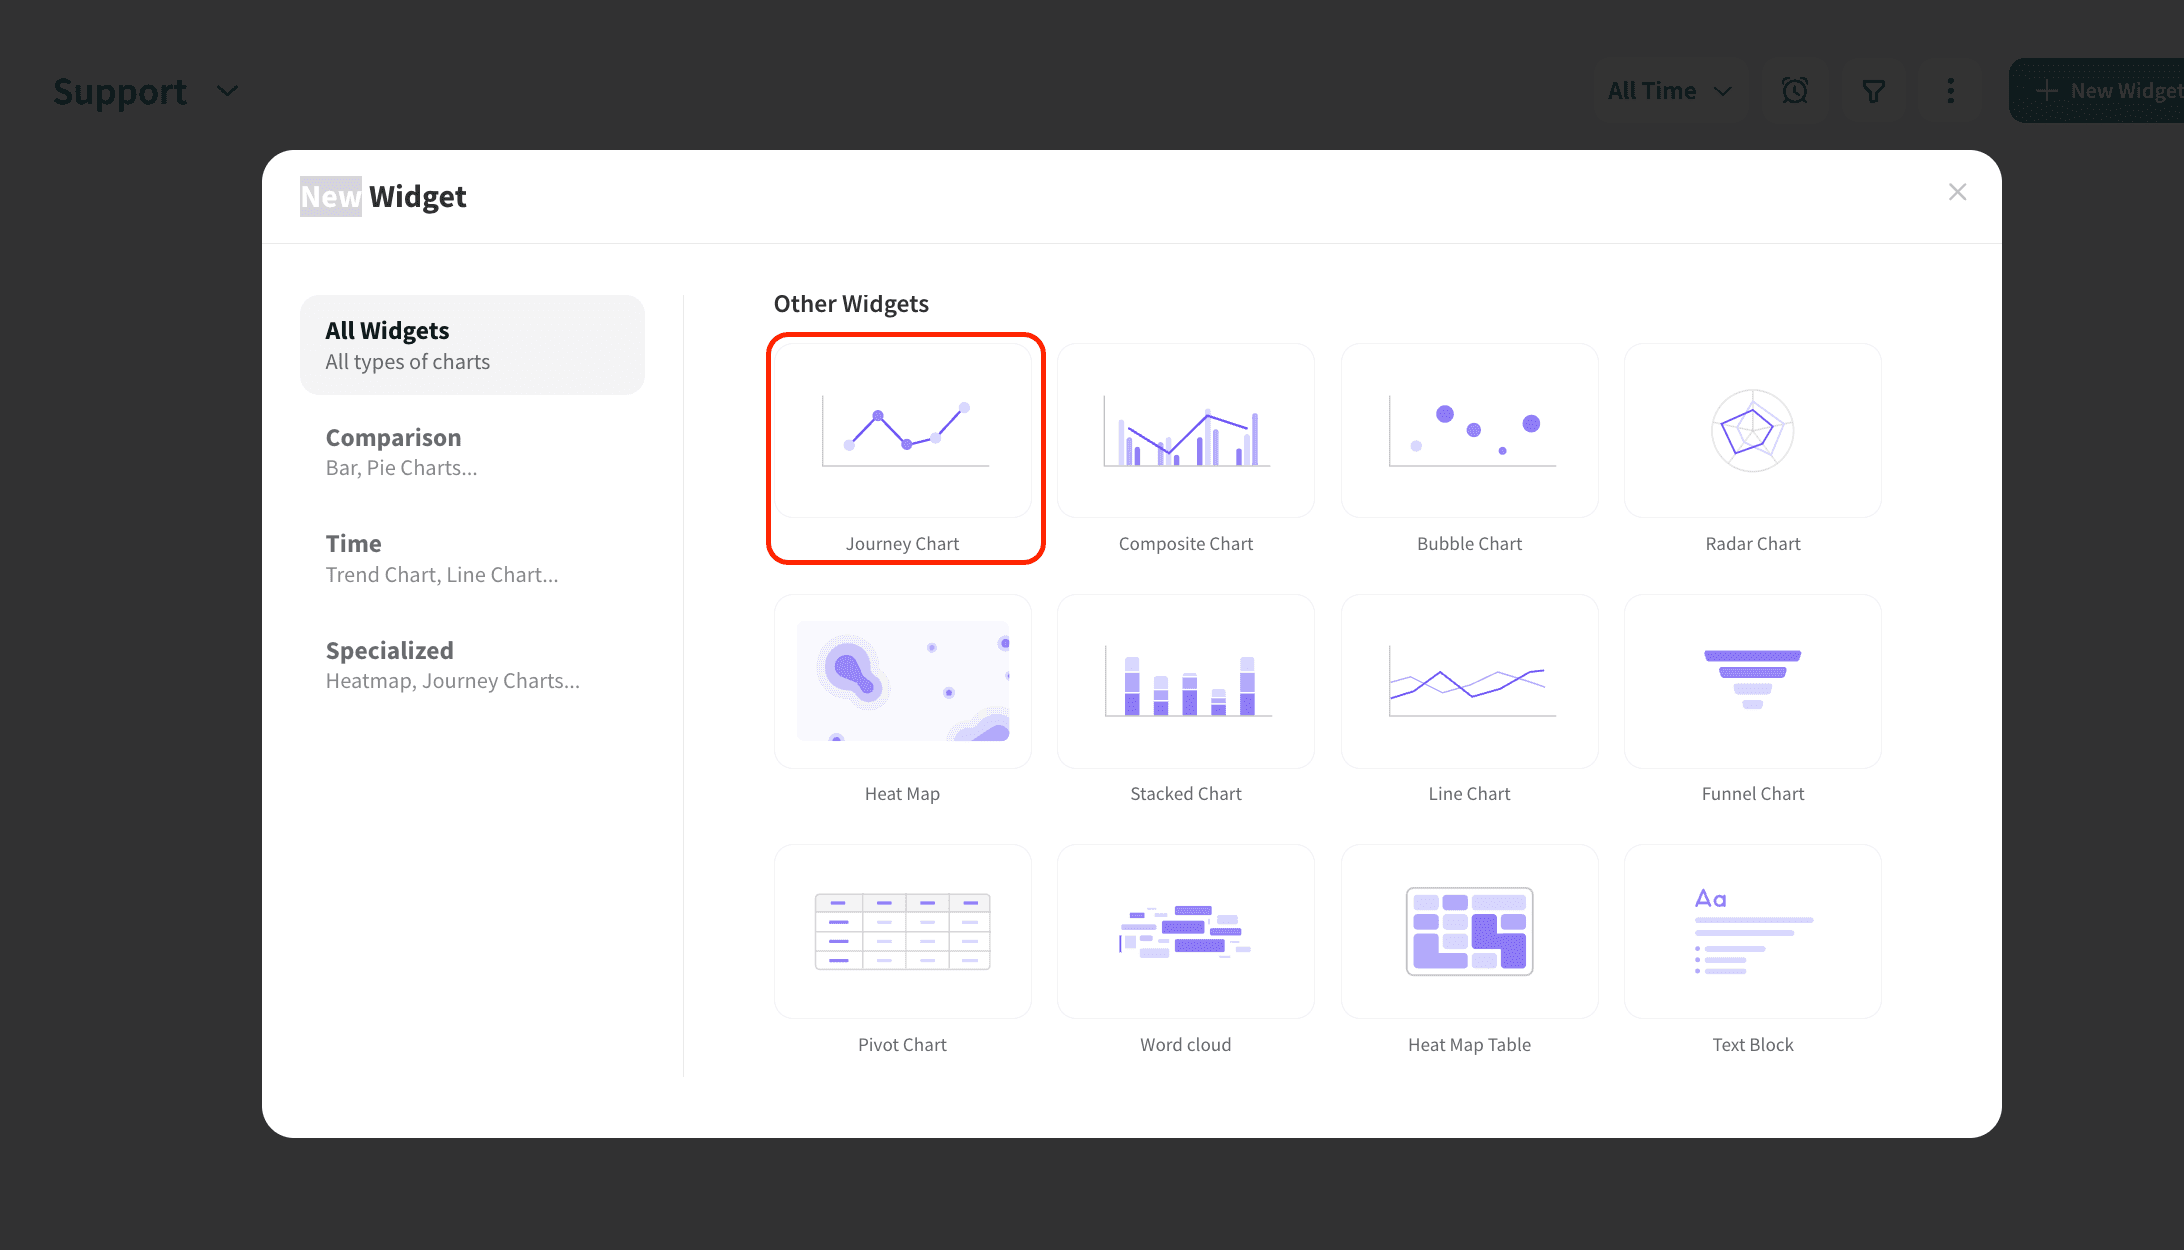
2. The window below opens, choose Journey Chart
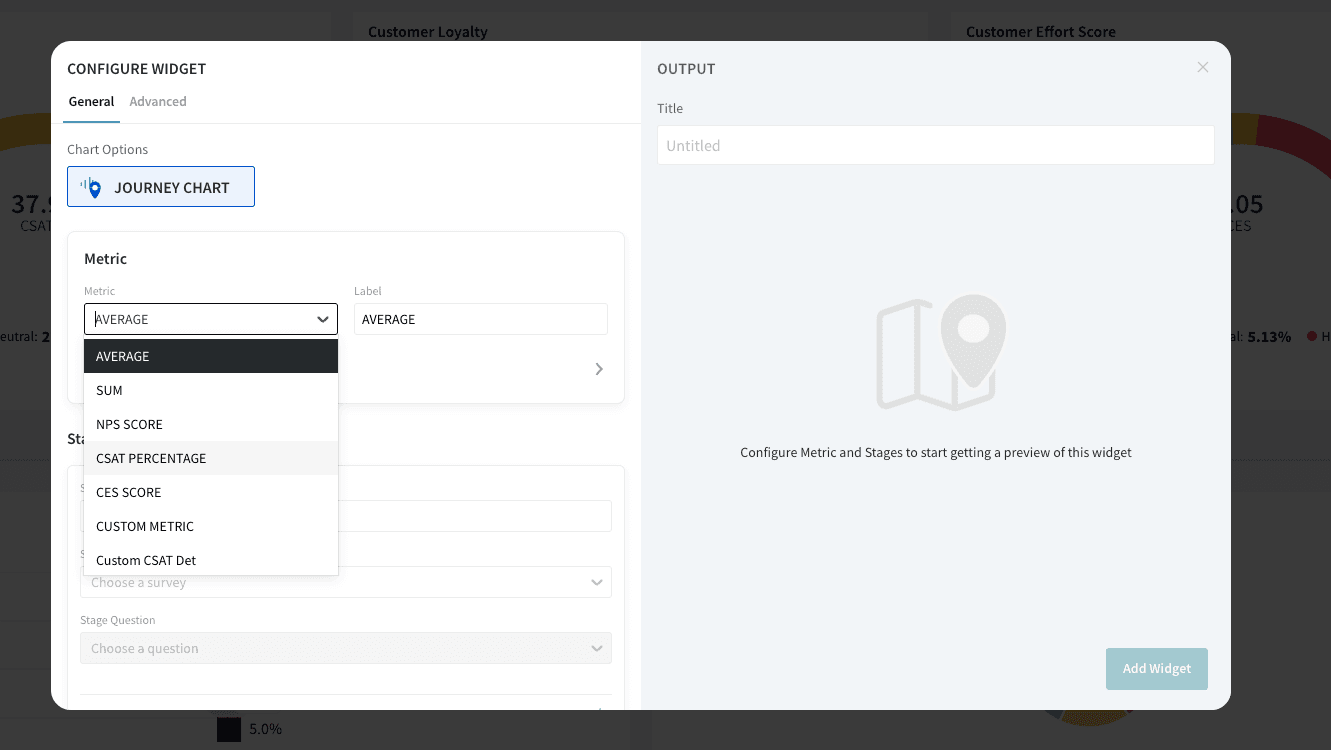
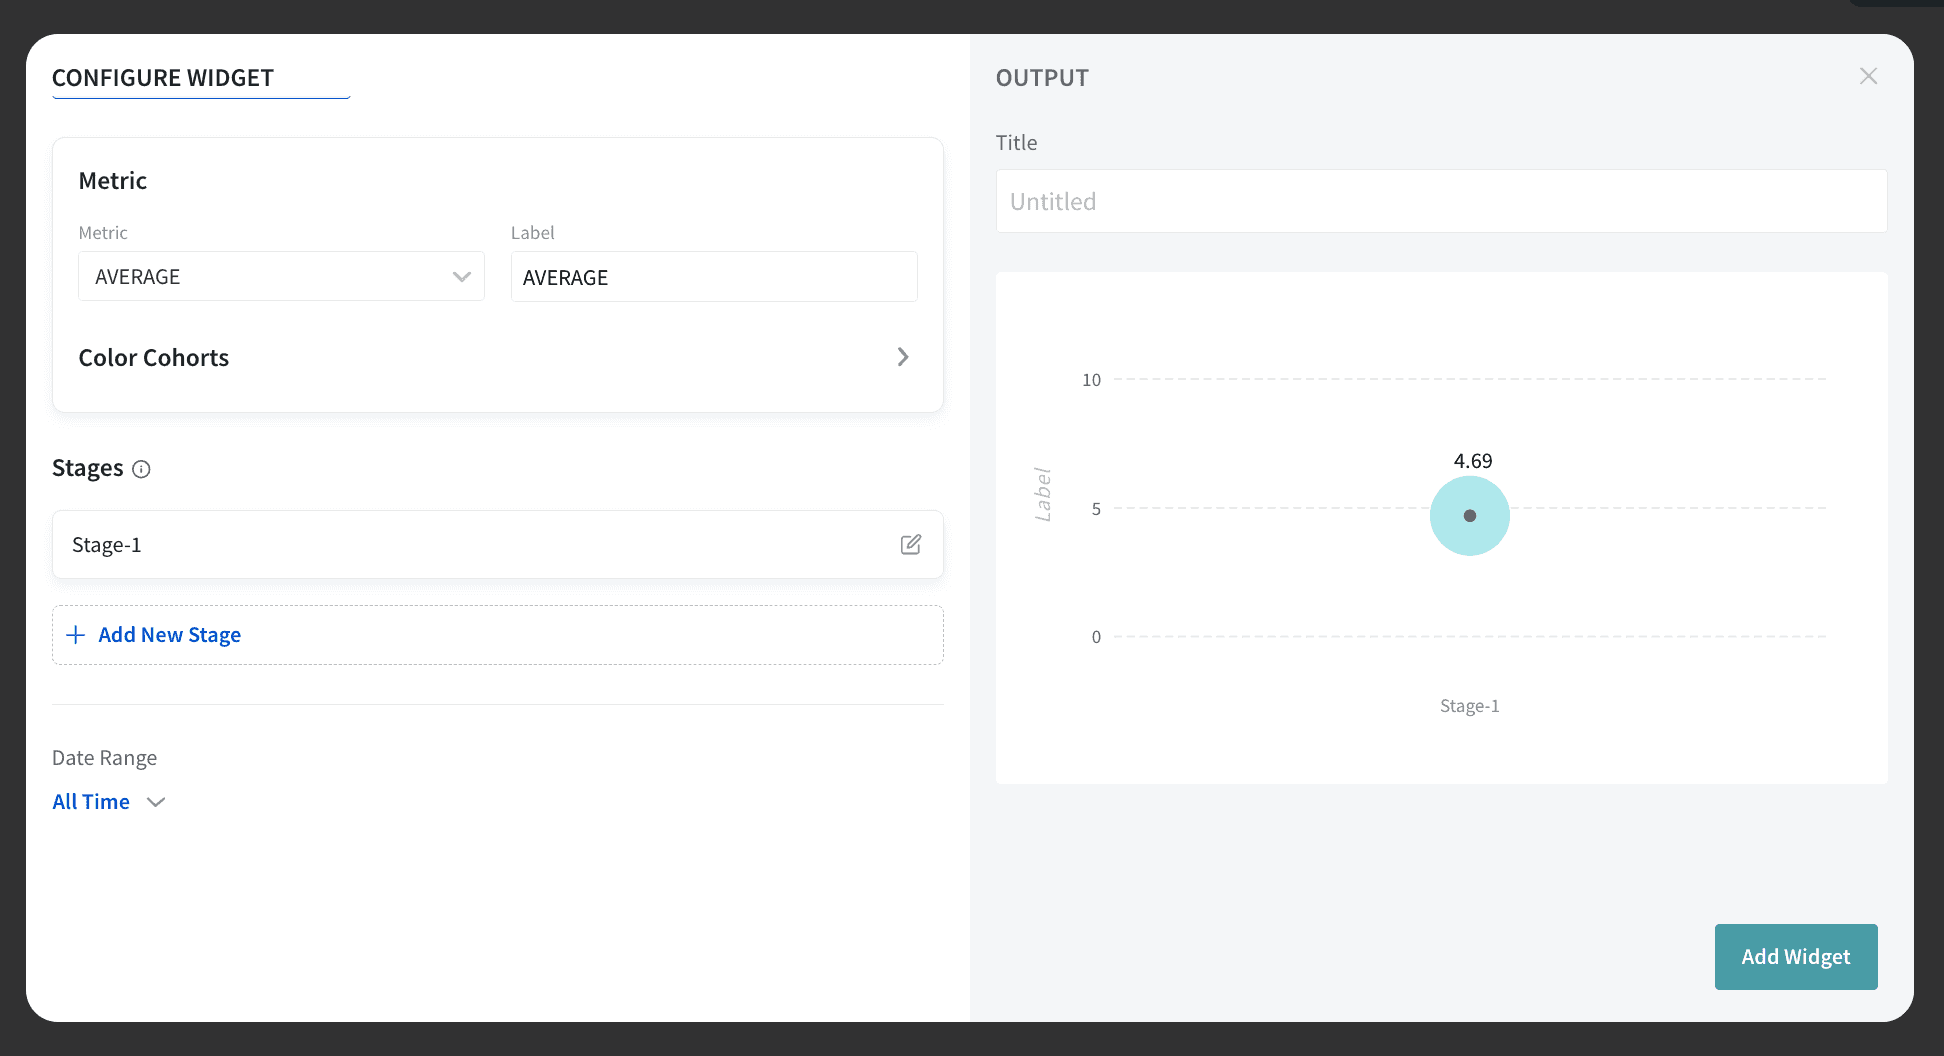
3. Select the metric from the dropdown as you wish. You can choose from standard metrics like Average, NPS, CSAT, CES, or pick your custom metric as well.
4. Now, scroll down to create stages. A stage is created to select the survey question for comparison. You can name the stage and select the stage source from the dropdown.
Once done, click on the Save button.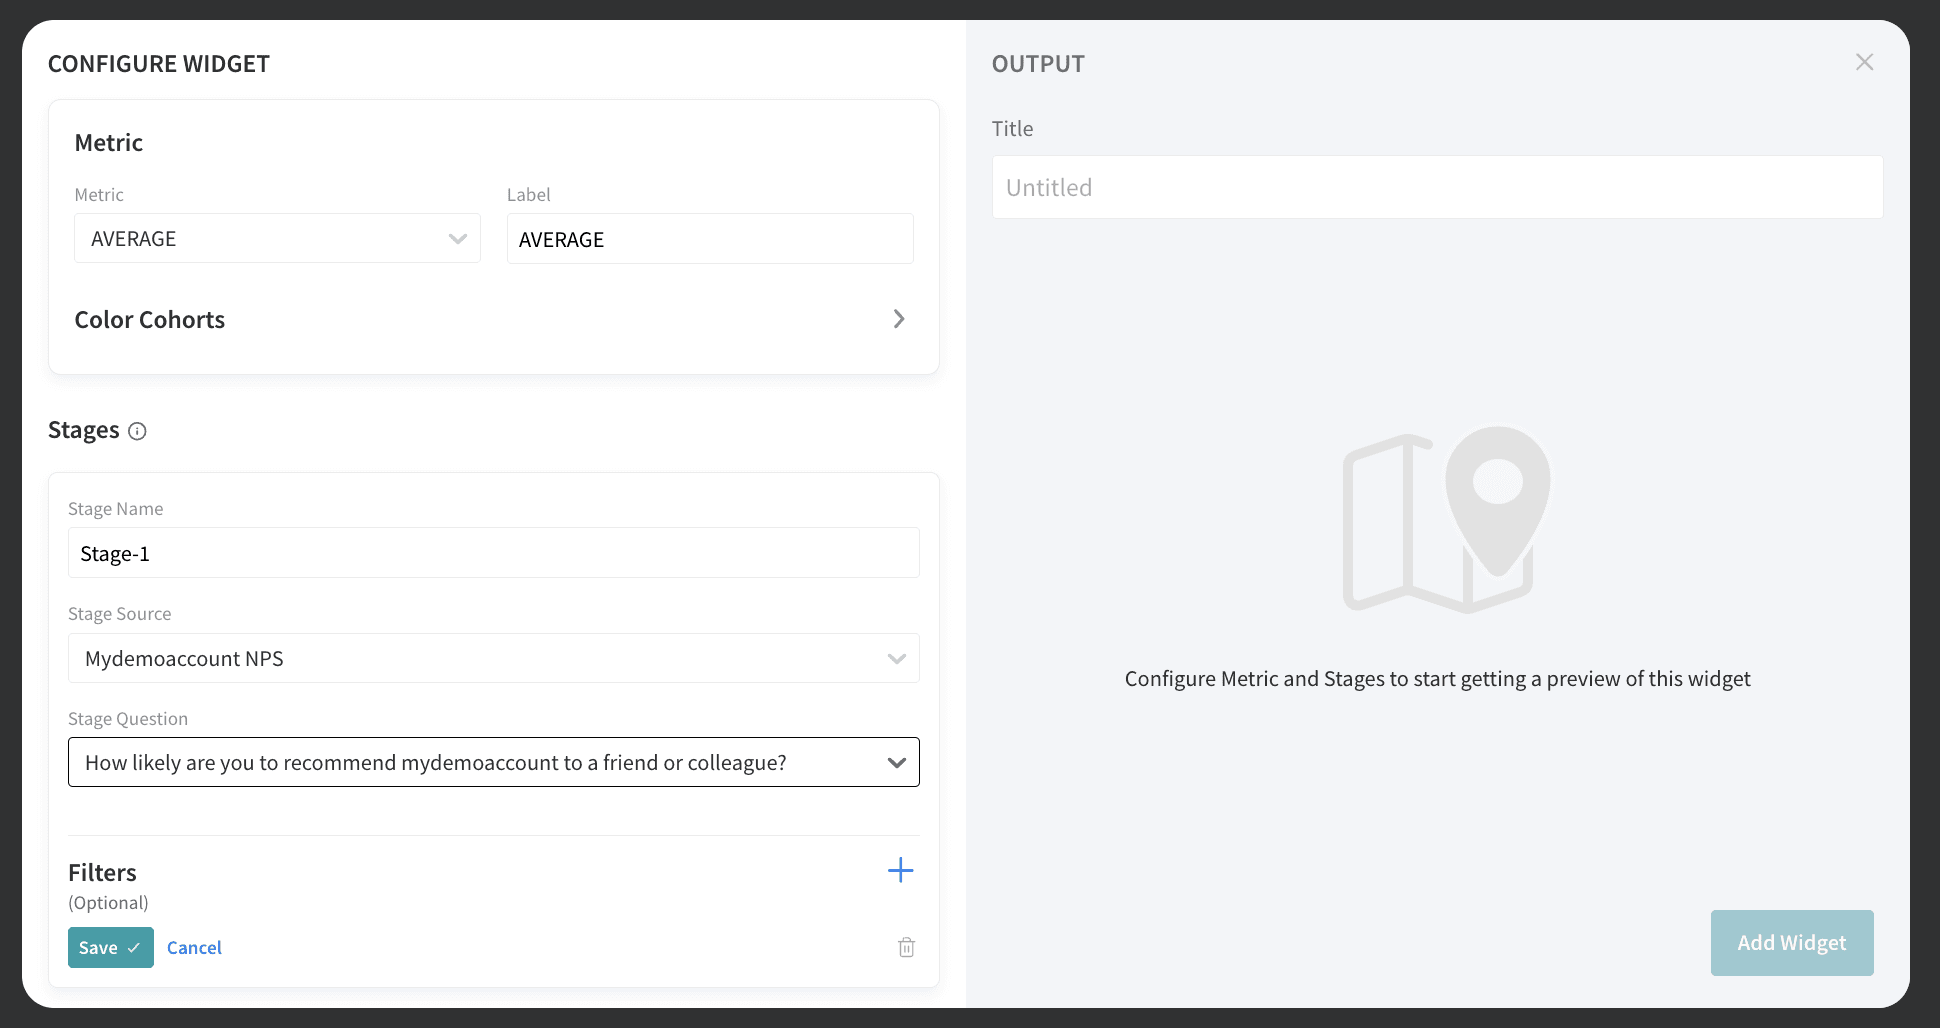
5. Similarly, create another stage by clicking on + Add new Stage, to compare the values with the previous stage metric.
Once done, click Save.
Note: Please add similar question types across all the stages for accurate display.
6. Hit Add Widget, once you have added all the stages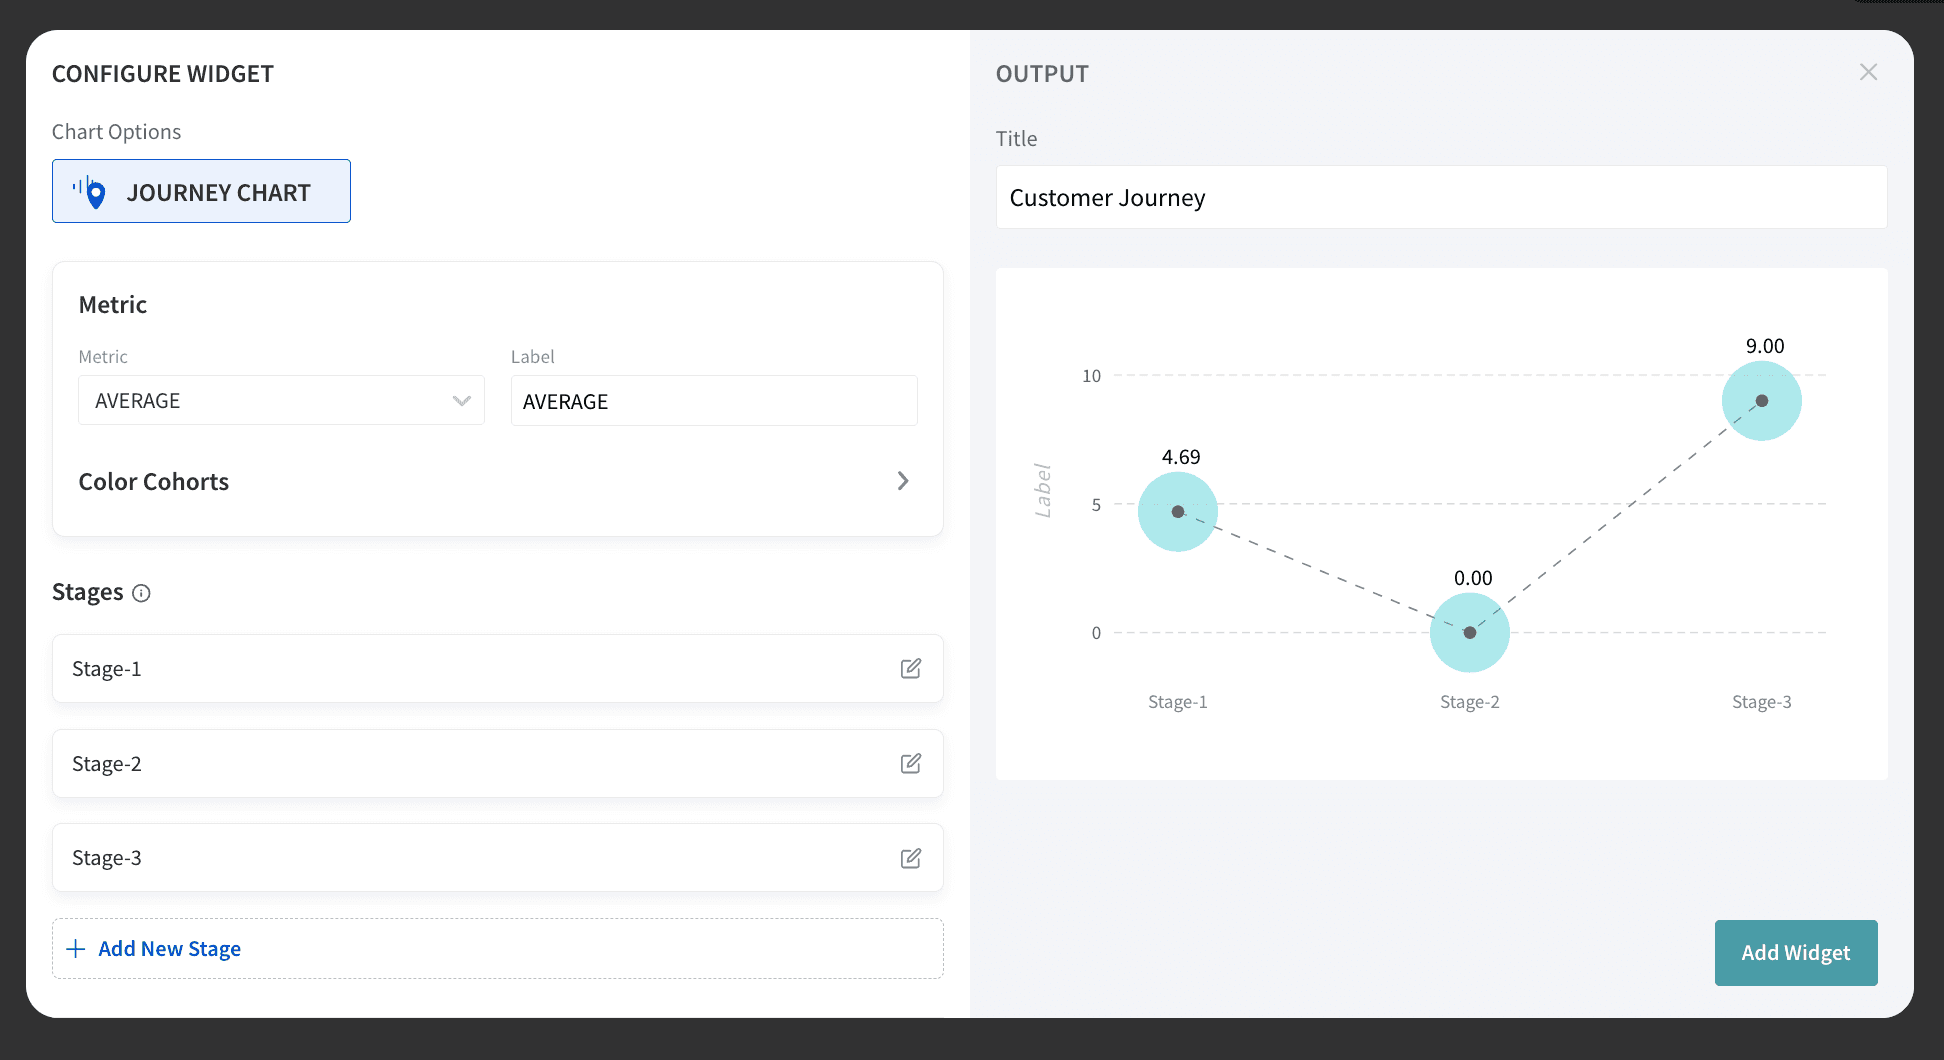
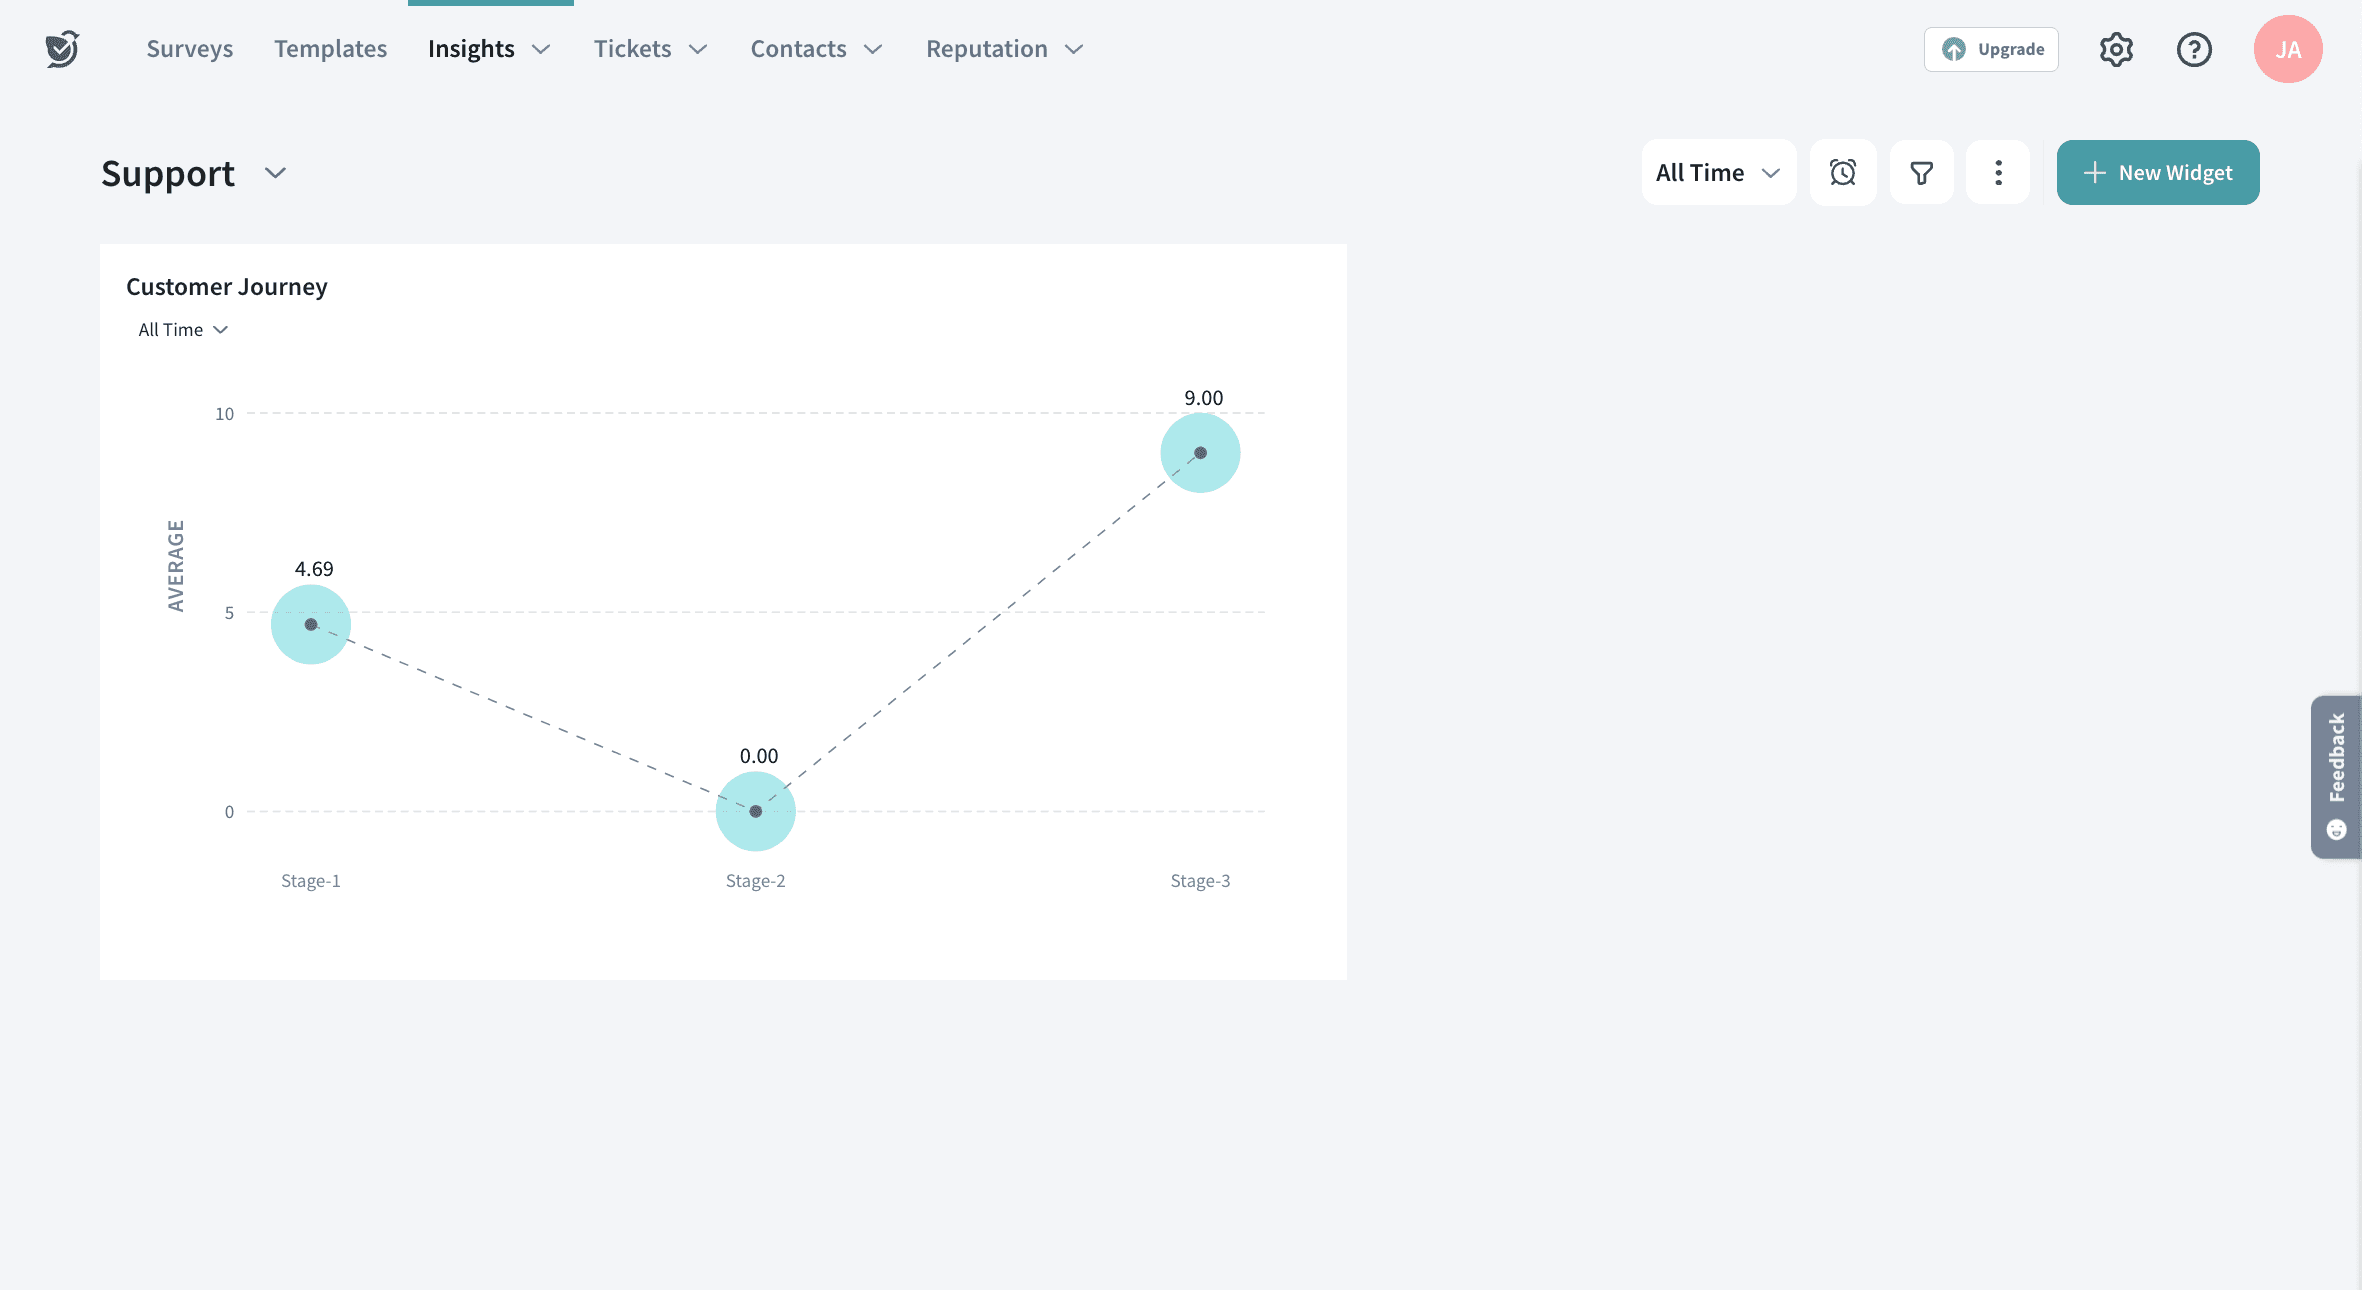
That’s all. The journey chart is added as part of the dashboard.
Now that we have created a journey chart. Let’s learn about the advantages and use cases for it.
Well, the usecases are limitless for Journey charts!
Let us know in the comments if you have an interesting use case. We are more than happy to add that to the document.
Powered By SparrowDesk