The Van Westendorp Price Sensitivity Meter is a market research technique used to identify the price range customers consider acceptable for a product or service. Instead of testing purchase intent, it measures perceptions of pricing by asking customers four key questions: at what price the product is too expensive, too cheap, expensive but still worth considering, and cheap but still acceptable. By analyzing the overlap of these responses, businesses can determine an optimal price point and acceptable price range.
This helps:
Reveal customer perceptions of value and price tolerance.
Identify a pricing “sweet spot” that balances affordability and profitability.
Businesses set competitive prices and avoid pricing missteps.
Let’s look at an example to understand.
An automobile company is getting ready to introduce a new electric SUV. They know it stands out with its innovation and quality, but they need insight into how buyers would evaluate its price and what range feels acceptable.
Using the Van Westendorp method, they can:
Ask customers four questions to gauge when the SUV would seem too cheap, cheap but acceptable, expensive but worth considering, and too expensive.
Analyze these responses to outline a pricing range that aligns with customer expectations.
Identify the sweet spot where perceived value is high and hesitation is low.
Use this insight to set a price that feels fair while supporting the company’s positioning and margins.
This approach helps the brand price strategically by leaning on customer perceptions rather than guesswork or internal assumptions.
Let’s now set up a Van Westendorp question
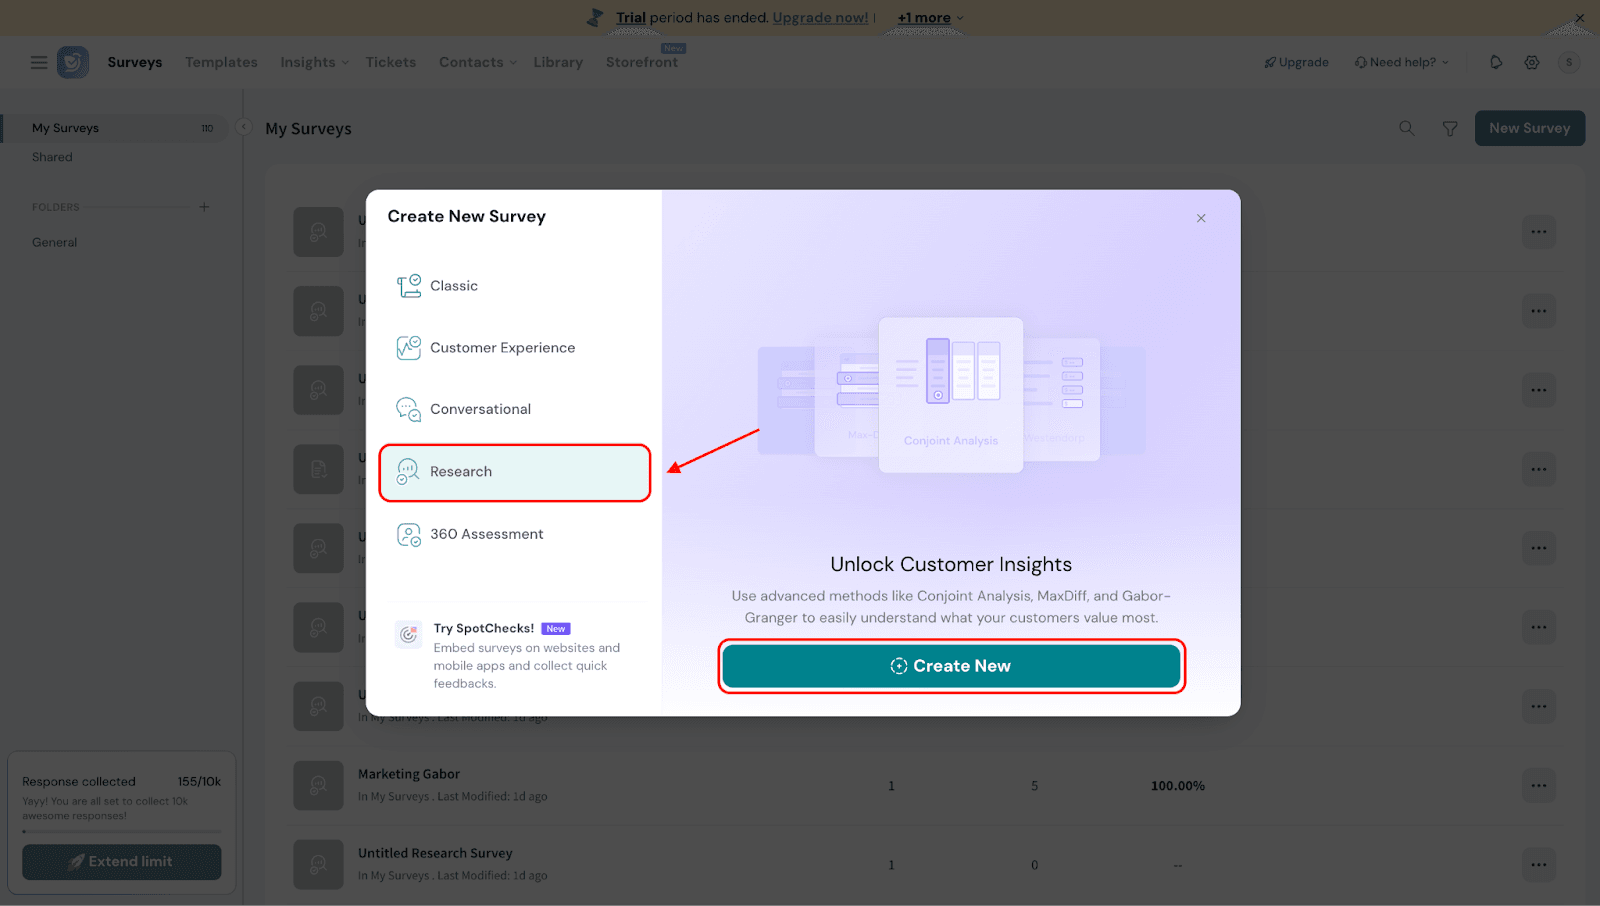
Navigate to the Research section and select “Create New.”
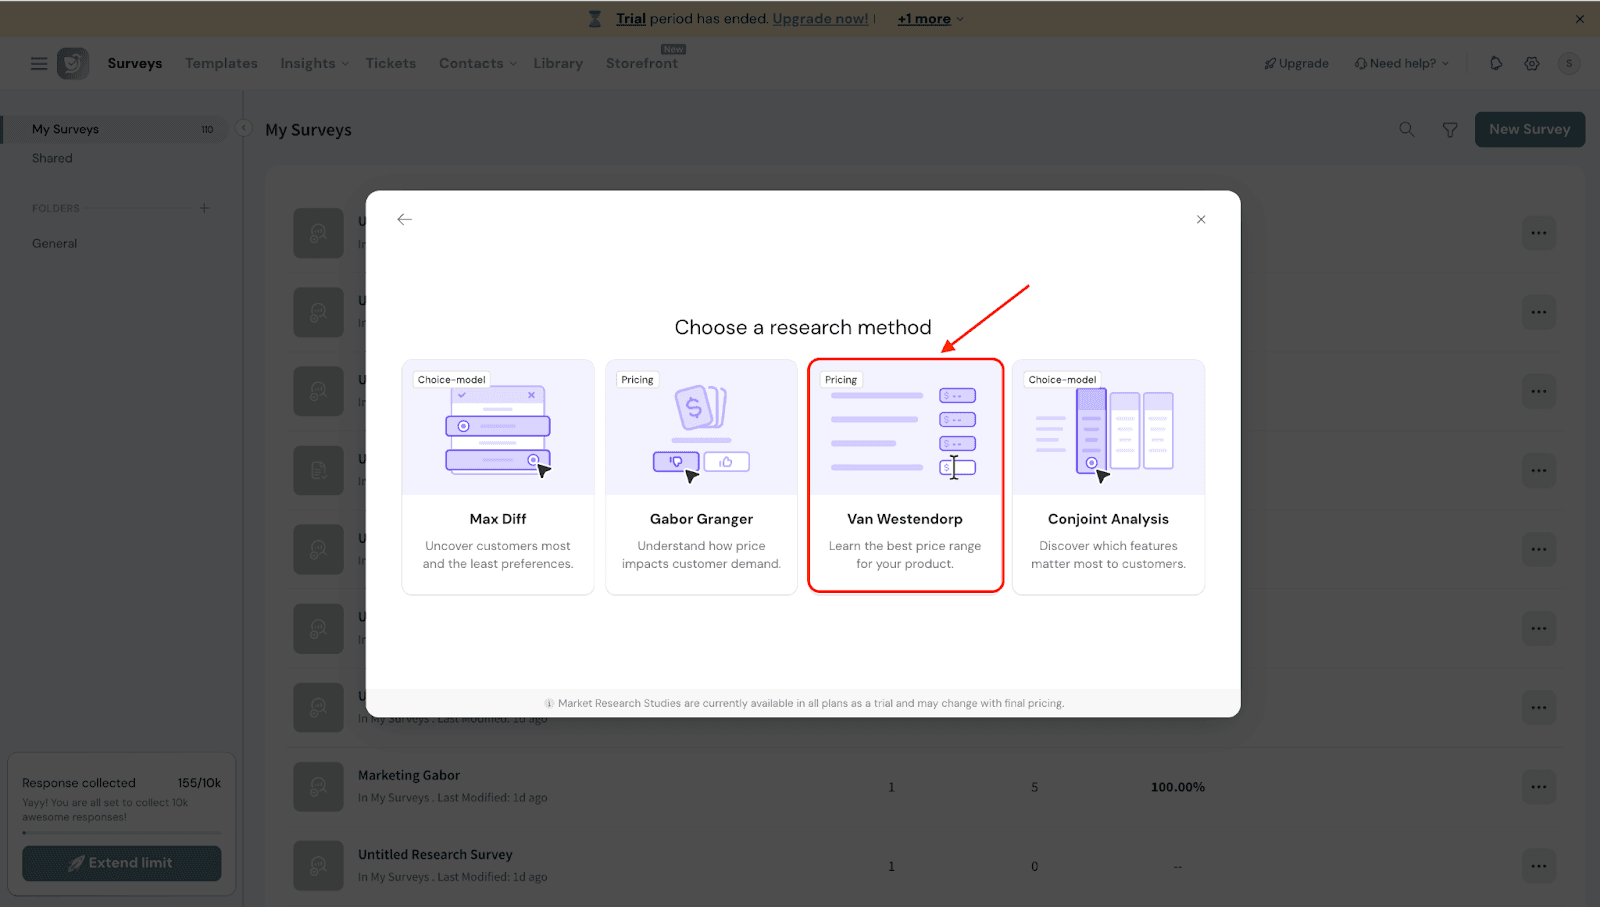
You will see four research methods. Select Van Westendorp.
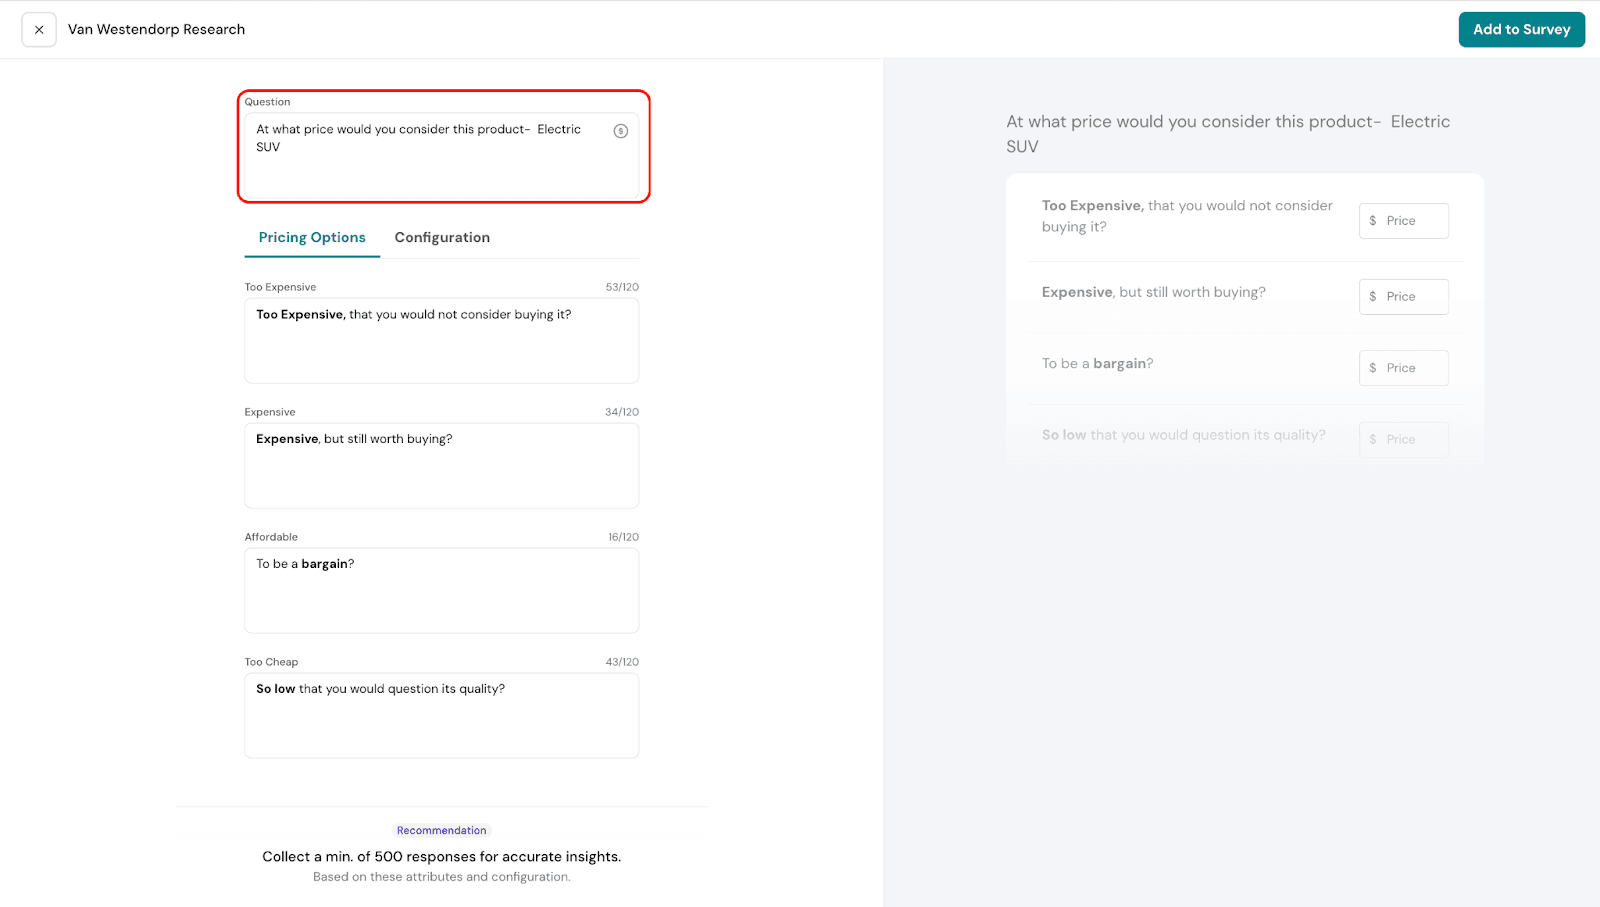
You can edit the question however you like. By default, it will read: “At what price would you consider this product”
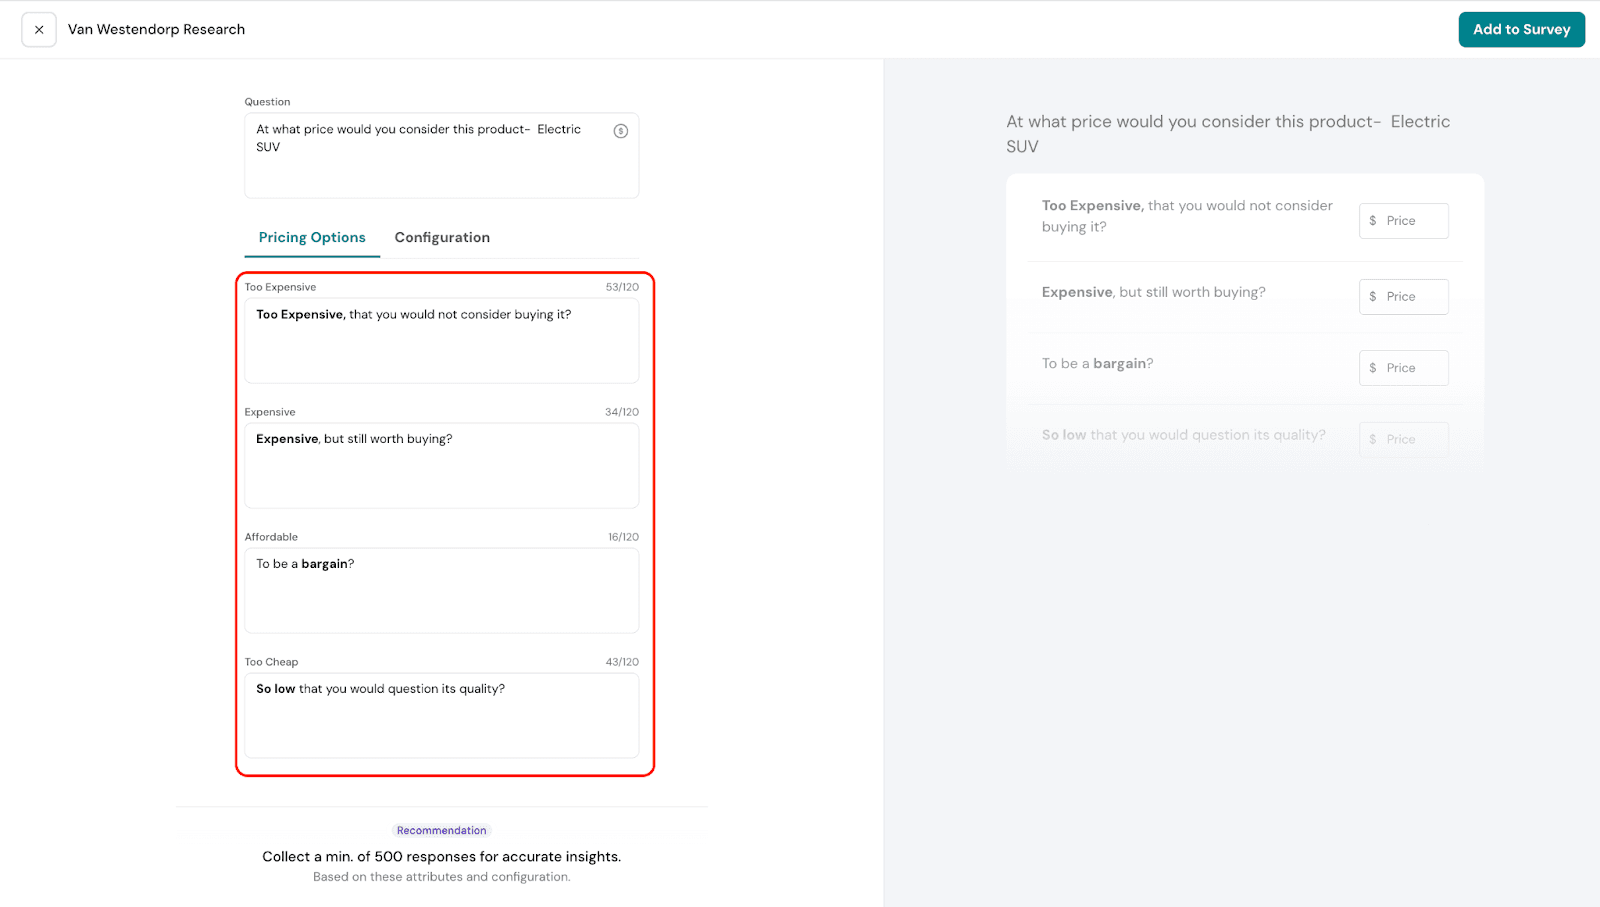
Under Pricing Options, you’ll find four categories: Too Expensive, Expensive, Affordable, and Too Cheap. You can edit the text for each category to frame the questions in a way that best fits your research needs.
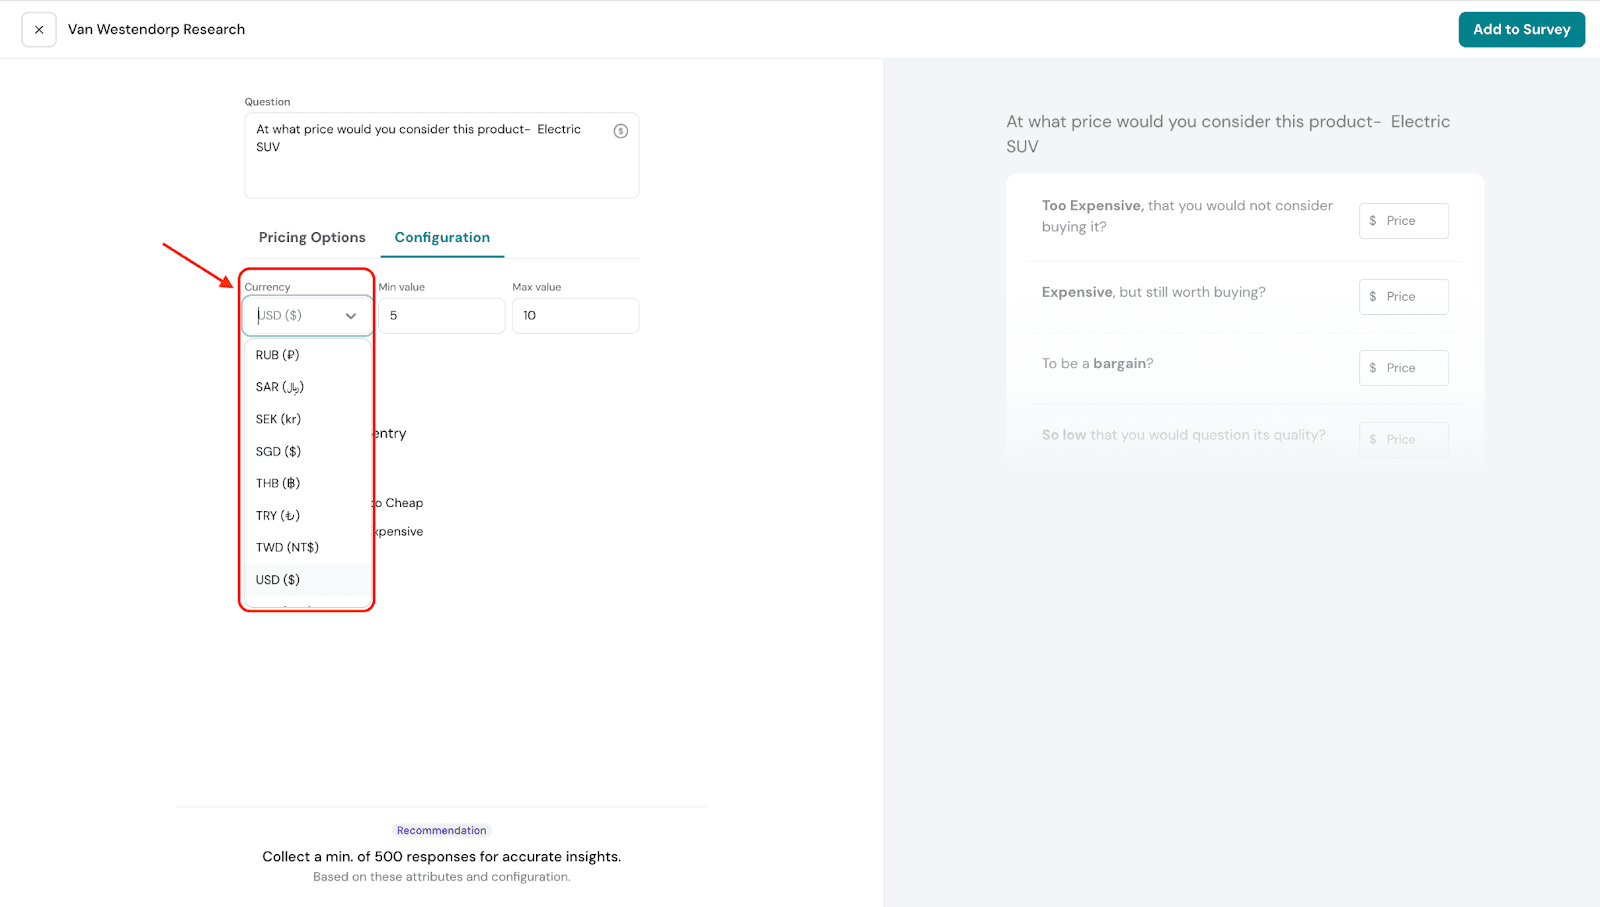
5. Under Configuration, you can choose the currency for your survey. This setting controls how all price points are shown to respondents, helping maintain clarity and consistency throughout the results.
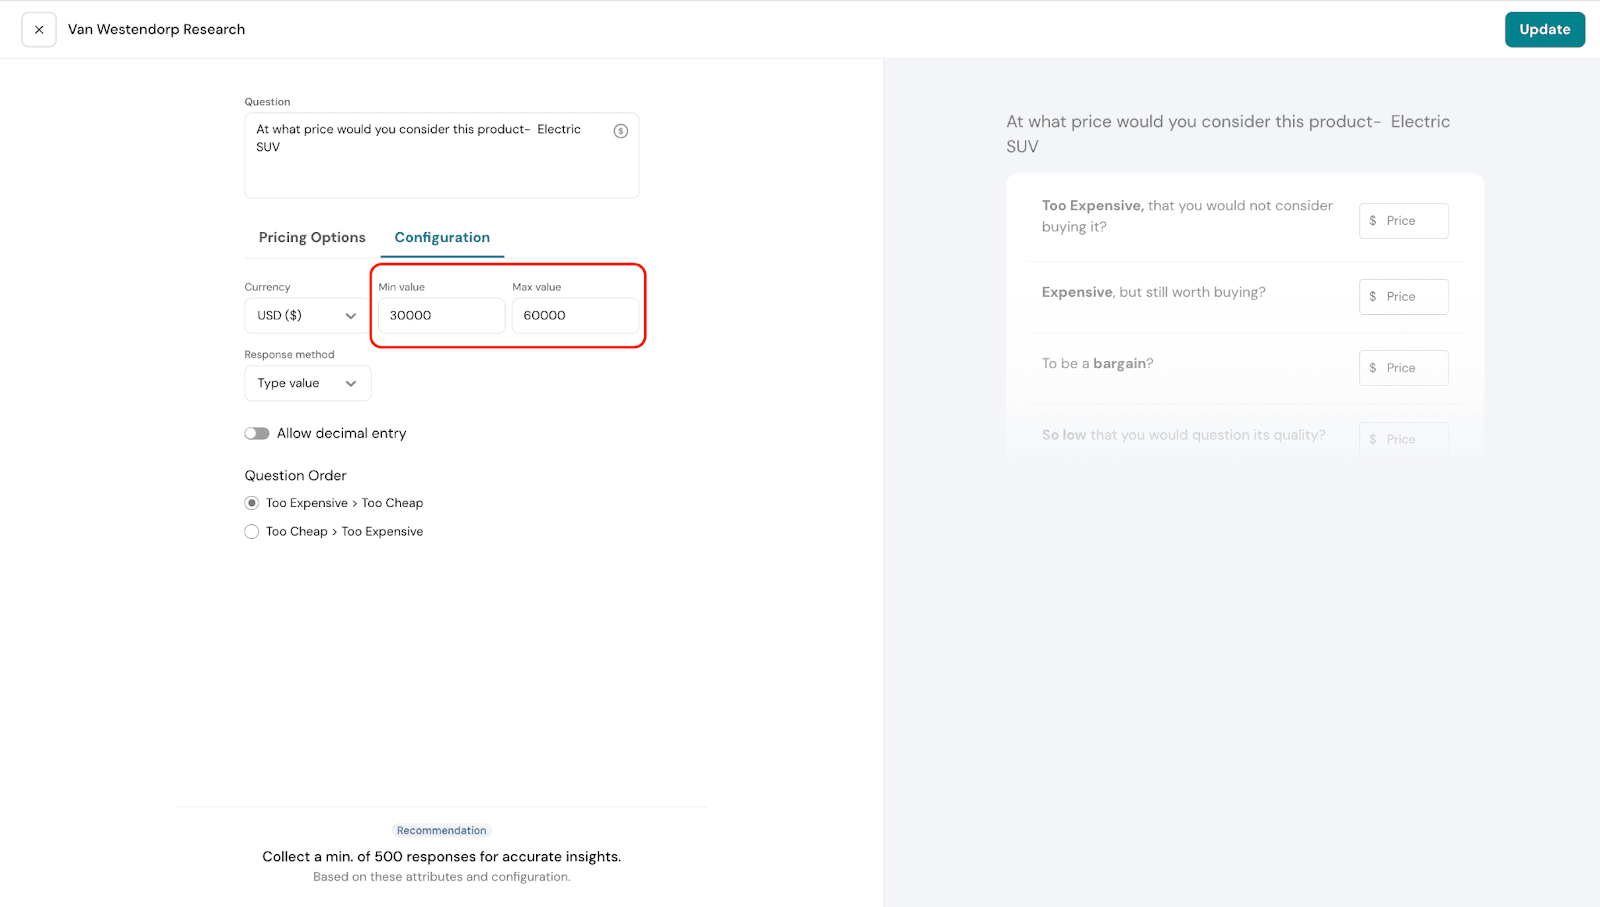
6. You can also set a Minimum Value and Maximum Value. This defines the price range within which customers can share their acceptable prices. For example, in our automobile scenario, you might set the Minimum Value at $30,000 and the Maximum Value at $60,000.
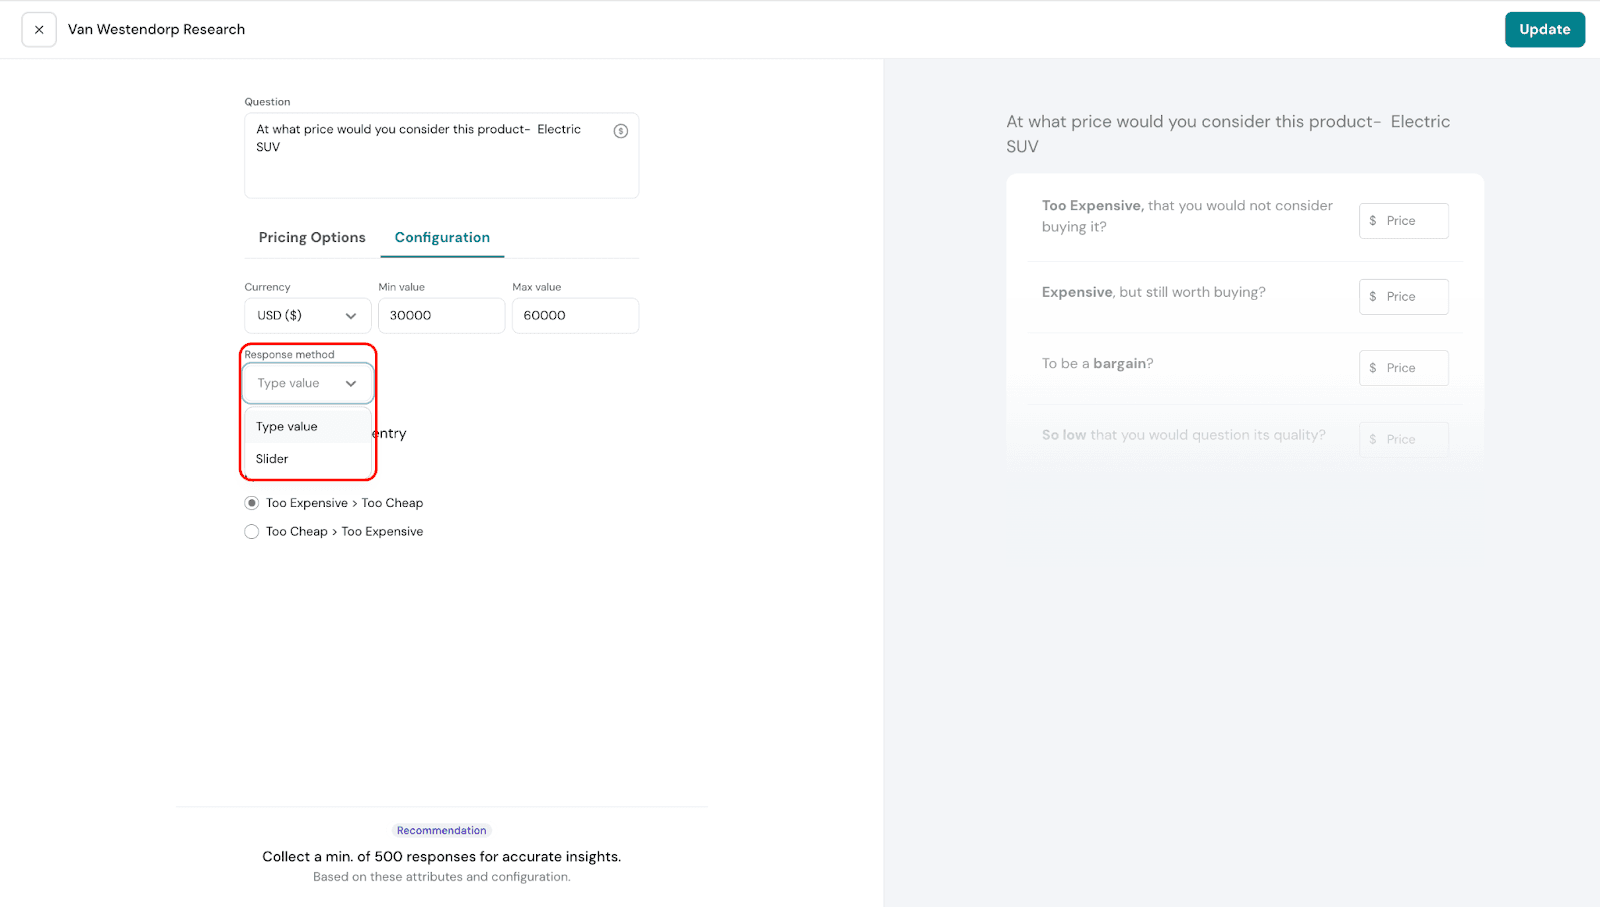
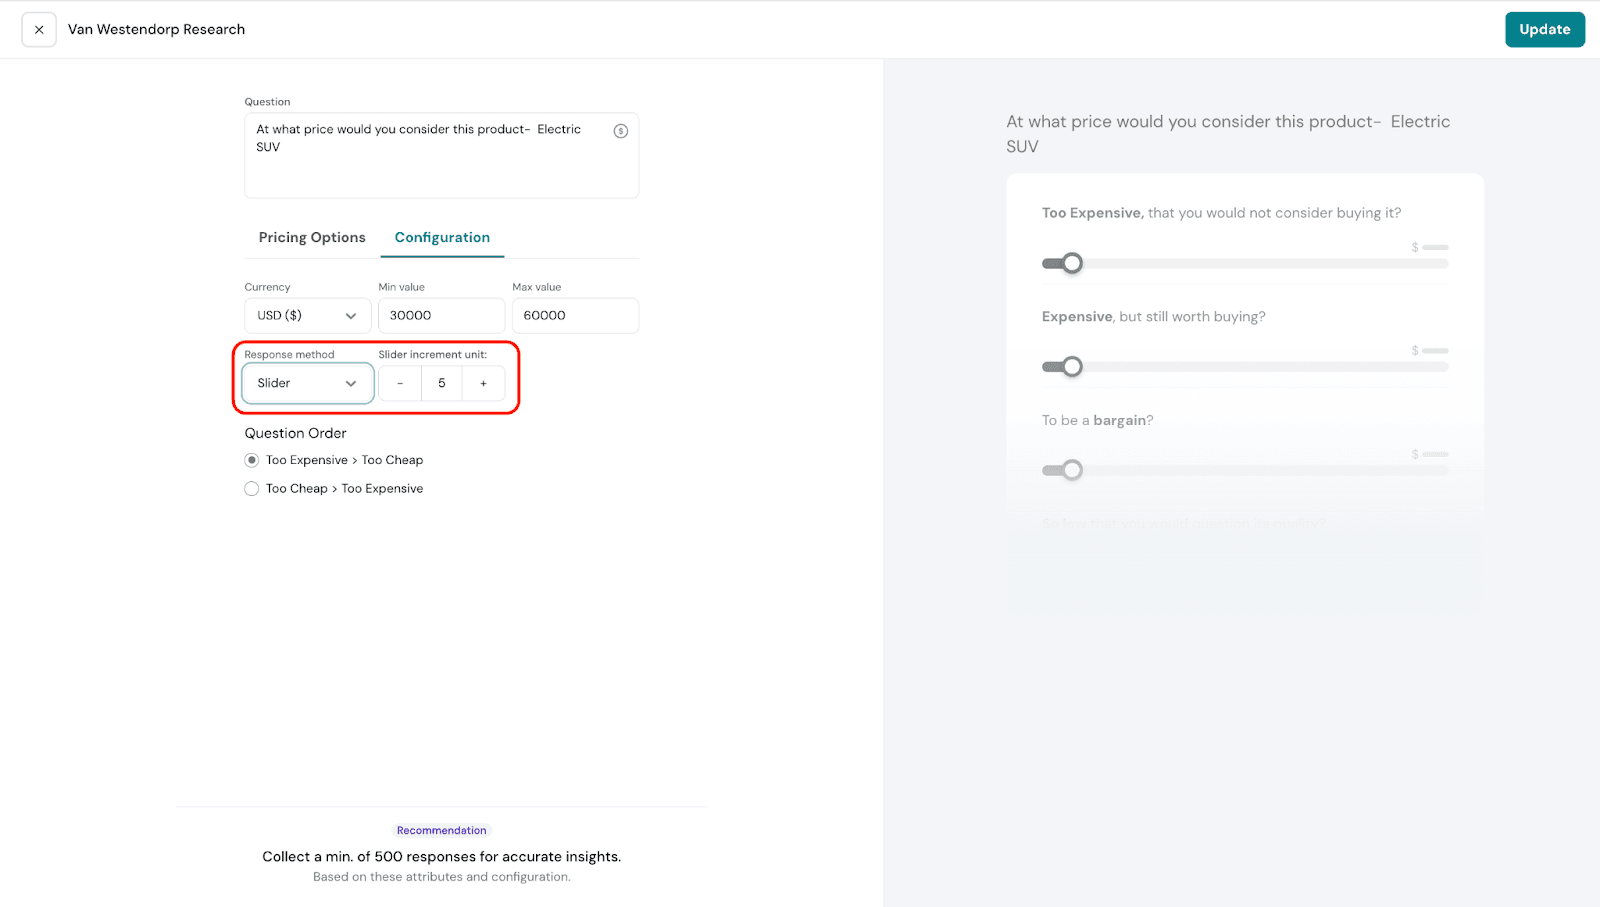
7. In Response Method, you have two options: Type Value and Slider.
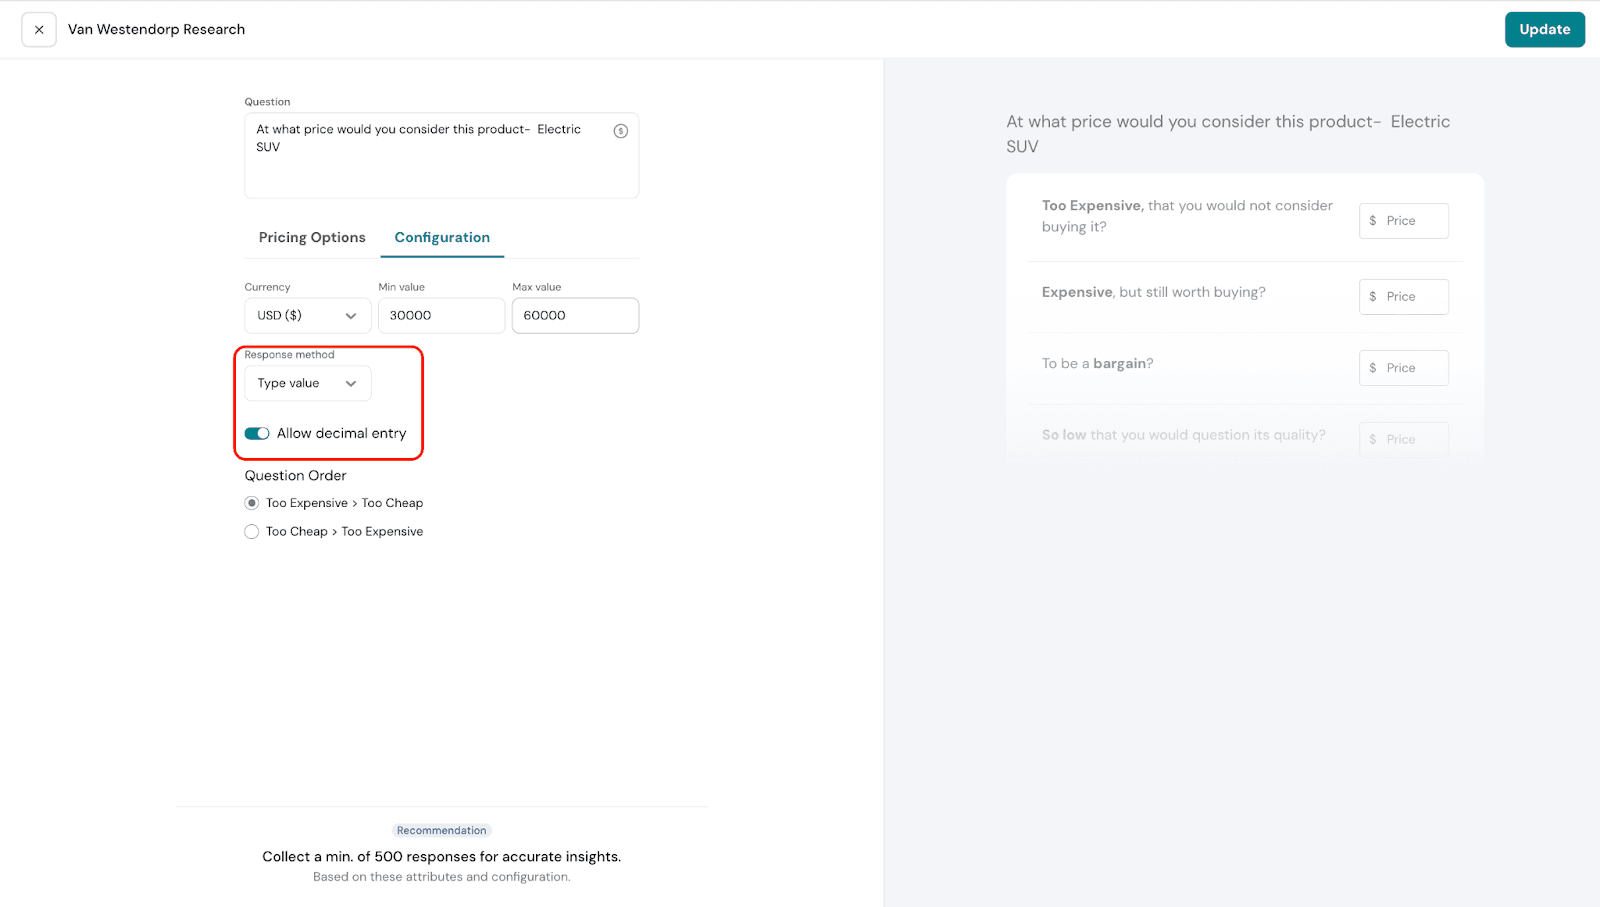
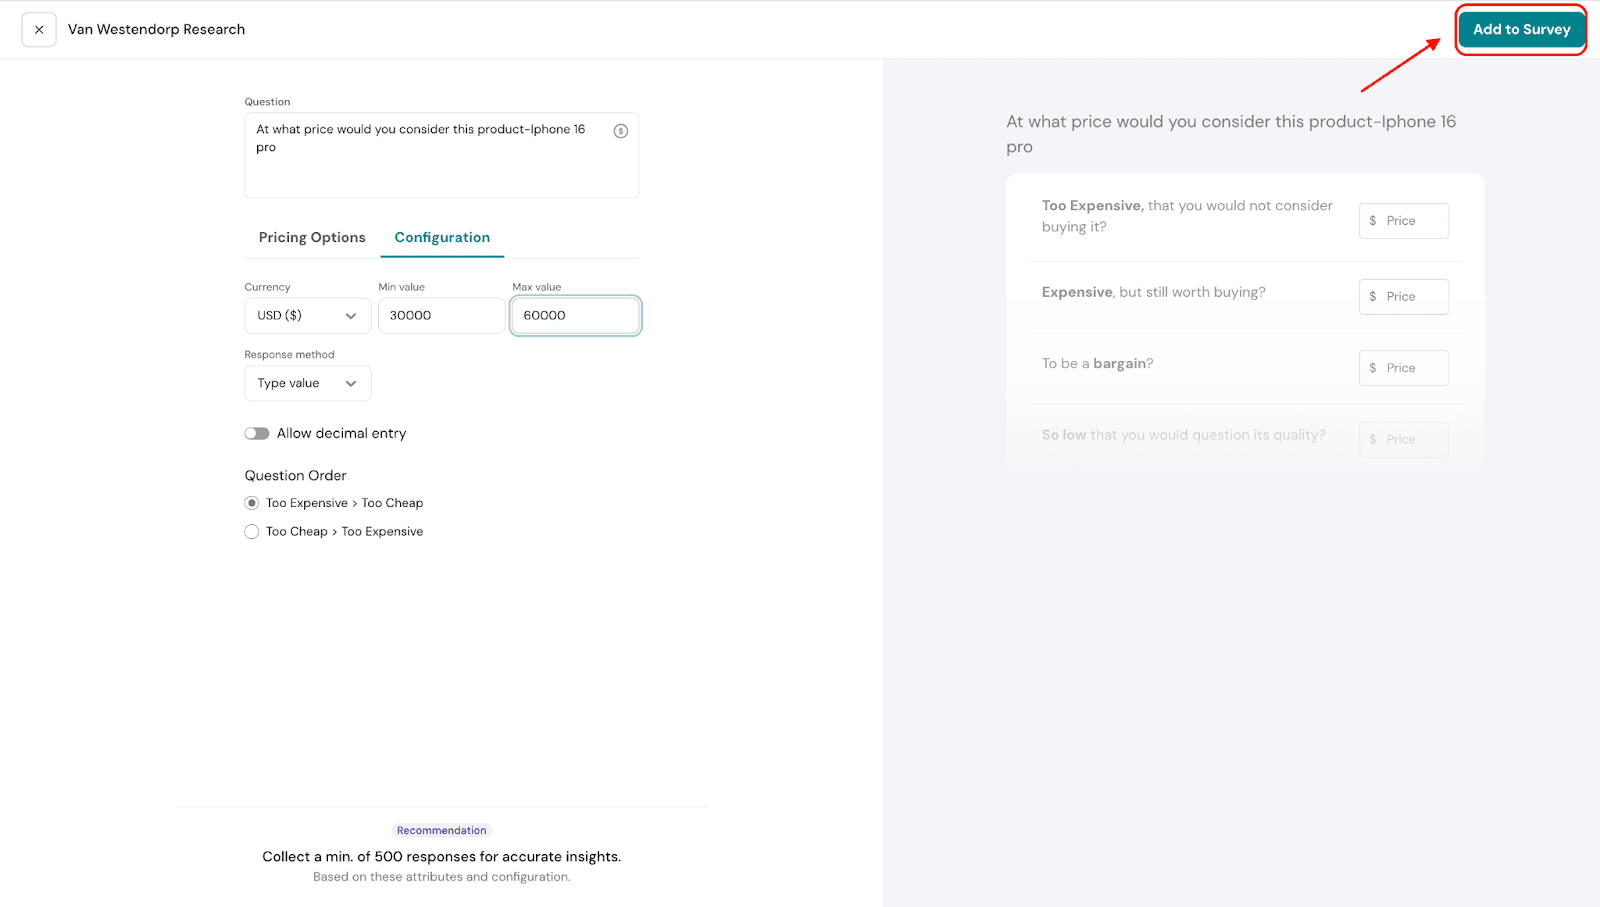
Type Value: Respondents can manually enter the price they find acceptable. Example: A respondent could type in 45250.75 as their preferred price. Note:You can also enable decimal input to allow more precise entries.
Slider: Respondents can use a slider to indicate the price they find acceptable. Example: If you set the slider increment to 500, a respondent could move the slider from 30,000 to 30,500, 31,000, and so on.
Note:Be sure to set the increment unit, which controls how much the value changes with each step.
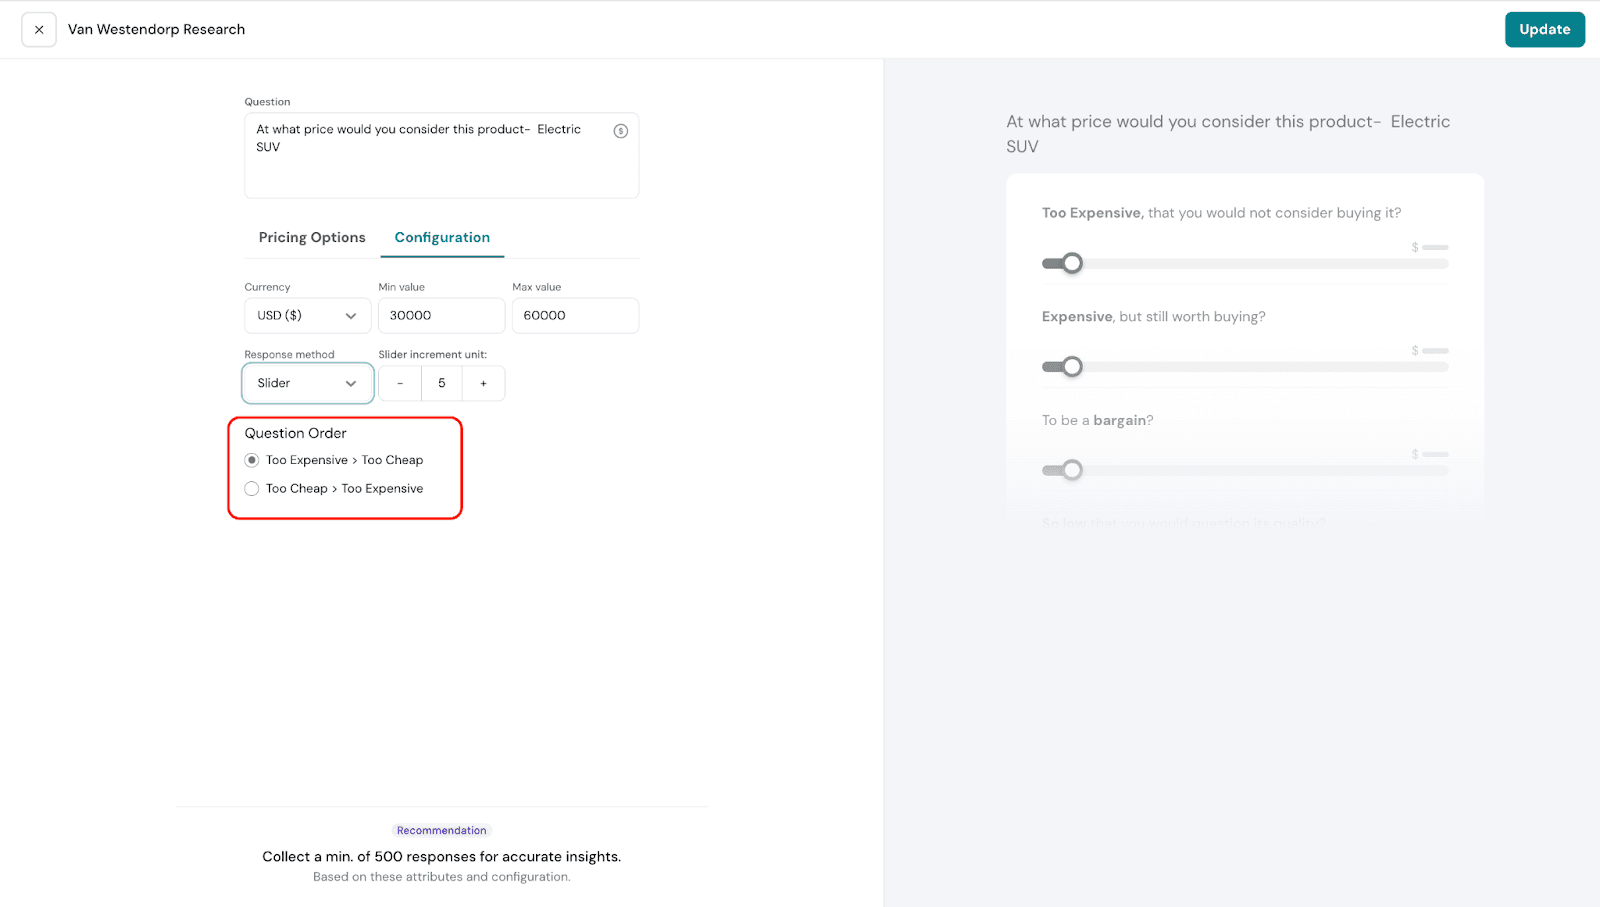
8. Question Order – You can decide the order in which pricing questions appear. For example, you can start by asking about the highest price customers would consider “too expensive” and work your way down to the lowest price they’d see as “too cheap.” Or, you can reverse it by starting with “too cheap” and moving up to “too expensive.” Choose the order that feels most natural for your audience.
9. Once you’re done, click Add to Survey to save and continue building the rest of the survey.
Results Section of Van Westendorp
Let’s take a look at the Results section and see how the reports appear, as well as how to interpret them.
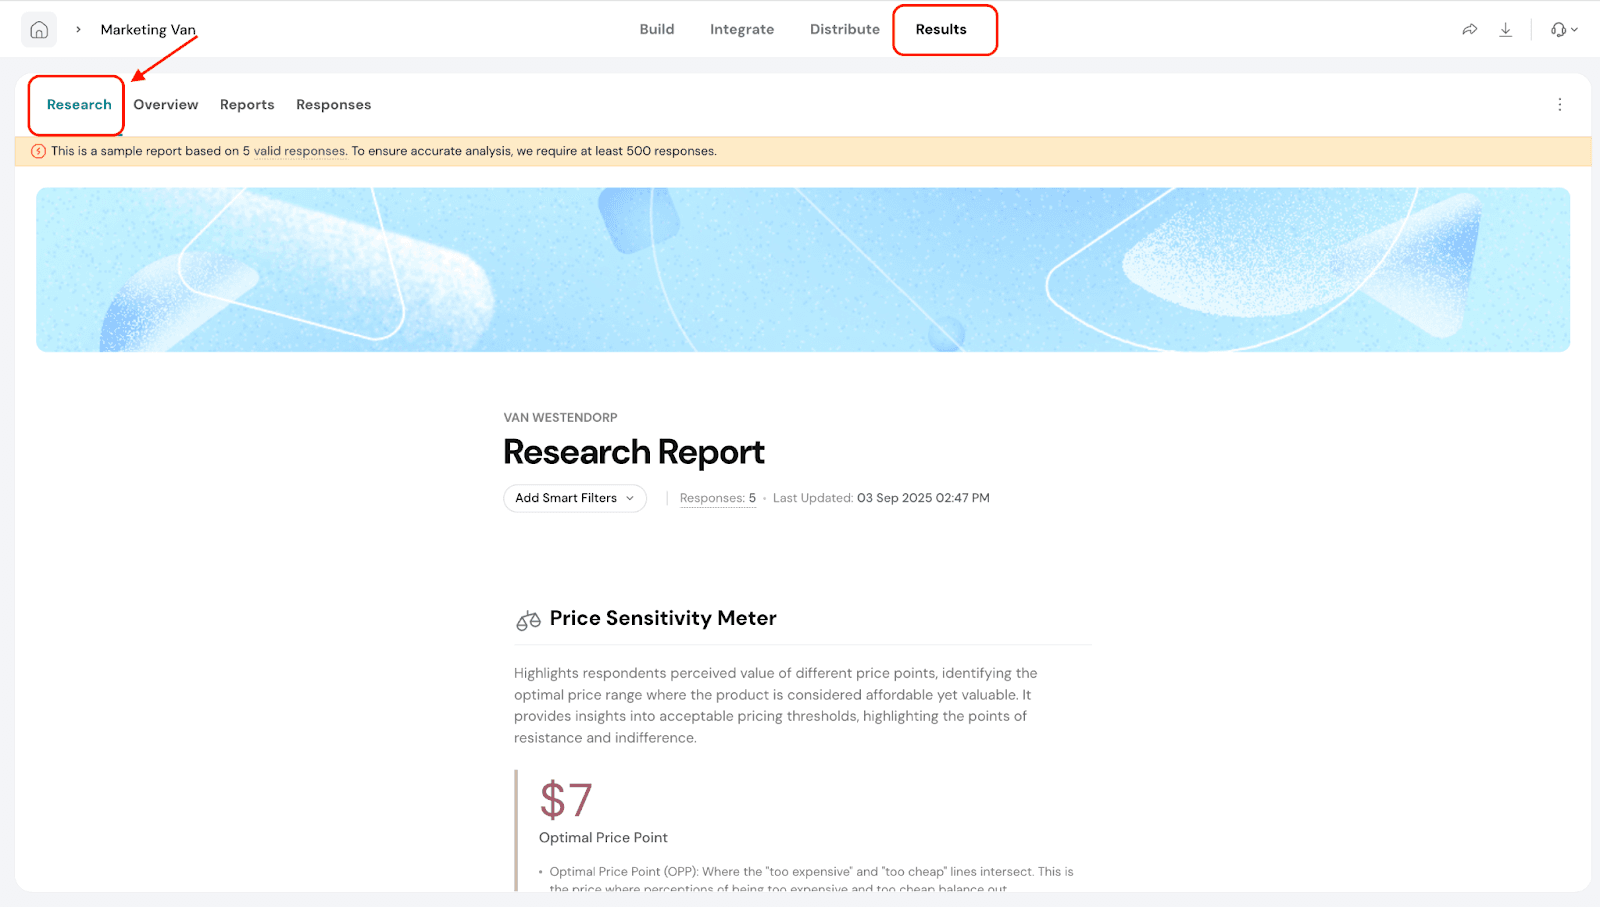
Navigate to the Results section and select Research.
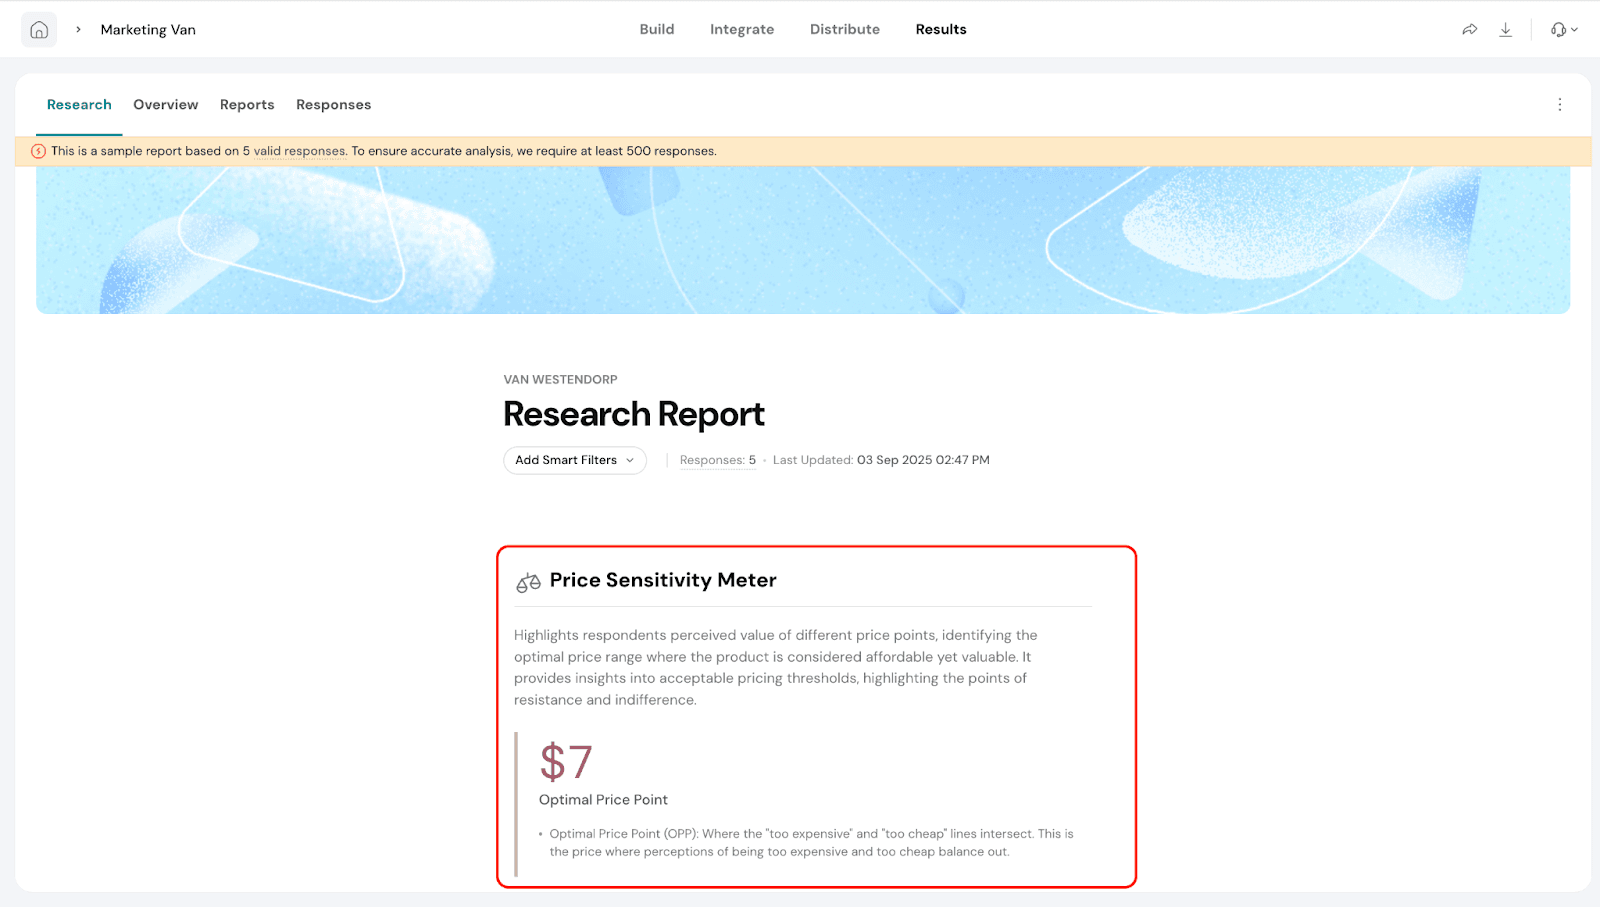
Price Sensitivity Meter measures how customers perceive the value of a product at various price points. It helps pinpoint a price range that feels fair and attractive to buyers, while also revealing the prices that may cause hesitation or have little impact on their decision.
Optimal Price Point: This is where the “too expensive” and “too cheap” lines intersect, representing the price that balances perceptions of being too high or too low.
Example: In our report, the Optimal Price Point is $7. This is the price that most customers see as fair and attractive, making it an ideal choice for launching the product.
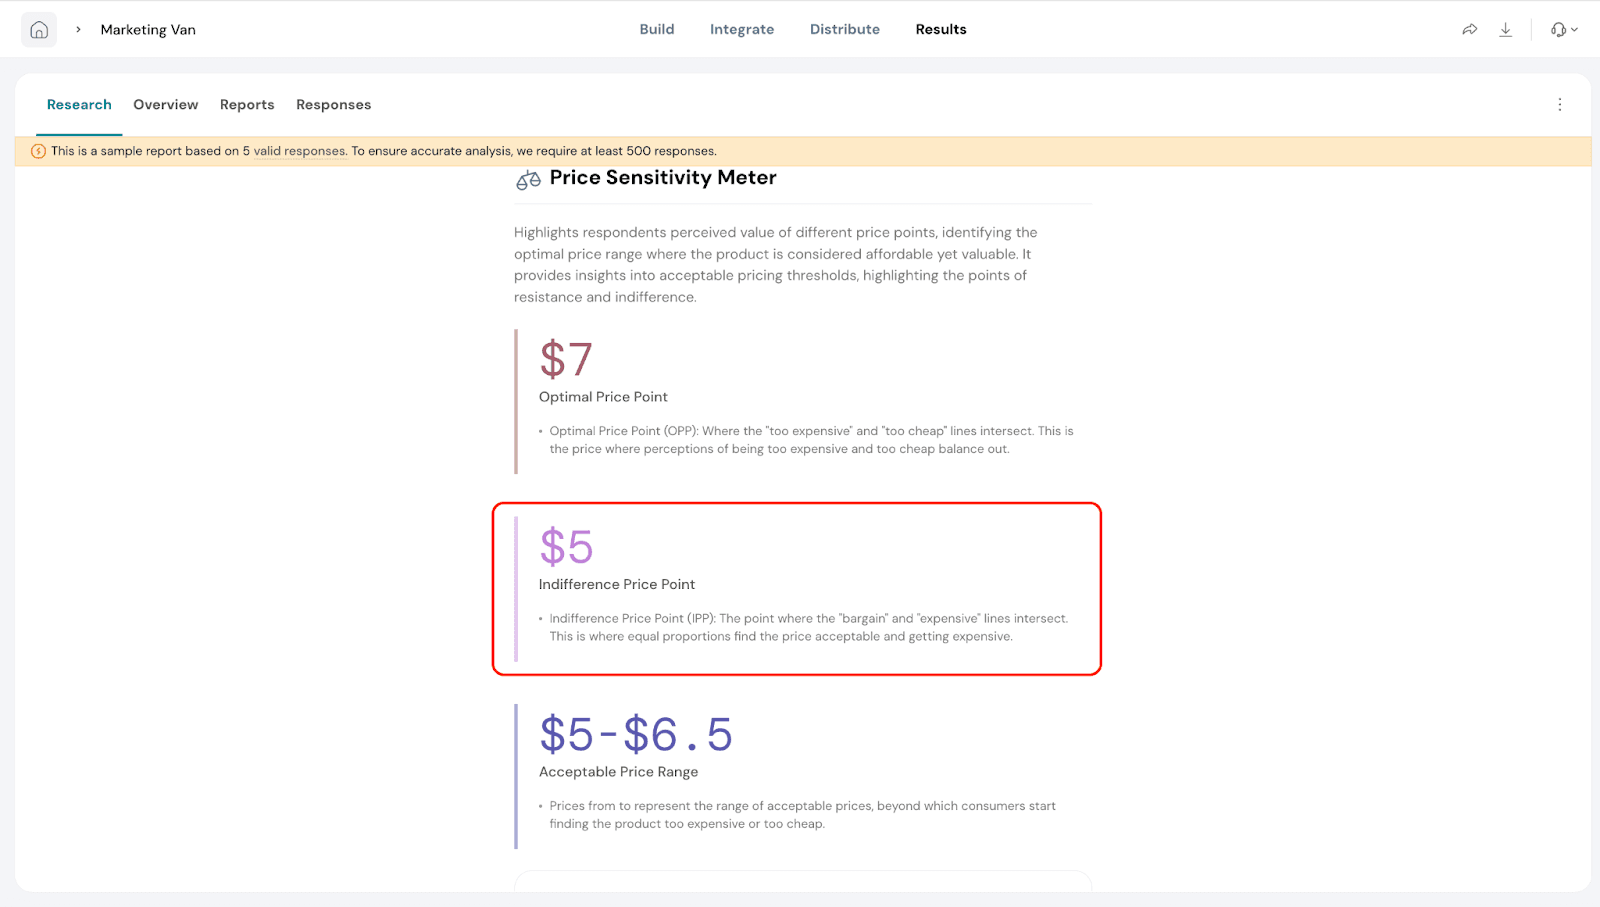
Indifference Price Point (IPP): This is where the "bargain" and "expensive" lines intersect, representing the price threshold where customer perception shifts from value to cost concern.
Example: In our report, the Indifference Price Point is $5. This is the critical pricing sweet spot where equal proportions of customers find the price acceptable versus getting expensive, marking the optimal balance before price resistance begins to impact purchase decisions.
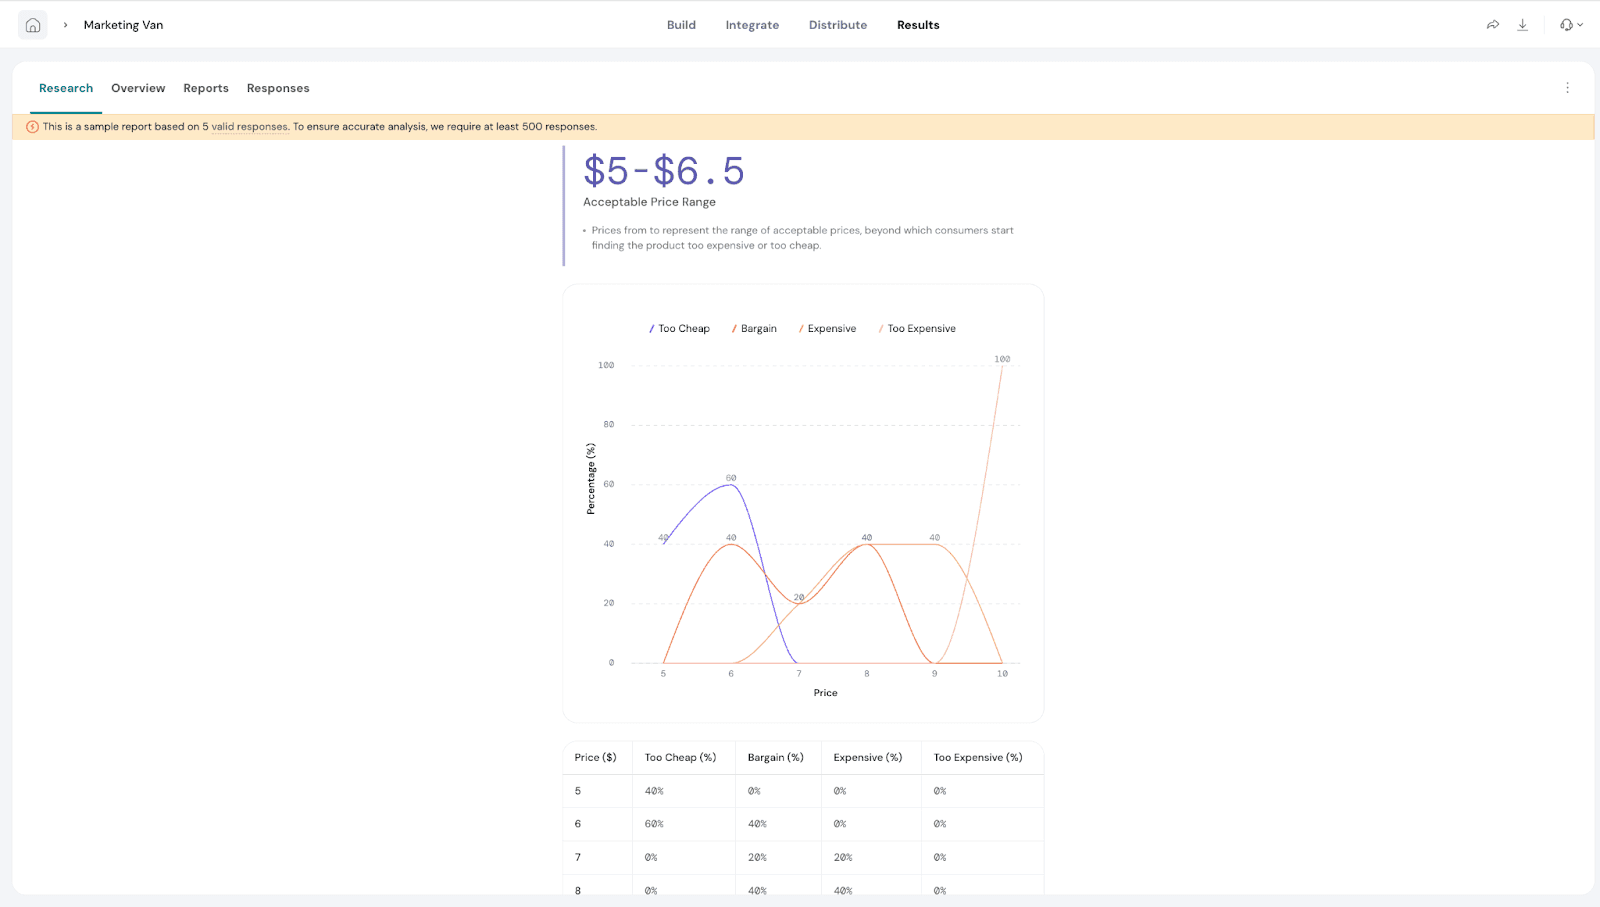
Acceptable Price Range: This is the span of prices customers consider reasonable. Prices below this range are viewed as too cheap, while those above it are seen as too expensive.
In the chart:
The X-axis represents price points.
The Y-axis represents the percentage of respondents.
The chart displays responses across four categories: Too Expensive, Expensive, Bargain, and Too Cheap.
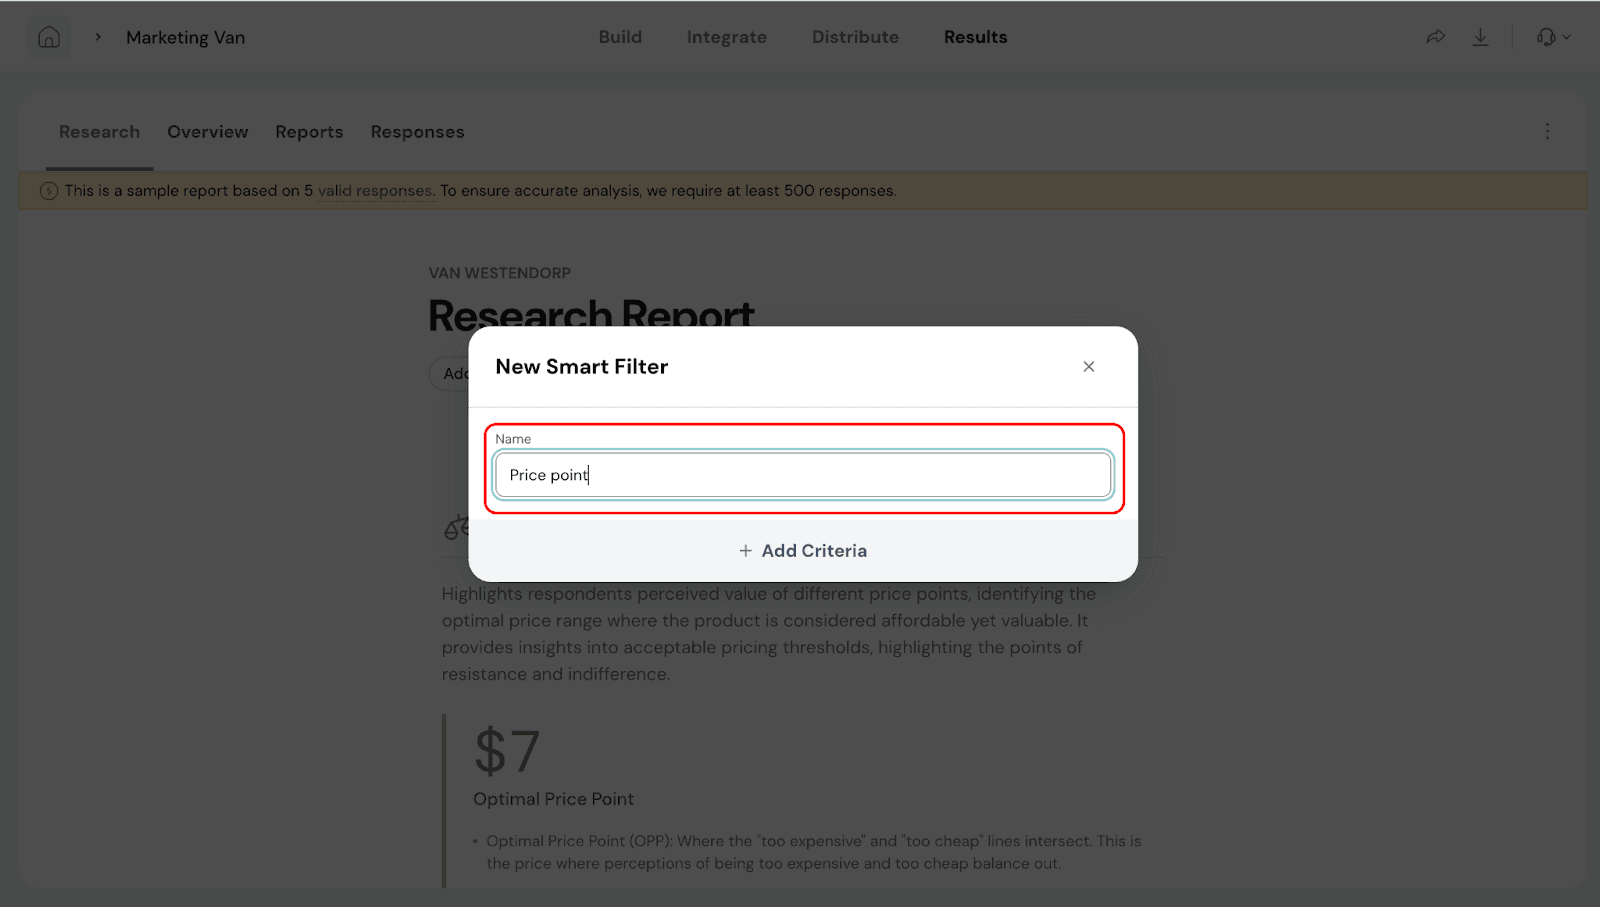
Smart Filters Smart Filters are especially useful when you’ve added extra questions in your Van Westendorp survey. For example, if you ask respondents about their age group, location, or product usage, you can use a filter to compare pricing preferences between different segments. These filters let you focus your analysis on a specific group of respondents, making it easier to uncover trends, compare segments, and draw meaningful conclusions. Once applied, the filters automatically update your charts, tables, and reports to reflect only the data for that group. With Smart Filters, you can save time, reduce manual work, and ensure your pricing insights are always relevant and actionable. Lets see how to create Smart Filters. 1. Go to ‘Add Smart Filters’. 2. Click on Create New Smart Filter. 3. Give a name for your filter and click on Add Criteria.
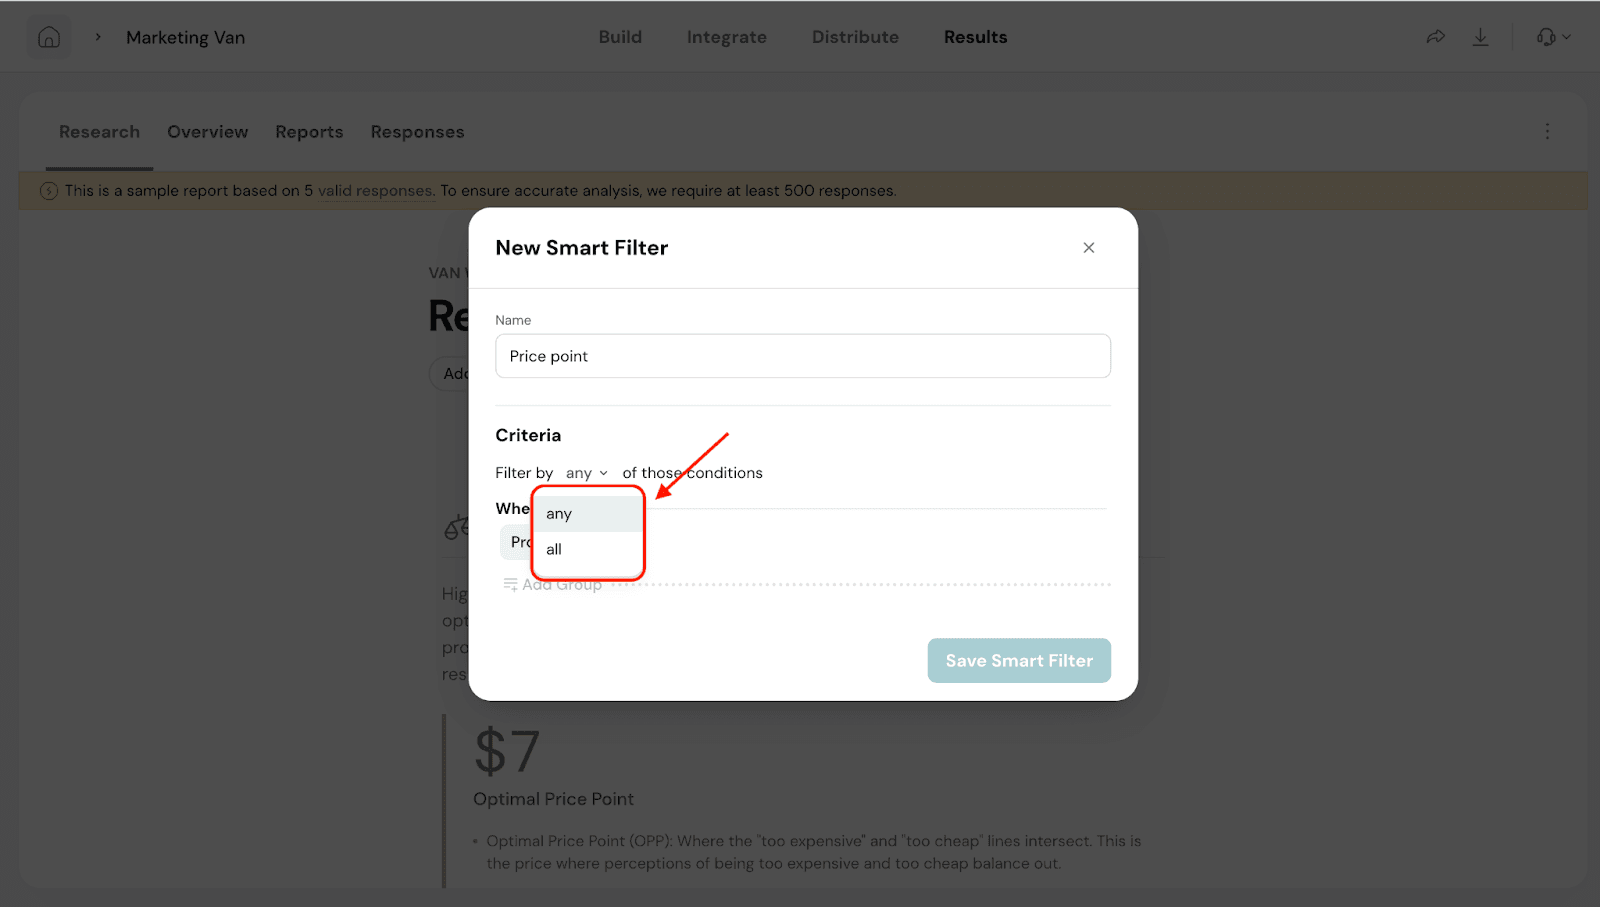
Under Criteria, you will be able to filter by any or all conditions.
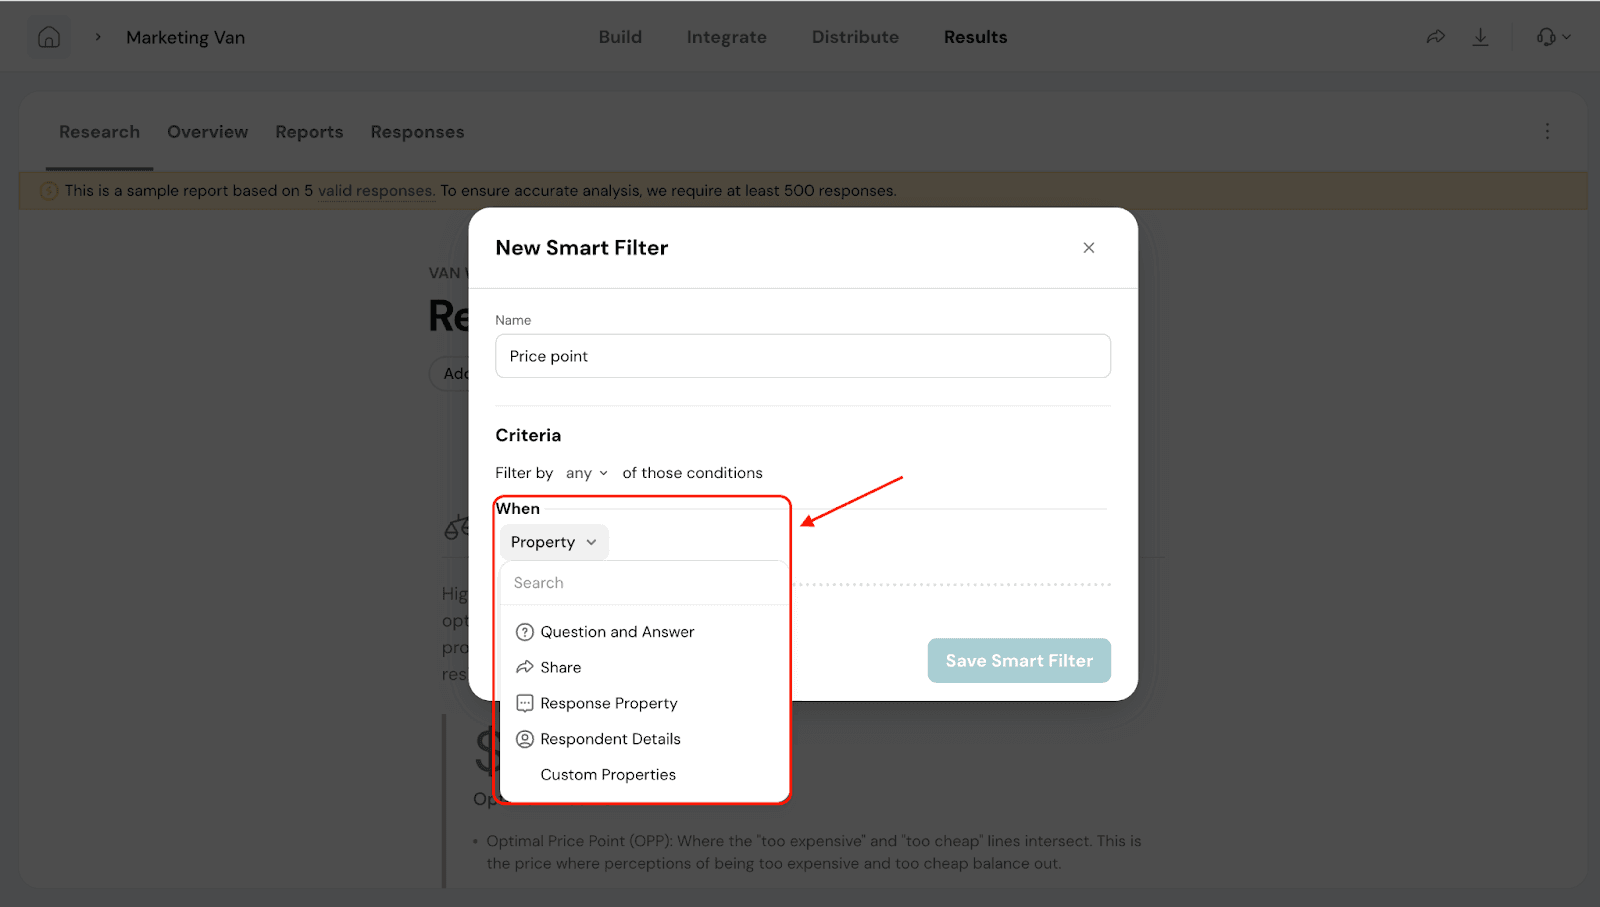
Under When, you will be able to select the property for filtering based on Question and Answer, Share channel, Response Property and Respondent Details.
Note: You can also have multiple Properties to filter. To do this click on ‘Add Group’.
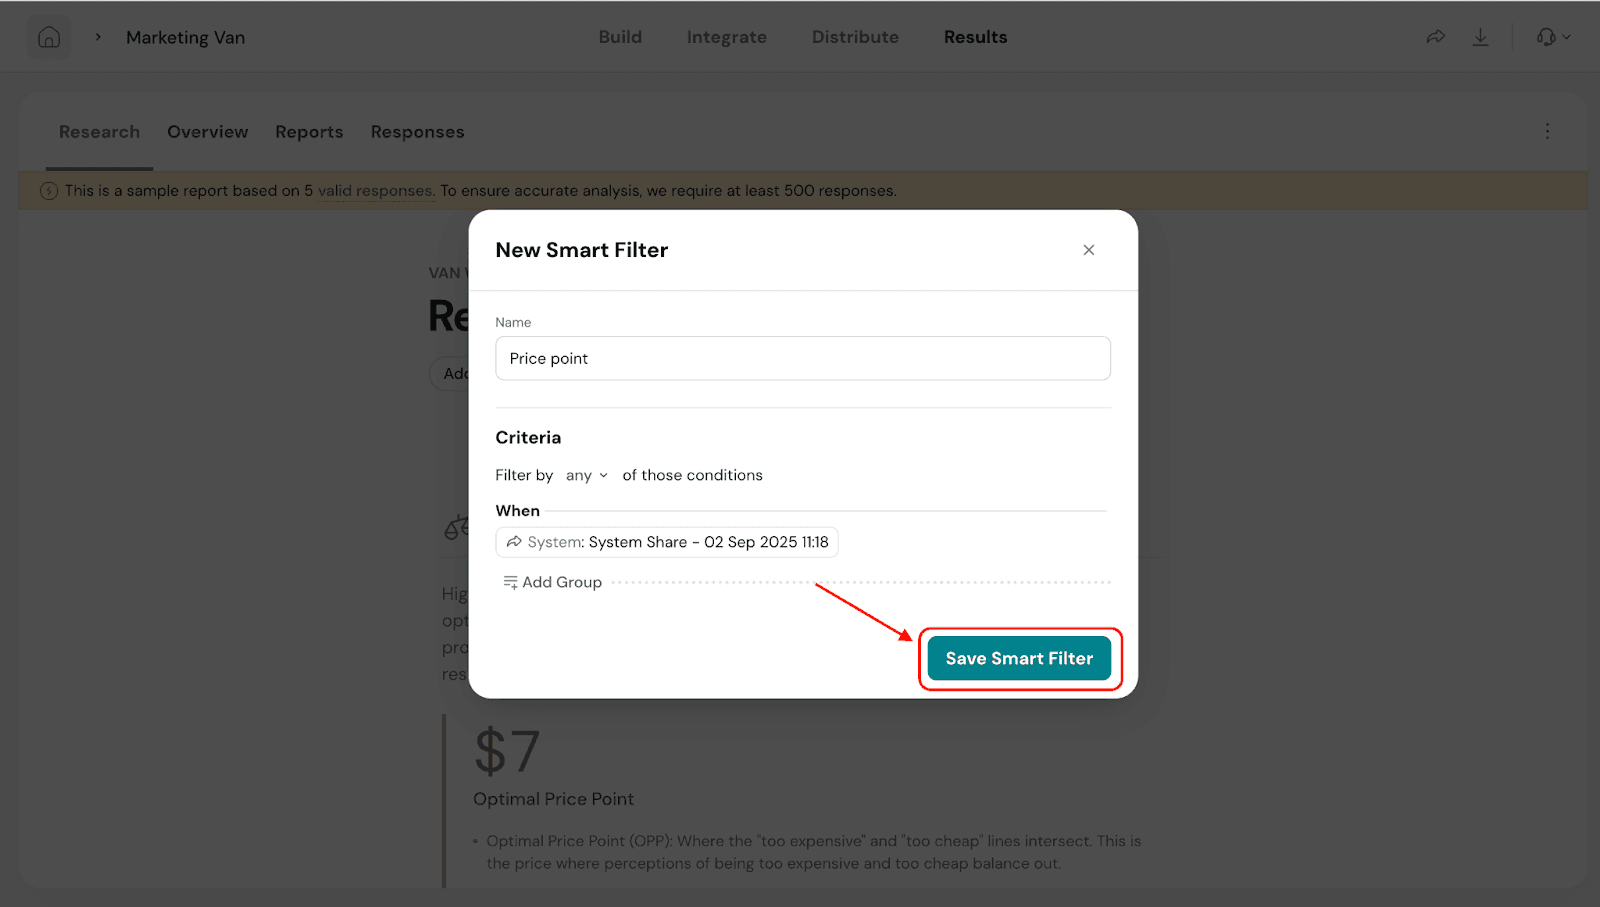
Once done, click on Save Smart Filter.
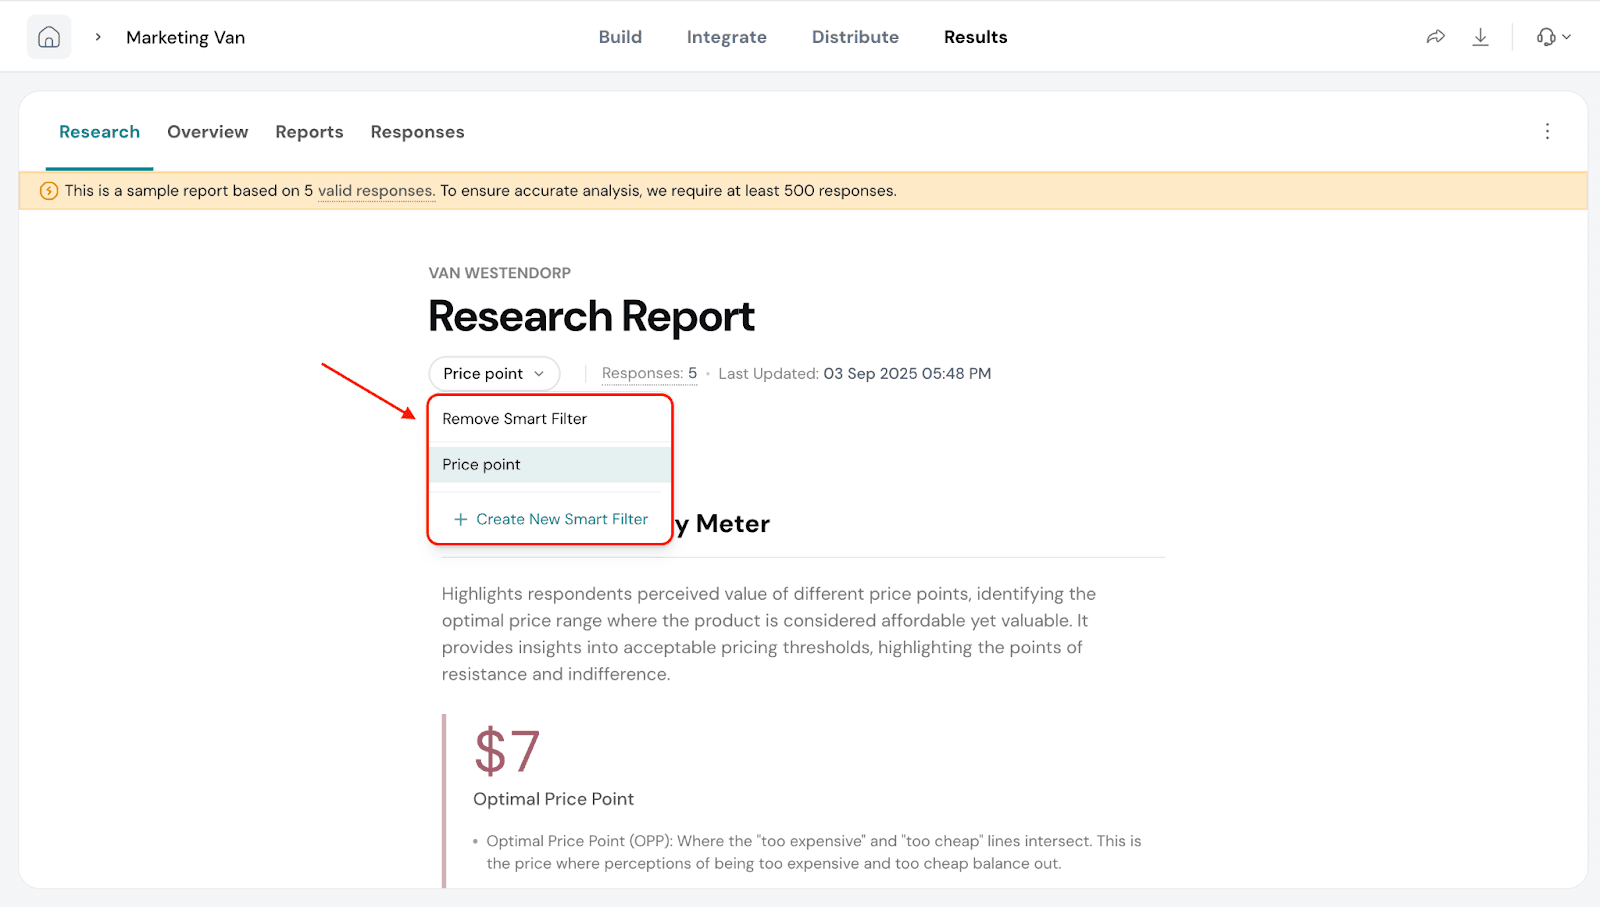
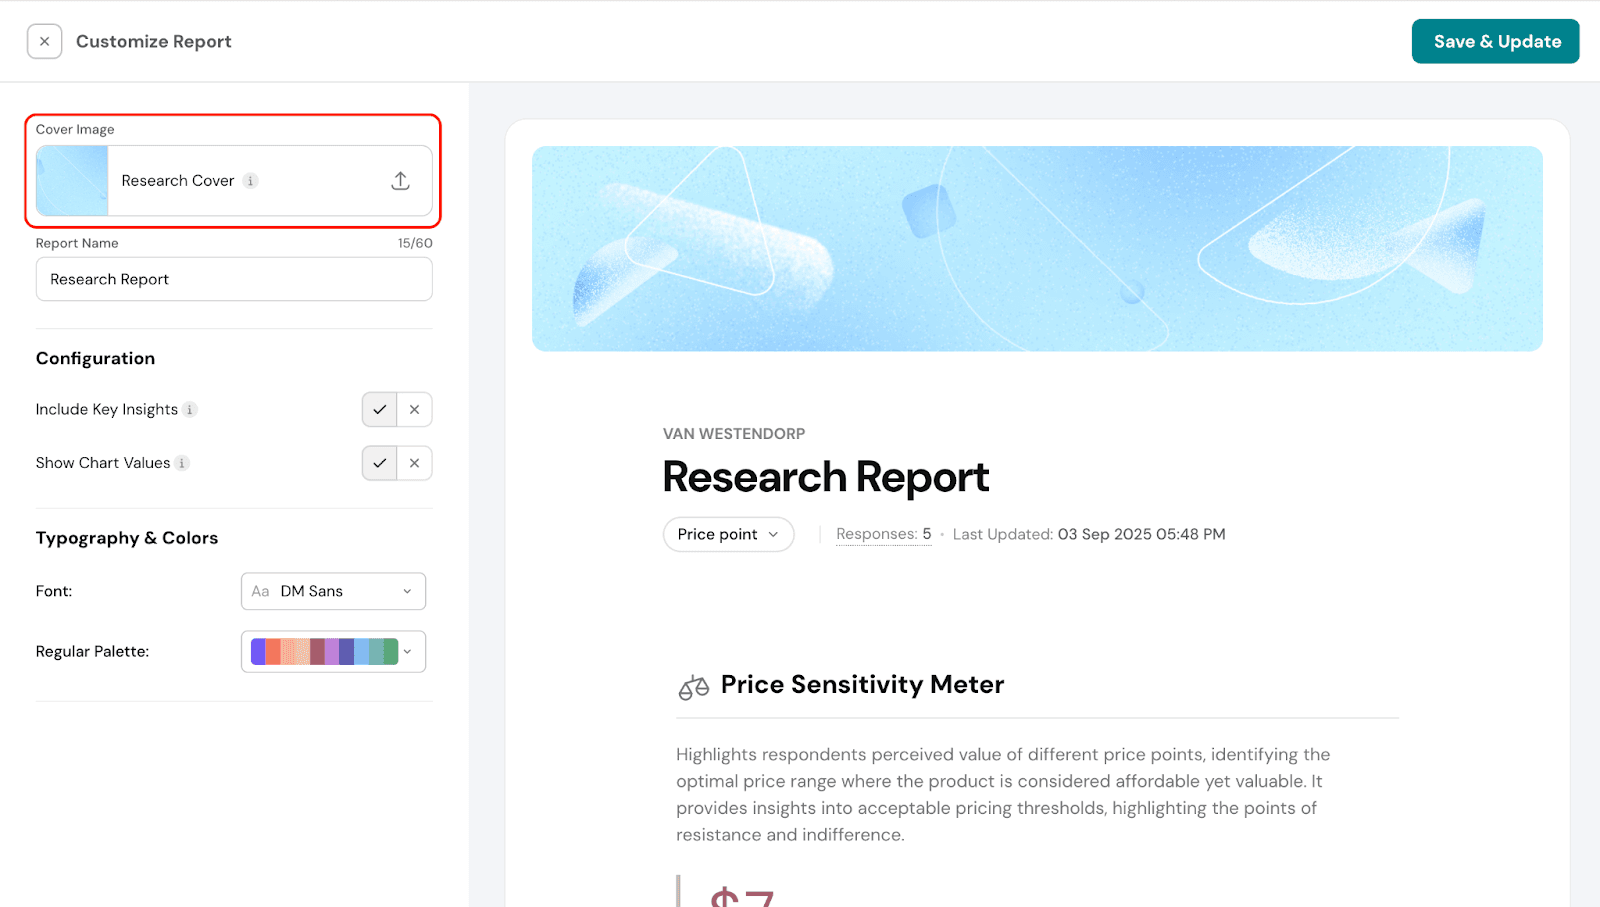
Now, click on Add Smart Filters and you will see a dropdown with the filter name you created. You can choose to apply the filter. Report Customization You can customize the look and content of your report to suit your needs. 1. Click the three dots in the top-right corner of the report and Select Customize Report. You can do the following:
Change the cover image by uploading a design of your choice.
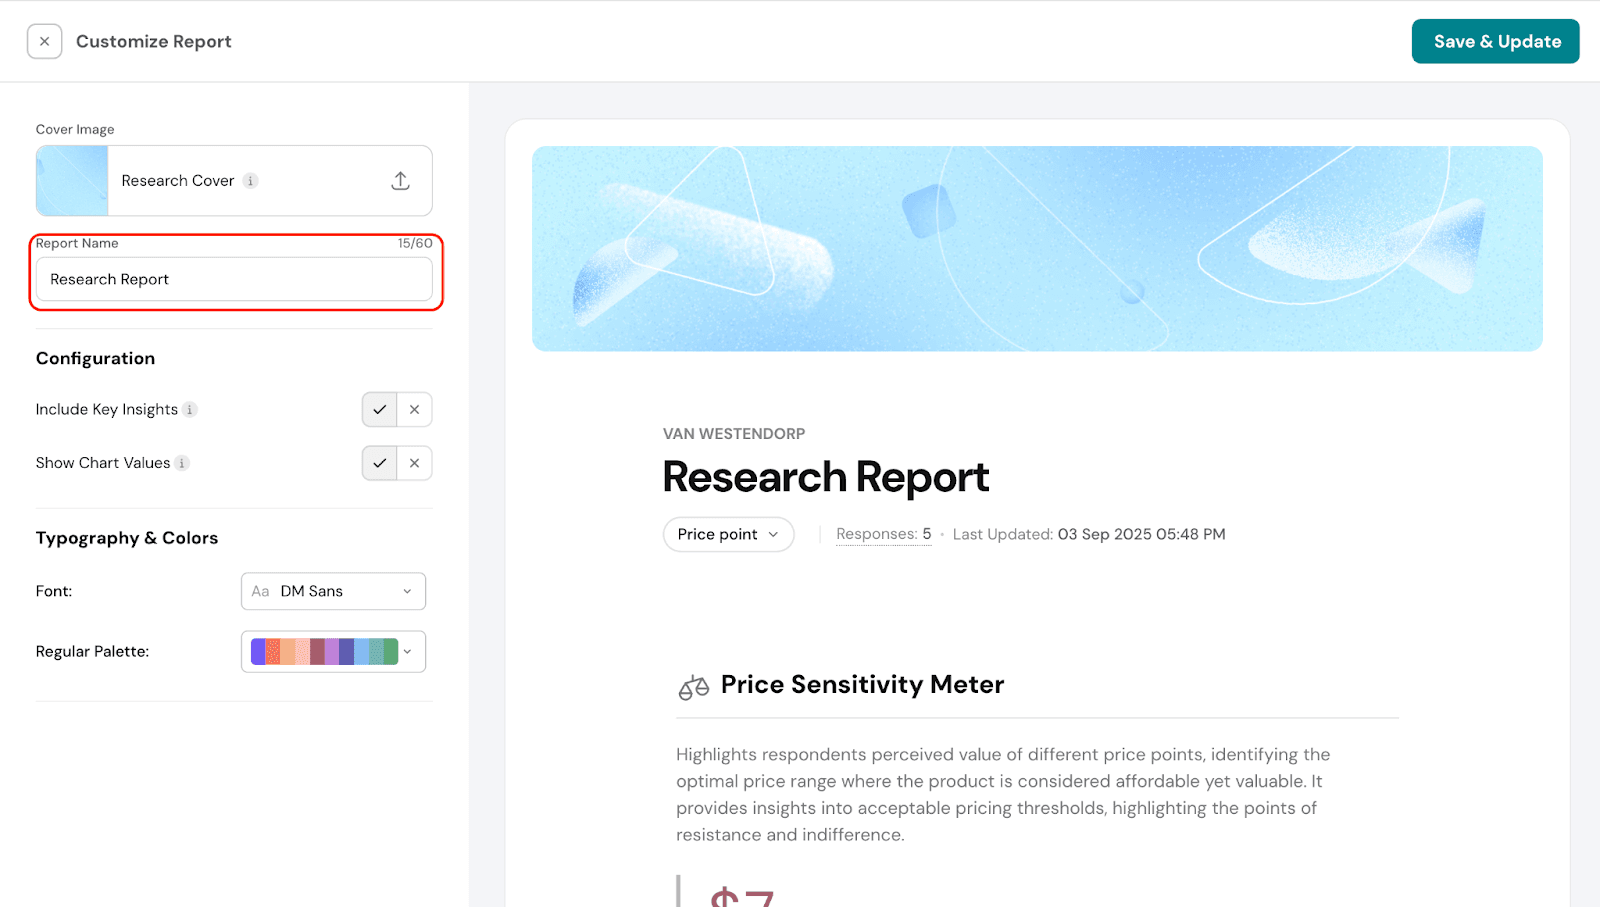
Rename the report.
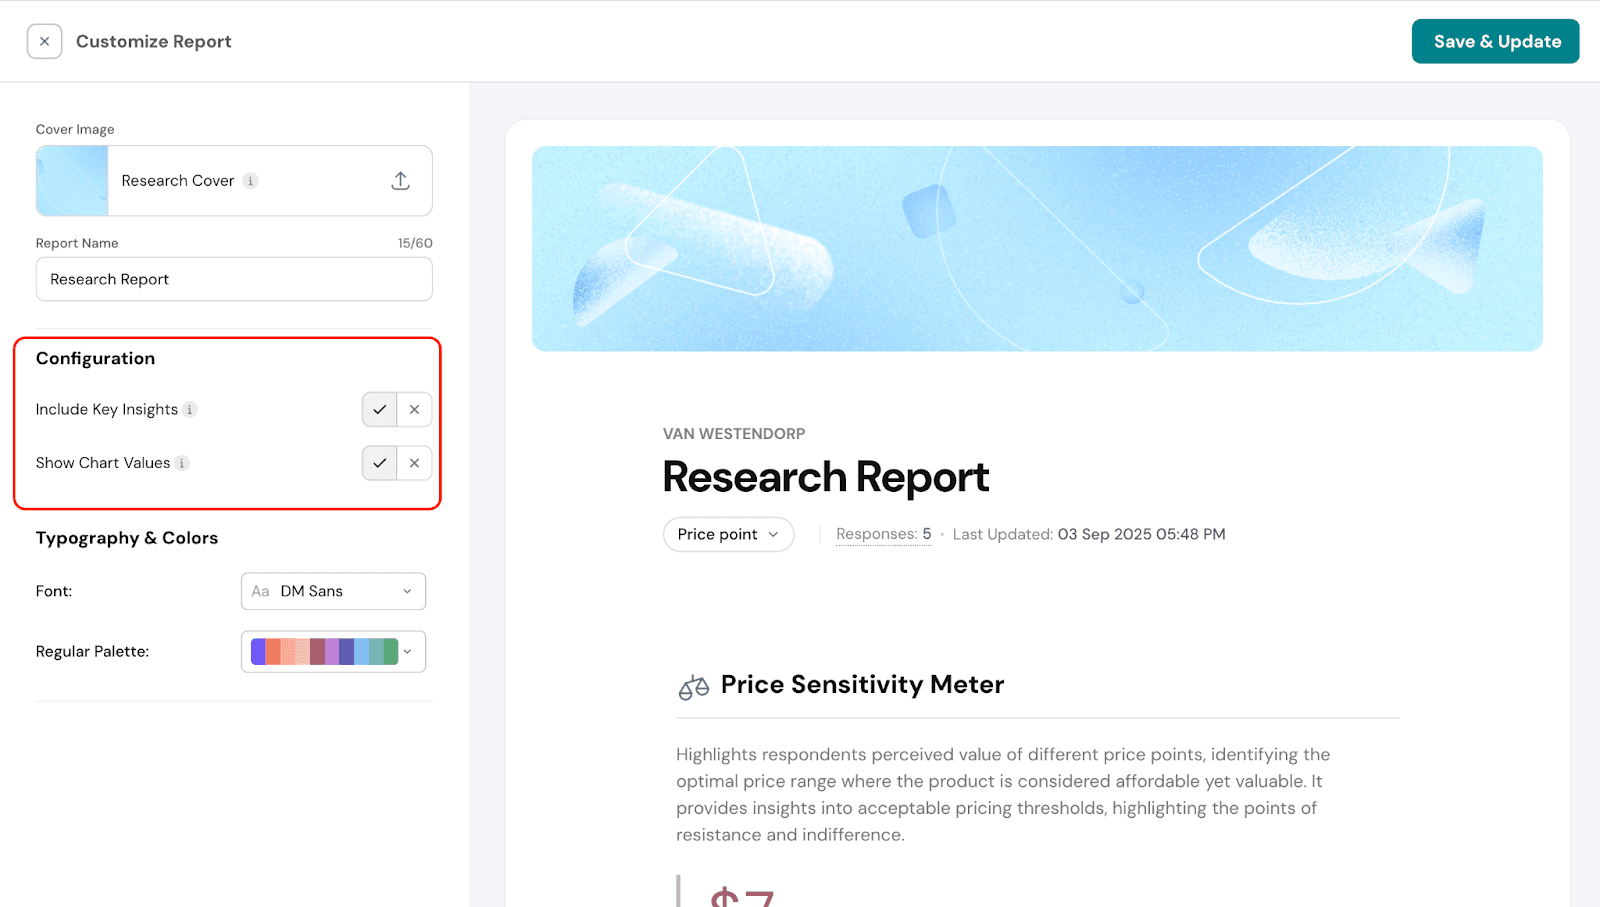
Configure additional options, such as including or excluding key insights and choosing whether to display values on the charts for easier interpretation.
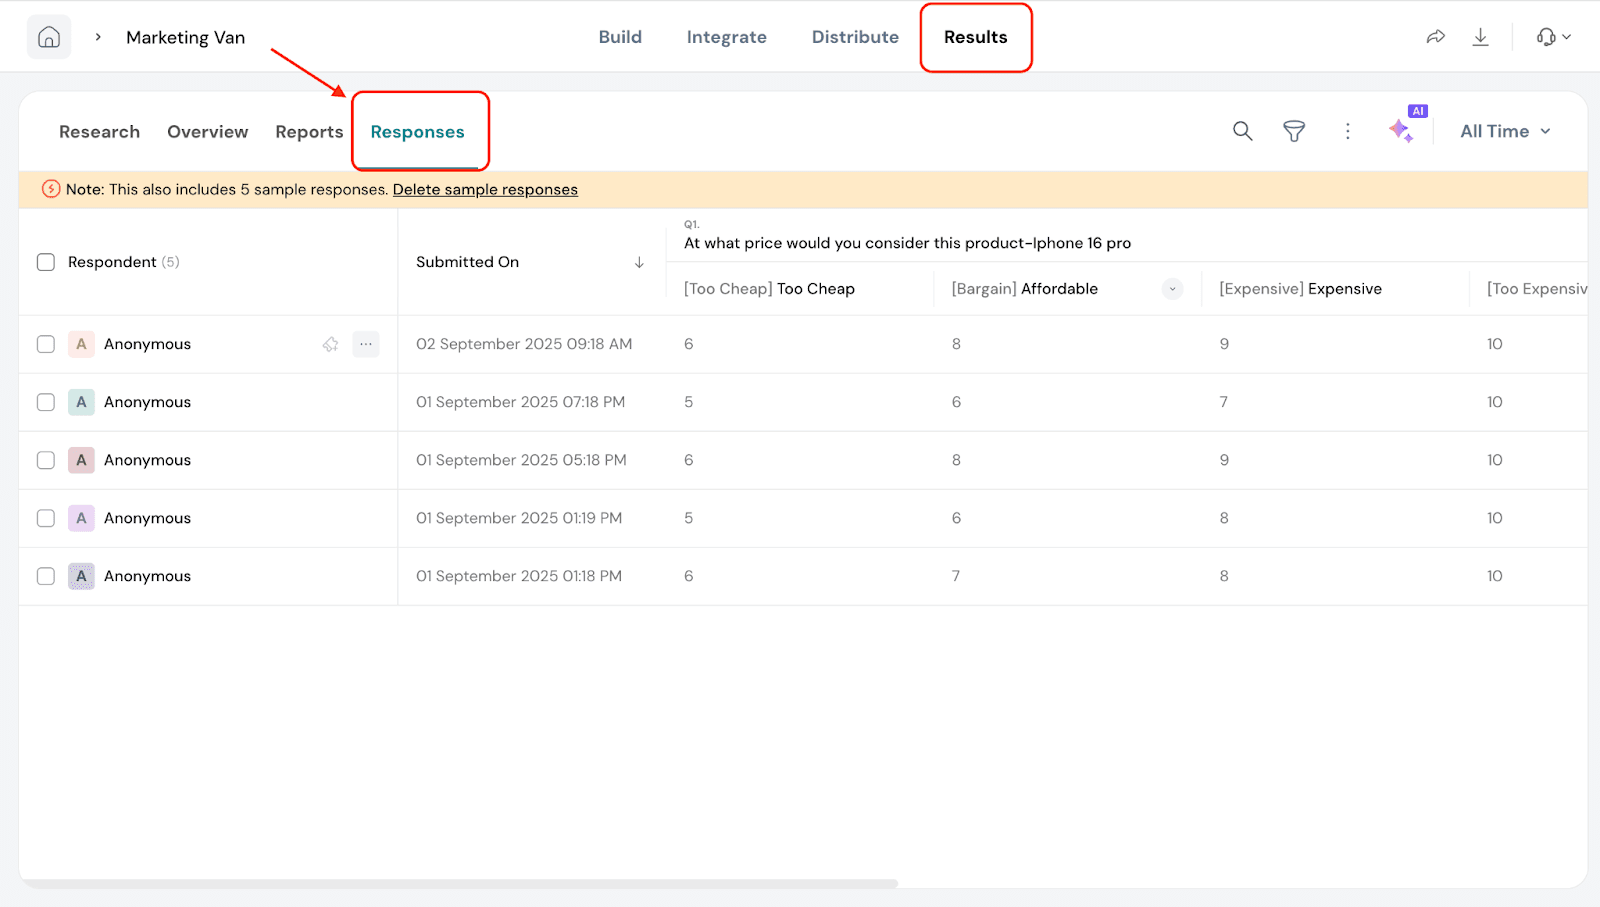
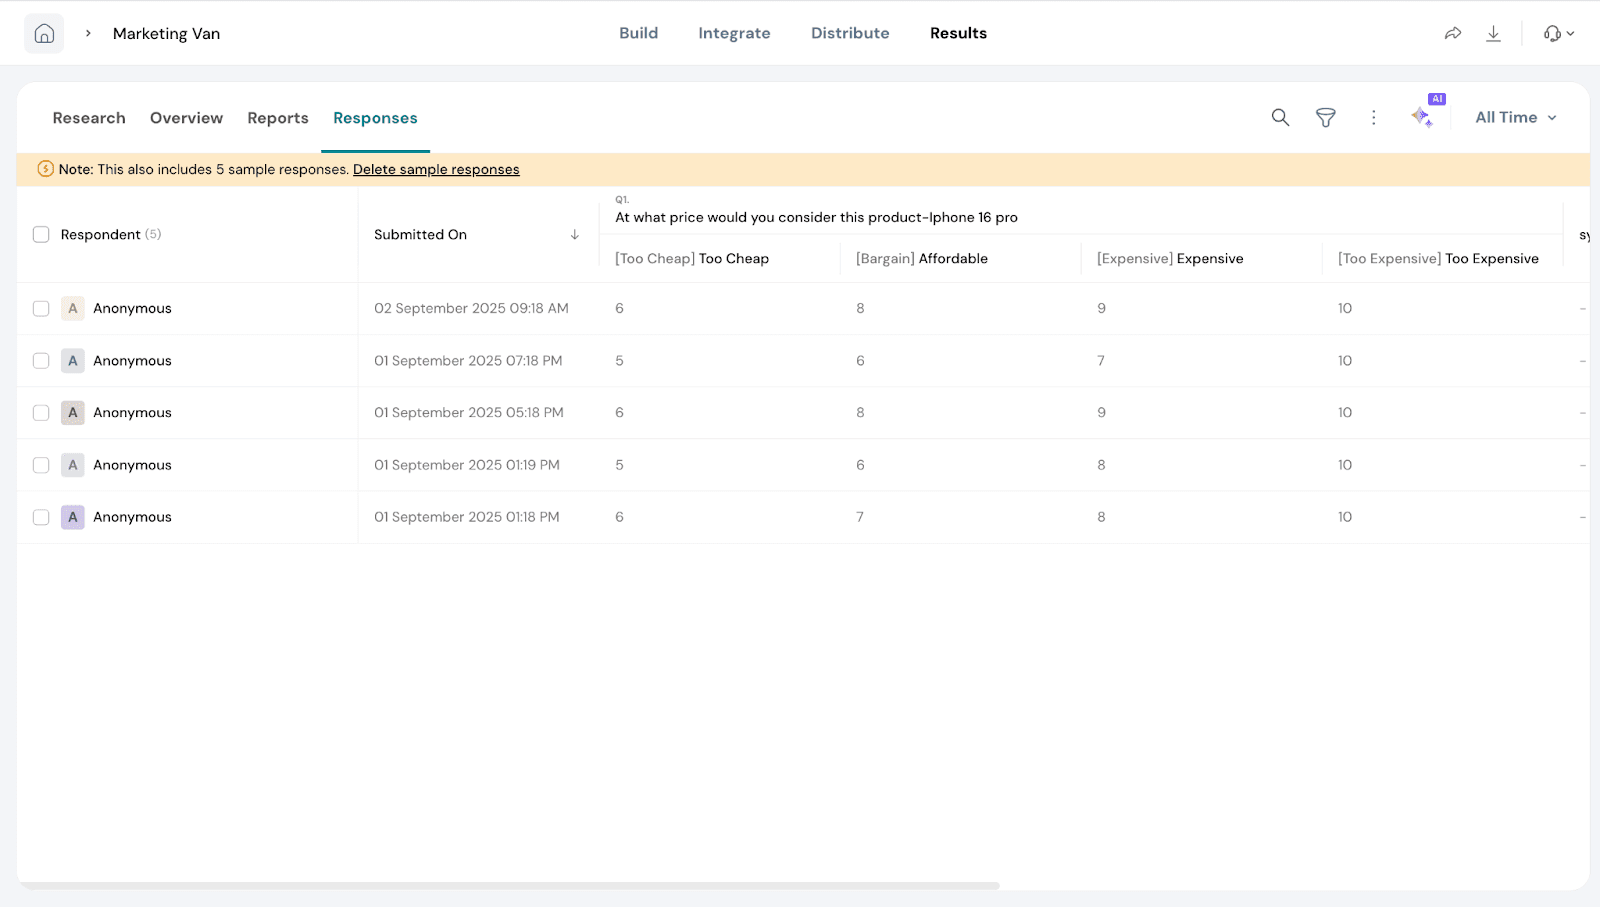
Customize typography and colors, including changing the font style and chart colors. Responses section In this section, you can view how individual respondents answered for each price point. This allows you to see detailed responses and understand preferences at a granular level.
Go to Responses under the Results section.
Under each price point you can see the price entered by the respondent.
That’s all about Van Westendorp.
Feel free to reach out to our community if you have questions.