Comparison Date Range in Analysis
The Comparison Date Range helps you understand how your data has changed over time by comparing a selected date range against another period. This makes it easier to track trends, measure progress, and evaluate the impact of actions taken.
This feature is available in:
- Executive Dashboard
- CogniVue
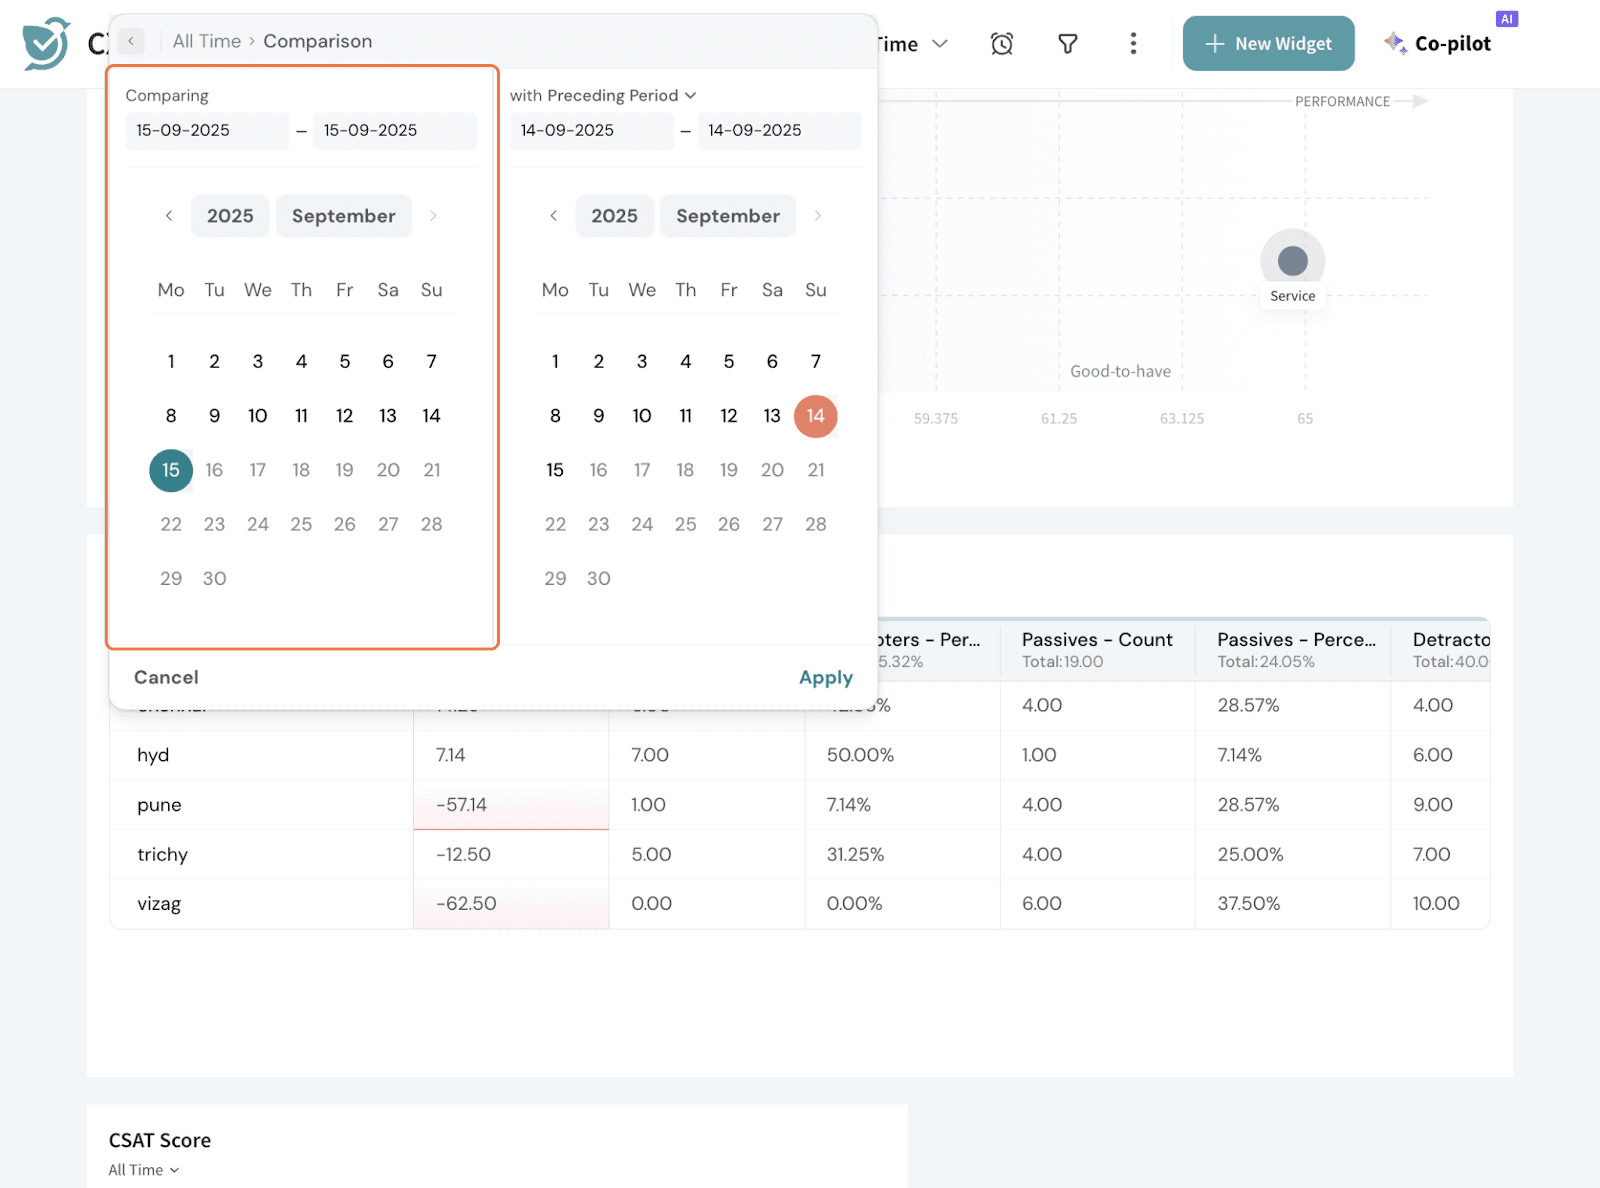
Once a comparison is applied, you will see the percentage change (%) between the selected period and the comparison period wherever comparison is supported. It can be fixed ranges or custom date ranges as well.
You have the following options:
- Preceding period: This option compares the selected date range with the immediately previous time period (e.g., comparing the last week with the week before it). Use this when you want a straightforward period-over-period comparison.
- Preceding period (match day of the week): This option compares the selected date range to the same period in the preceding time frame, but it matches specific days of the week.
For example, if the selected period is from Monday to Sunday, it will compare Monday to Sunday in the previous week, rather than the previous full week. This is useful when day-of-week patterns matter, such as weekends vs weekdays.
- Same period last year: This compares the selected date range with the exact same range from the previous year. For example, comparing February 5th to 12th, 2025, with the same dates in 2024.
Use this to measure year-over-year performance without adjusting for weekdays.
- Same period last year (match day of the week): Similar to the previous option, but here, it matches specific days of the week for the same period last year. For instance, comparing February 5th, 2025 (Wednesday), with February 5th, 2024 (Wednesday). This option is ideal when weekday alignment is important for seasonal or operational analysis.
- Custom: This allows you to manually select a custom comparison date range, giving you full flexibility to choose any period you wish to compare.
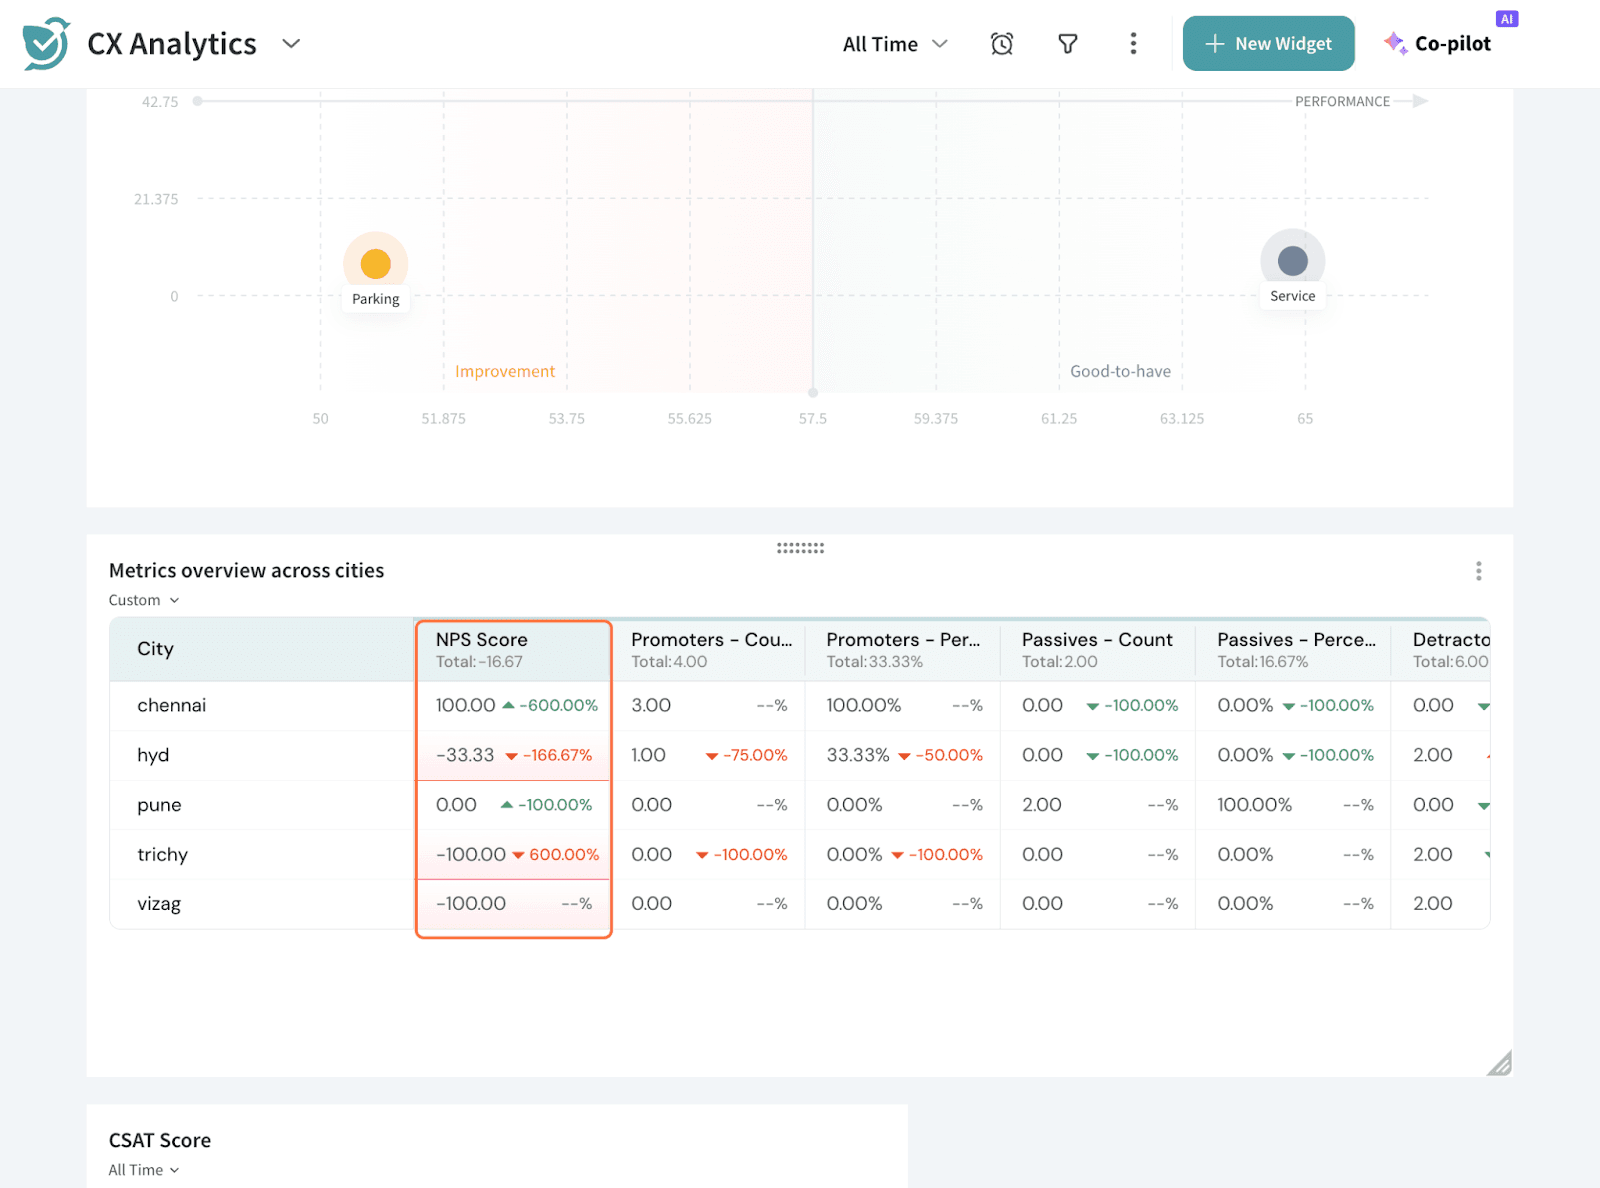
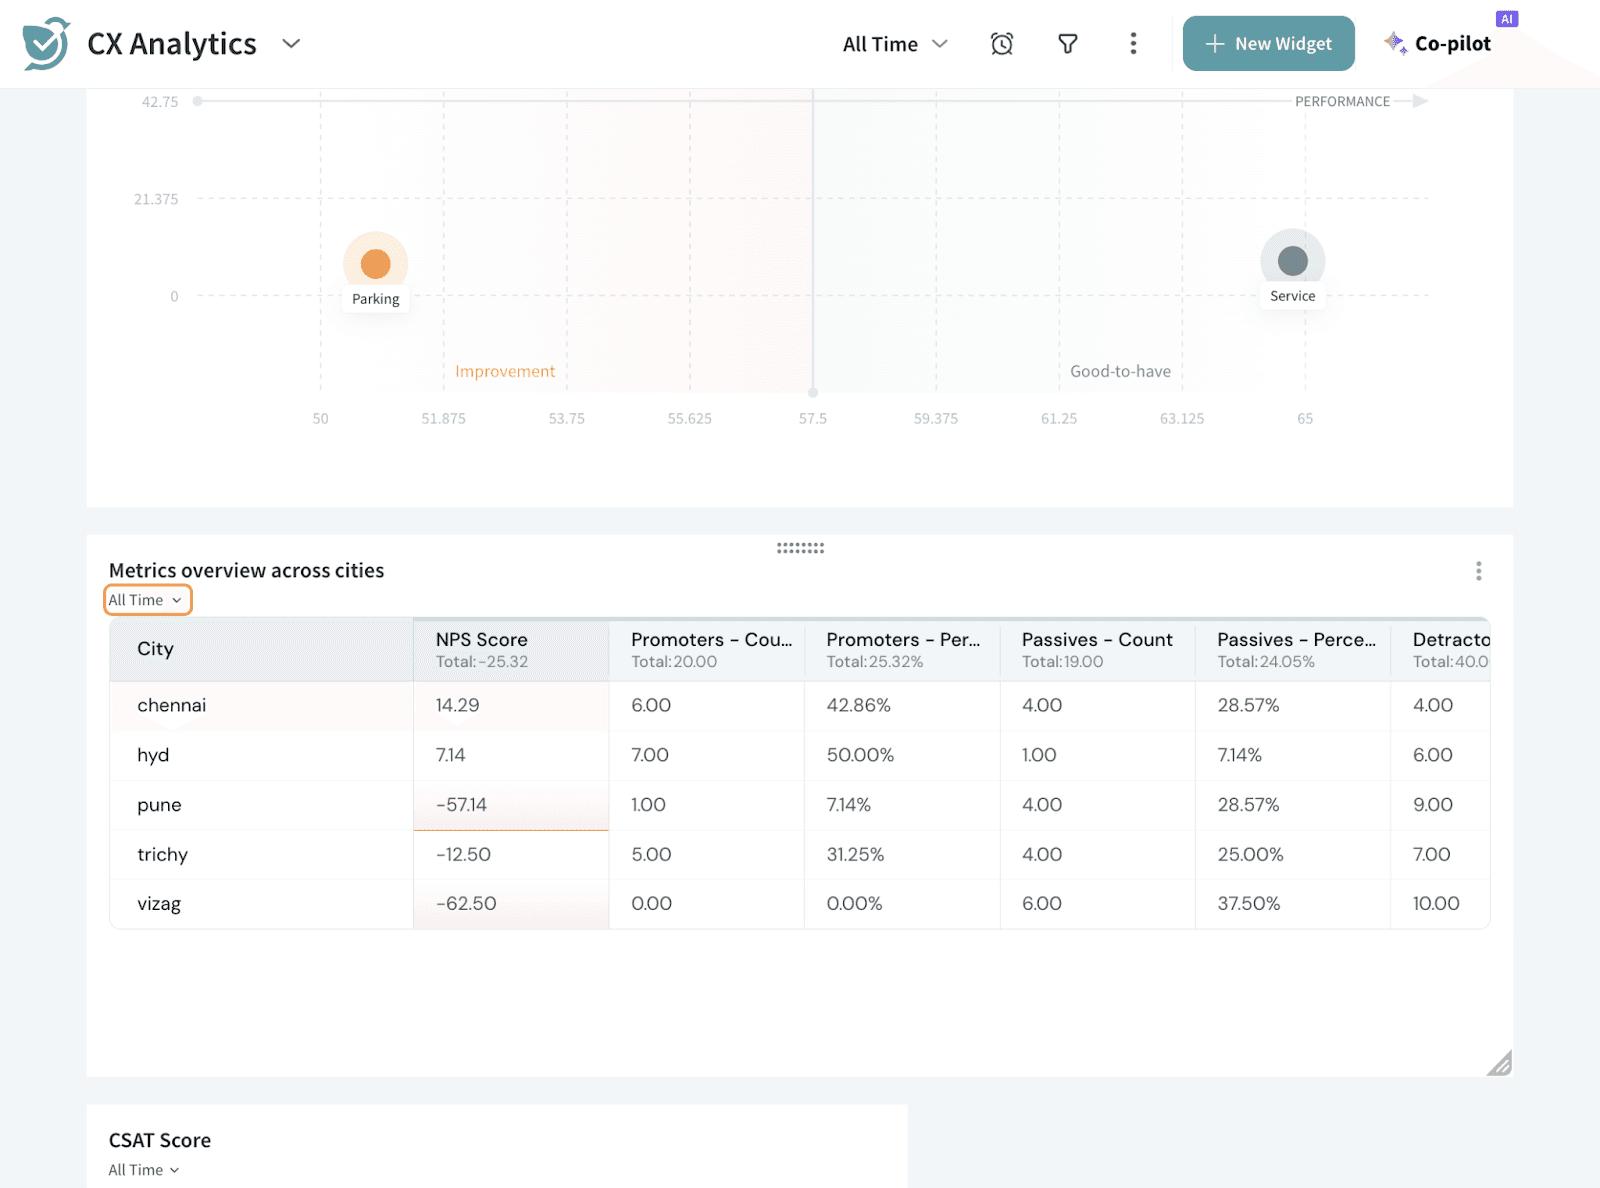
Let’s take a look at a Data Table widget in the Executive Dashboard as an example to see this live.
Click on the date range and set it up.
It can be fixed ranges or custom date ranges as well.
Once you apply, you will see the % change in every cell.