Search
A radar chart is ideal for plotting three or more variables of an entity, with each variable arranged radially around the central point. The magnitude of the variables is marked along the radiating lines and are connected to form a polygon. This allows businesses to visualize and compare the performance of various metrics, at a glance.
Now, let’s see how to create a radar chart.
1. Navigate to the Insights section and click Dashboards.
2. Click New Widget.
3. Select By Chart Type.
4. Choose the Radar Chart.
5. Select the survey (Source) you want to create the widget for.
6. Click on the “+” icon to add multiple sources.
Note: You can add a maximum of 8 surveys for a single Radar chart.
7. Choose a dimension for your chart.
Note: You can choose from contact properties, variables, and questions.
Supported questions for dimensions:
8. Select the required sub-dimensions.
9. Choose the properties to be visualized on each corner of the chart.
Note: A minimum of 3 and a maximum of 8 properties can be added at a time.
10. Click on the “+” icon to add more than 3 properties to your chart.
Note: Currently, we support the following questions for properties.
11. Choose any one of the operations from the dropdown.
Note: The operation will be the same for all the chosen properties.
12. You can choose to add filters for specific data analysis.
13. Also, you can filter out data by a date range.
1. Click Advanced to make your widget visually appealing.
2. You can select the theme and rename your legends (sub-dimension).
3. Type out the property labels to be displayed on each corner.
4. You can customize the colours of a radar chart based on defined value ranges using the Scale Customization by assigning different colours to specific ranges (e.g., low, medium, and high values).
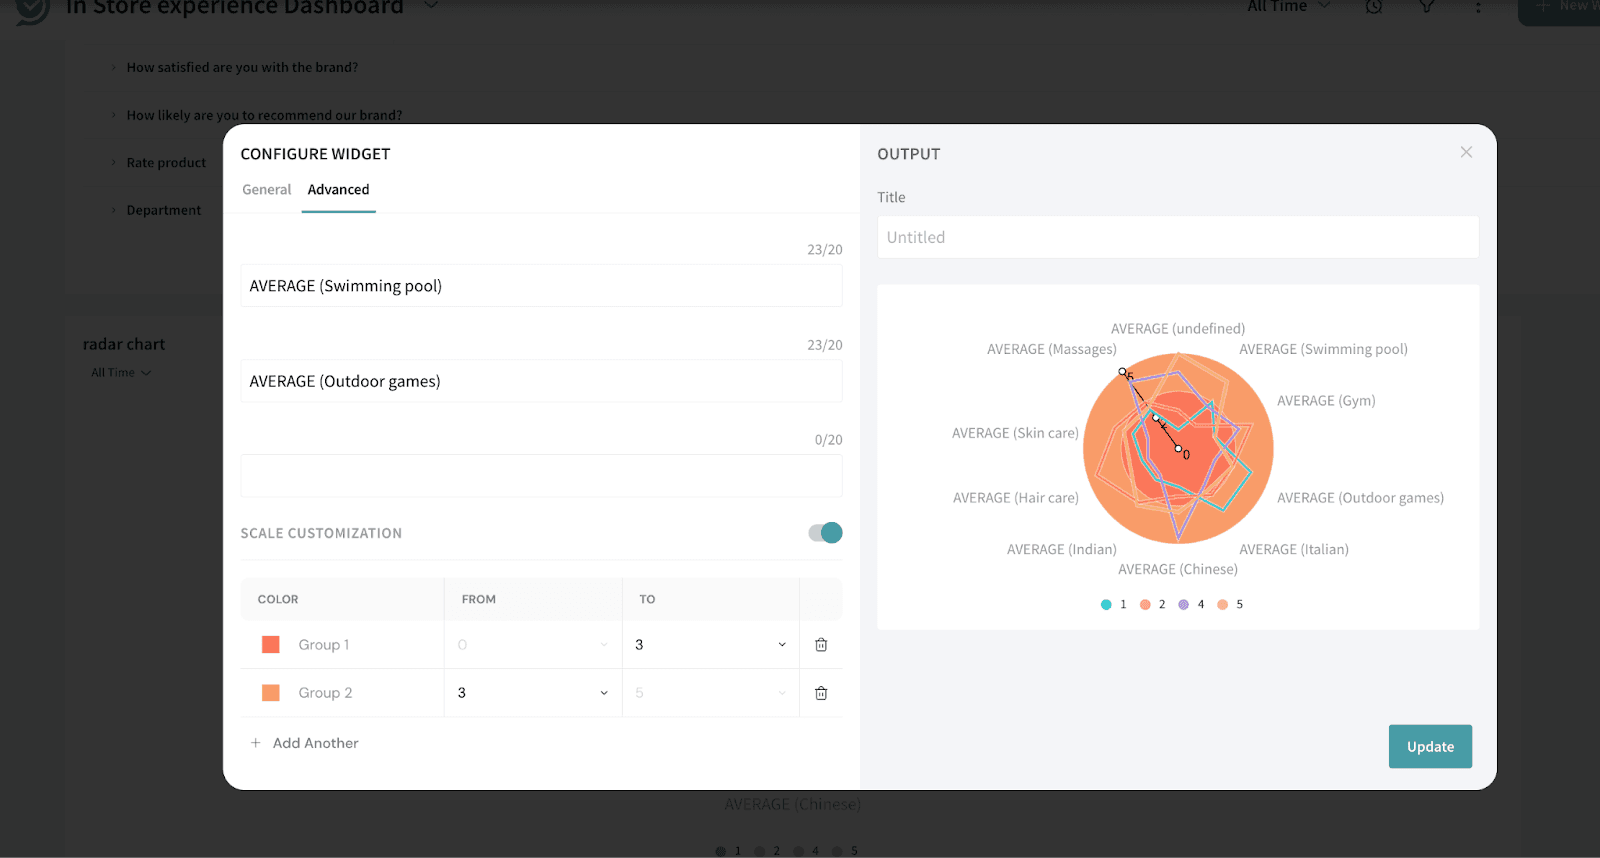
Note: Ranges can overlap, meaning a value may fall into multiple ranges, ensuring smoother transitions between colours and enhancing the chart's visual clarity.
5. Enter the widget title for your reference.
6. Preview once and click Add widget.
The Radar chart will be displayed on your dashboard. Resize and move the widget to your liking.
Note
Feel free to reach out to our community if you have any questions.
Powered By SparrowDesk


