
Search
Heatmap question type lets you graphically represent the area that fetches the maximum number of clicks on any image file. You can gather feedback from your respondents, decode their behaviour, and uncover clicking patterns - all with one question type.
With all the respondent feedback you receive, you can optimize the image for better conversions and draw insights out of your image file.
Let’s see how to use the Heat Map Question Type
1. Select the Heatmap question type from the list of question types available.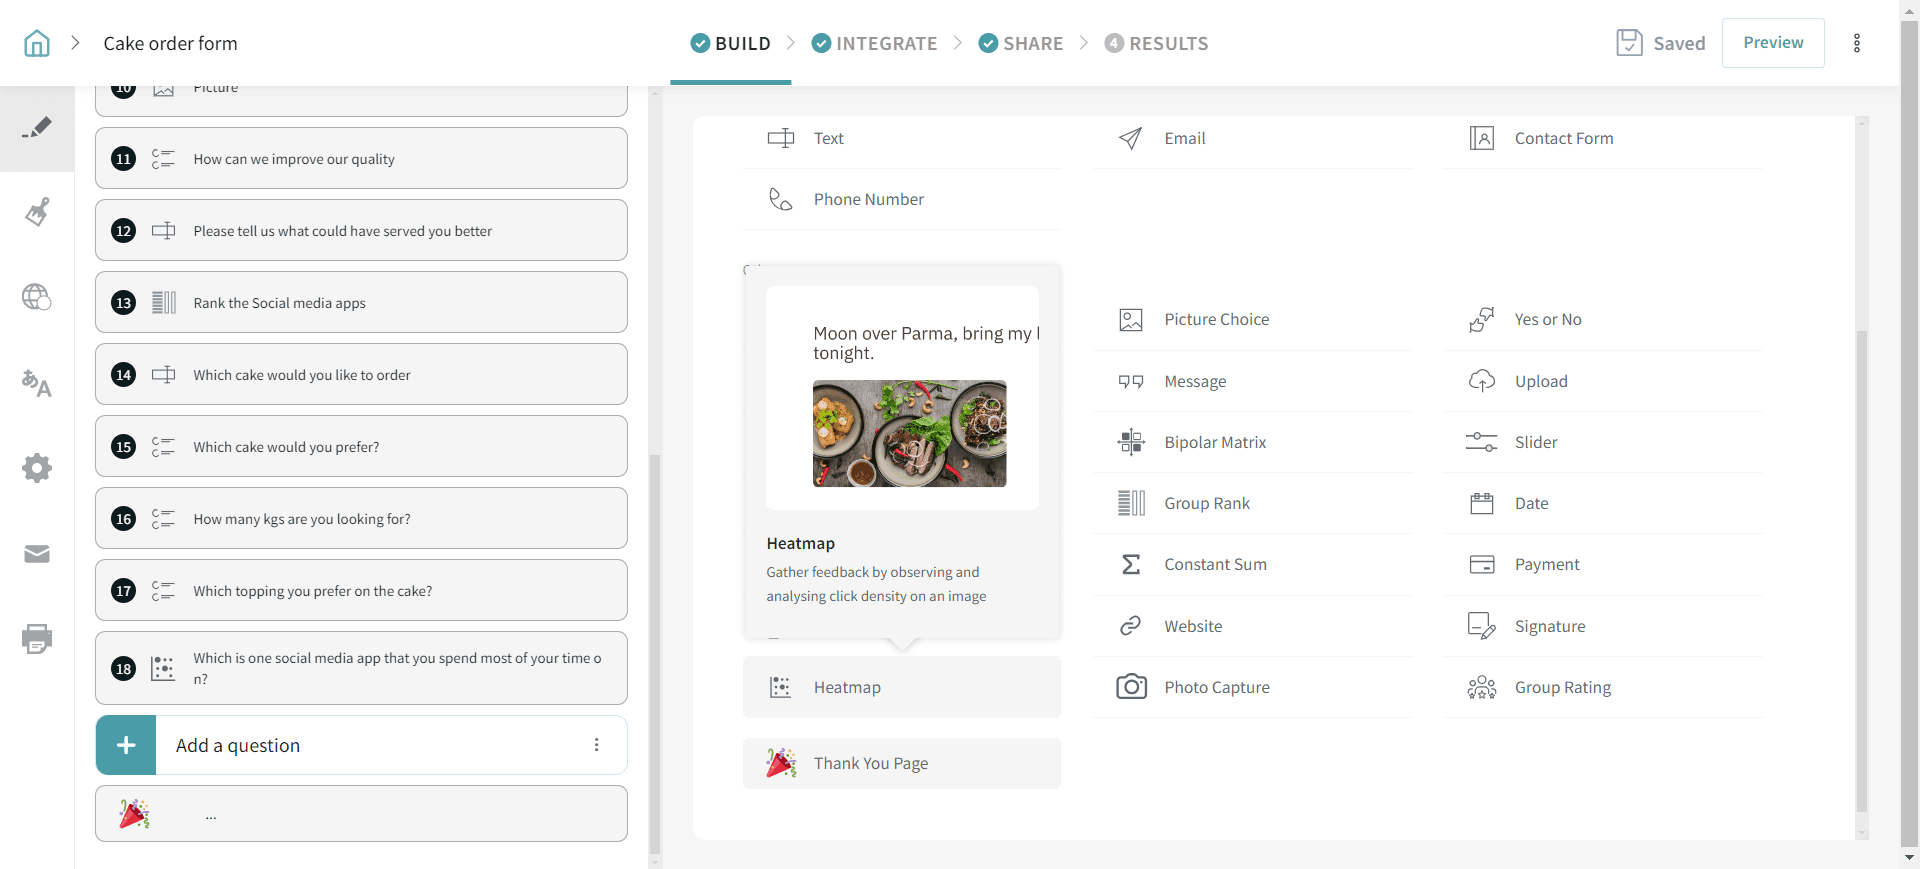
2. Select the image for which you want a heatmap to be analyzed for.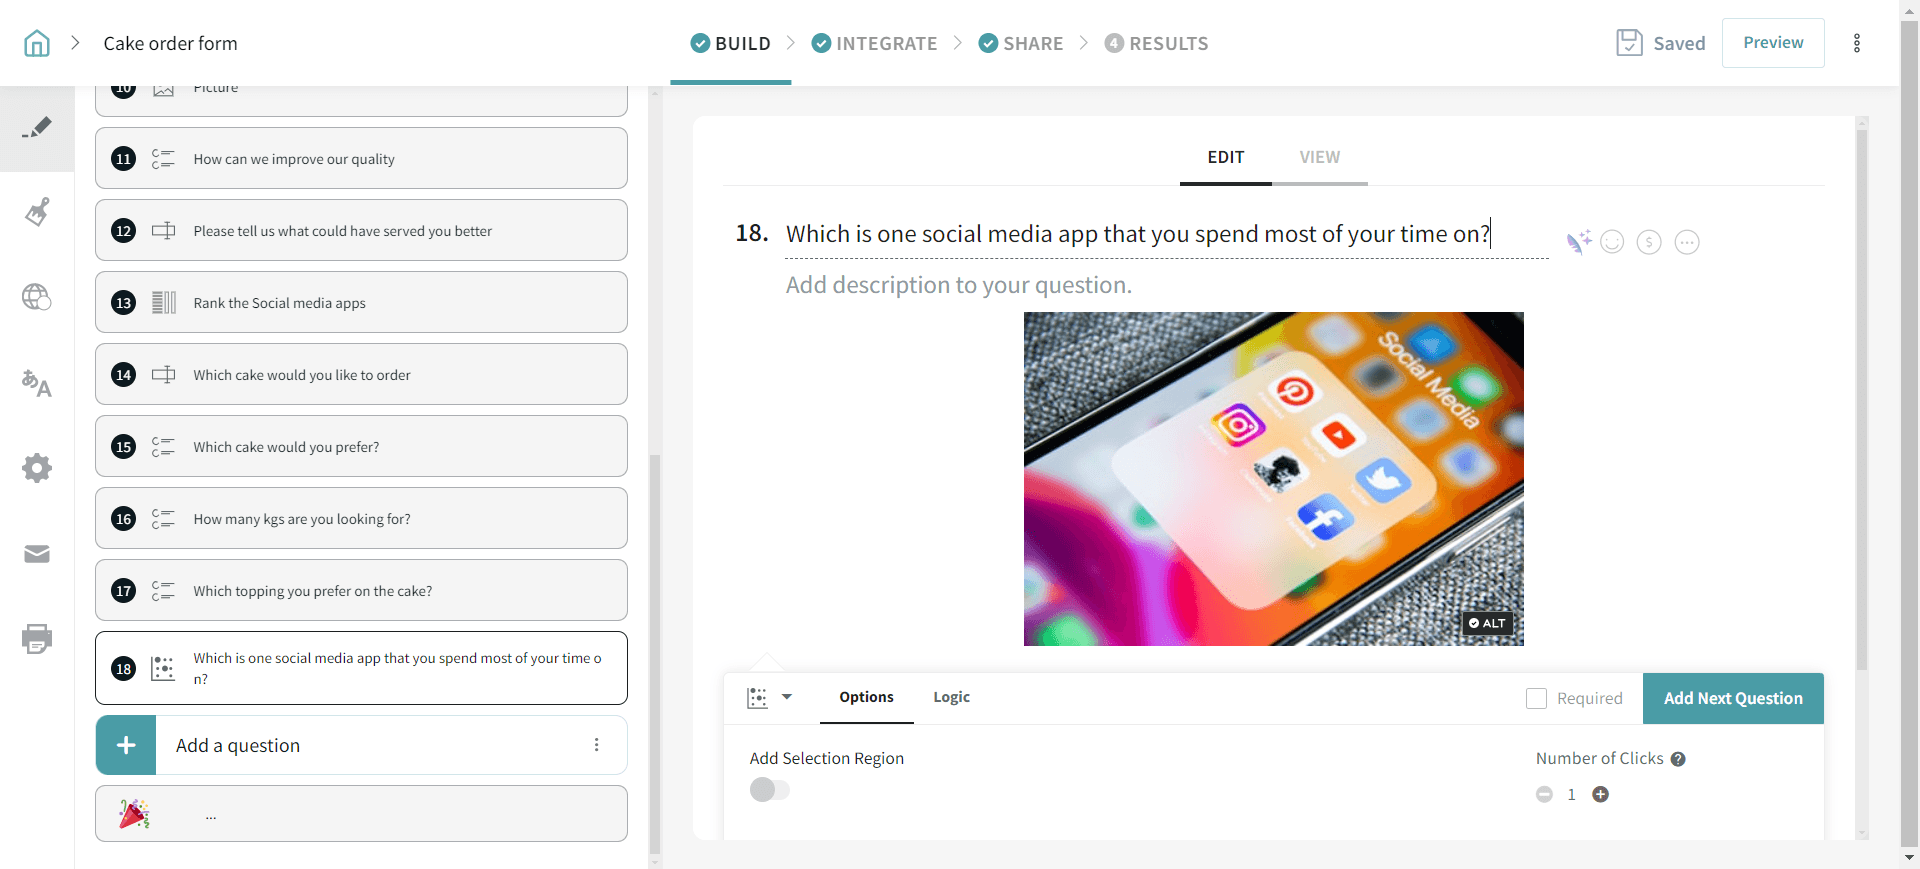
3. Enable the Add Selection Region toggle to add new regions. 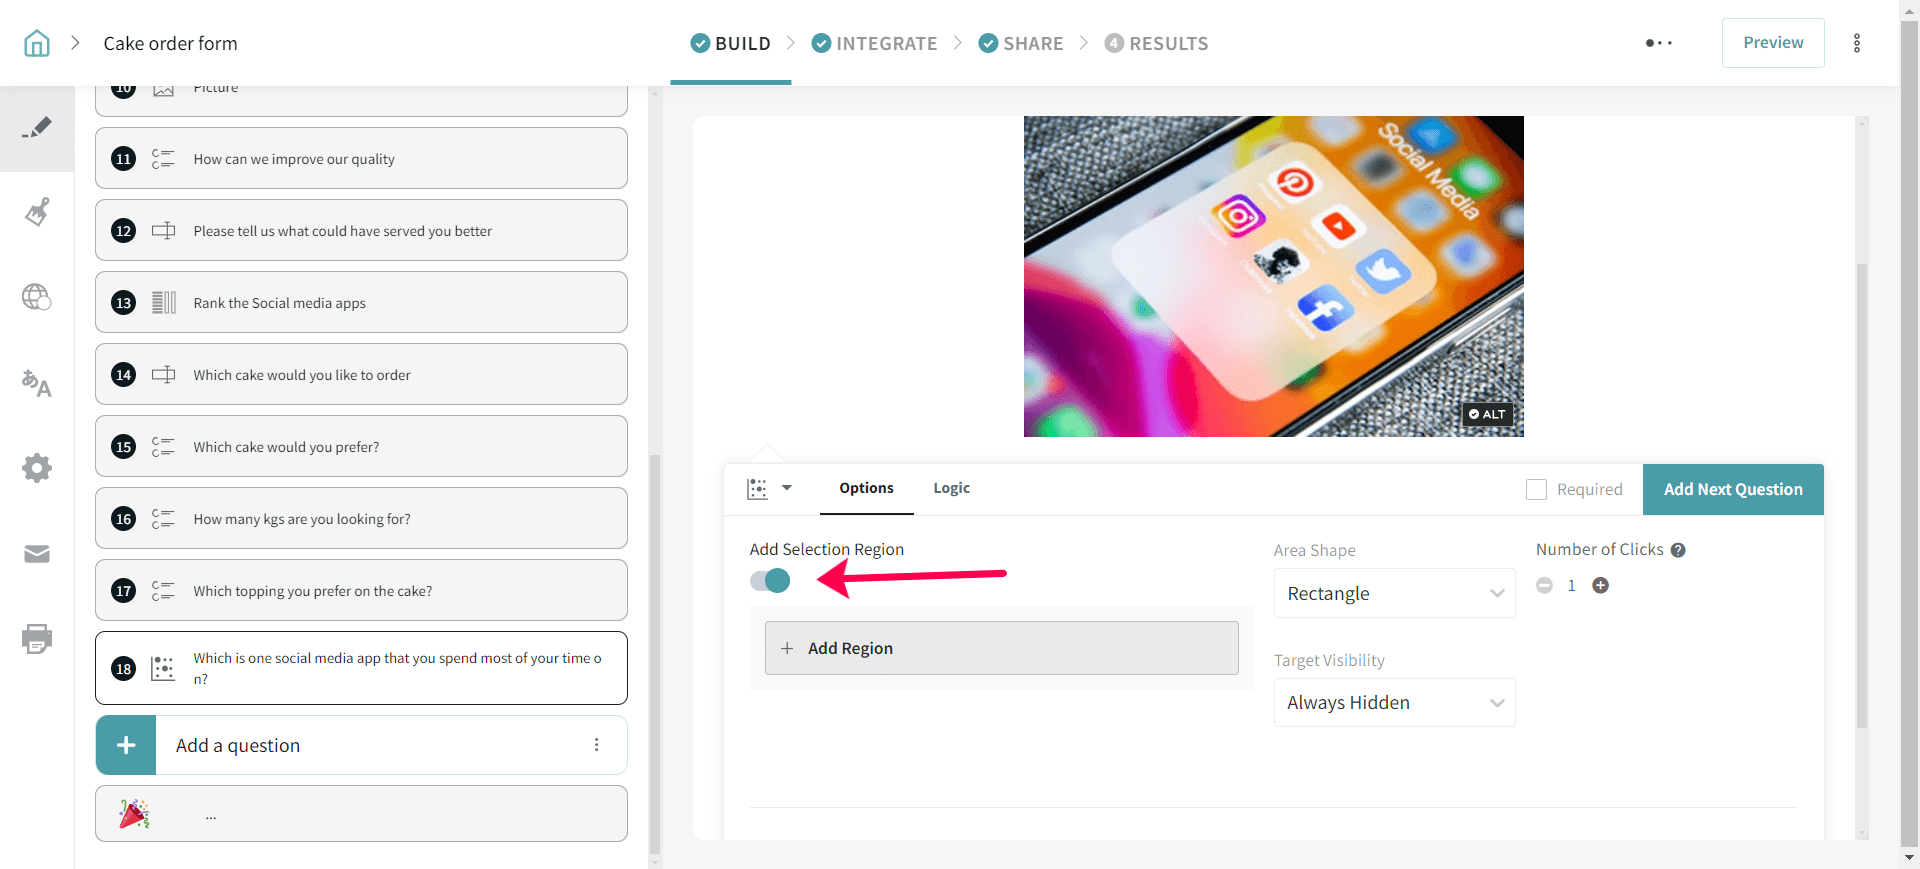
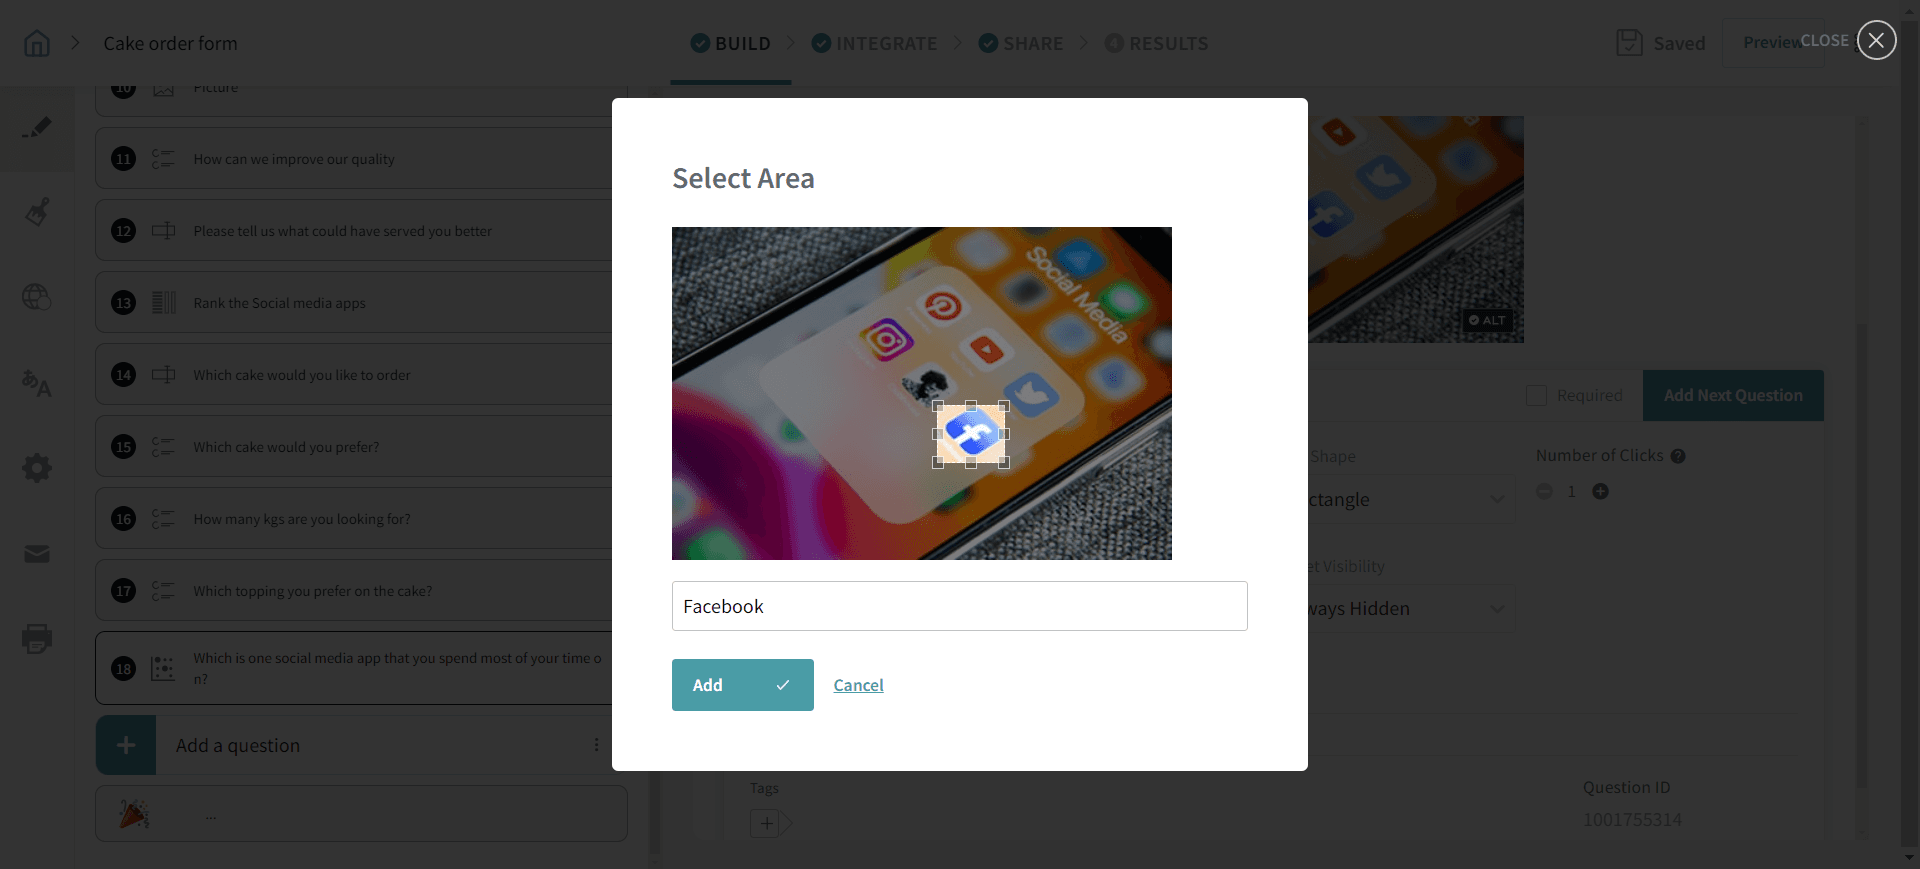
4. Select the area - The portion of the image you want the Heatmap analysis to be done and name the region. Once done, click Add to add the region.
5. As you can see in the screenshot below, we are trying to analyze which Application people use the most. The user is allowed to do only one click. So based on the number of clicks on the selected portion, we can analyze things better.
6. Once done, share the survey with your audience and collect responses. We’ve collected some responses from our end.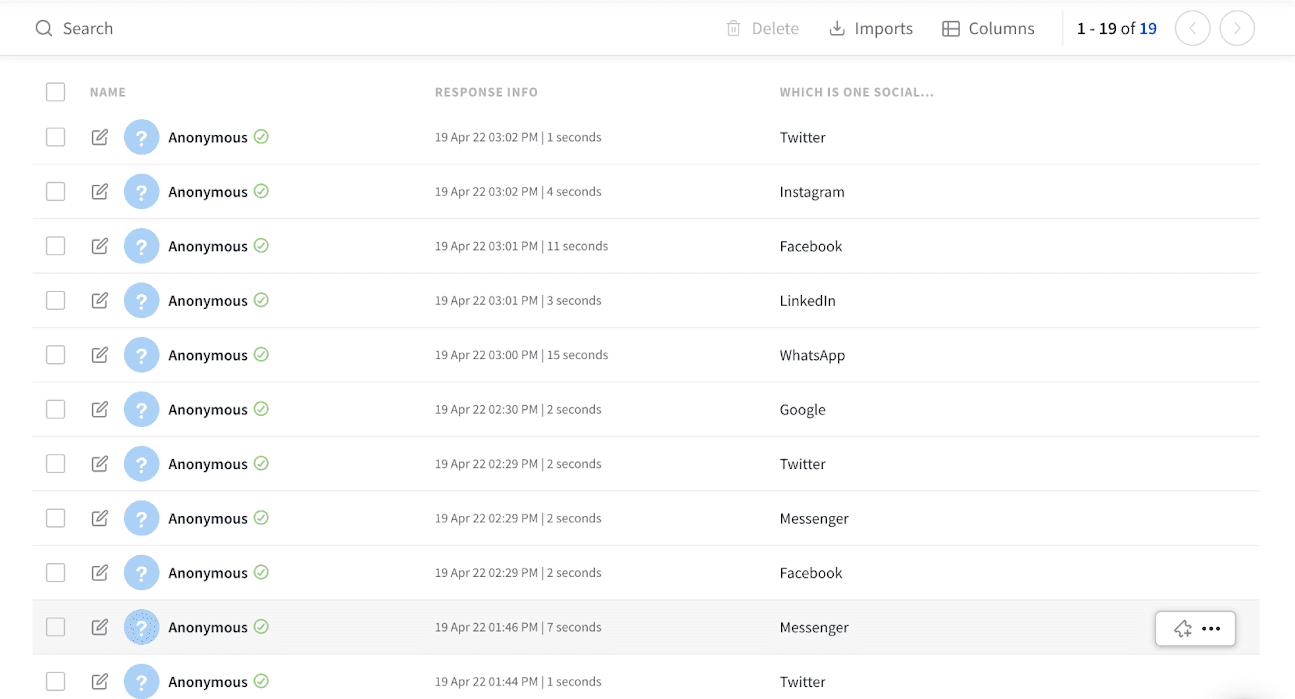
7. Navigate to Results -> Reports to see the Heatmap.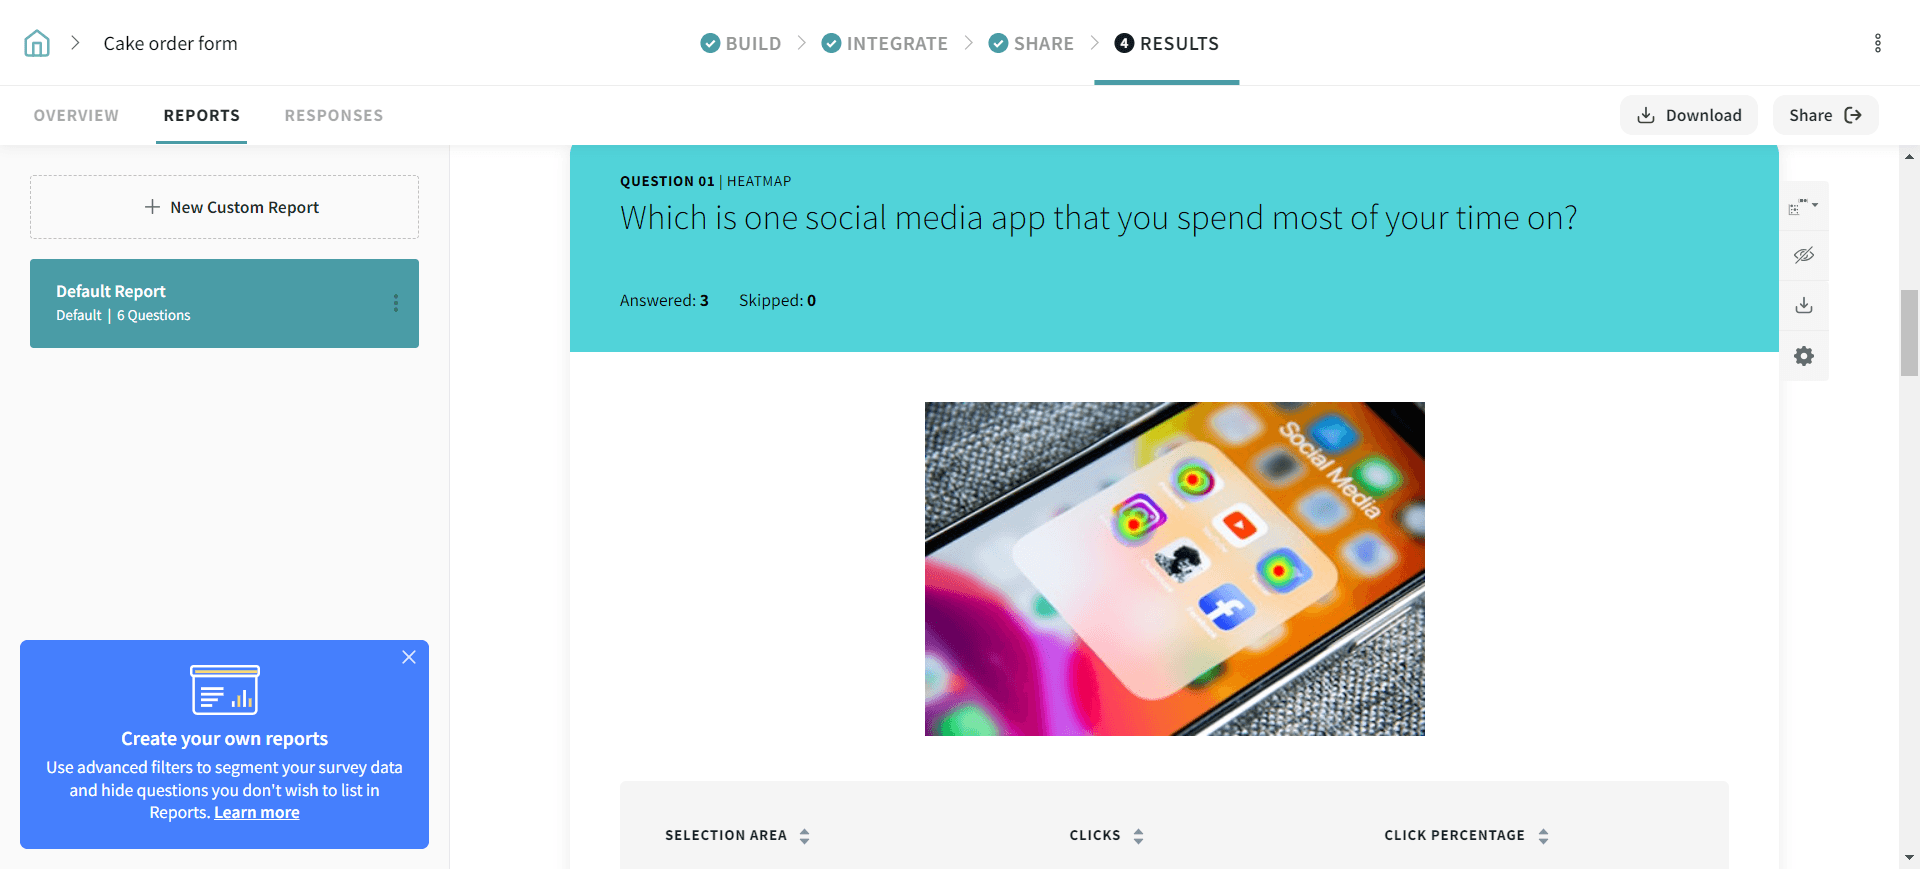
Based on the visual Heatmap, we can conclude that the apps like “Facebook, Twitter, WhatsApp, Messenger” has fetched the most number of clicks and the audience which we have surveyed use these apps over the rest.
That's how simple you can use the Heatmap Question Type.
With the Heatmap question type, you can
Please reach out to us if you have any questions. We are just a chat away!
Powered By SparrowDesk