
Cross Tab Widget
A Crosstab report lets you compare responses from two or more survey questions by displaying one or more questions as columns and one or more questions as rows. This format helps you analyze how different groups of respondents answered across questions, making it easier to identify trends, patterns, and relationships within your survey data.
Let's see how to create a CrossTab widget.
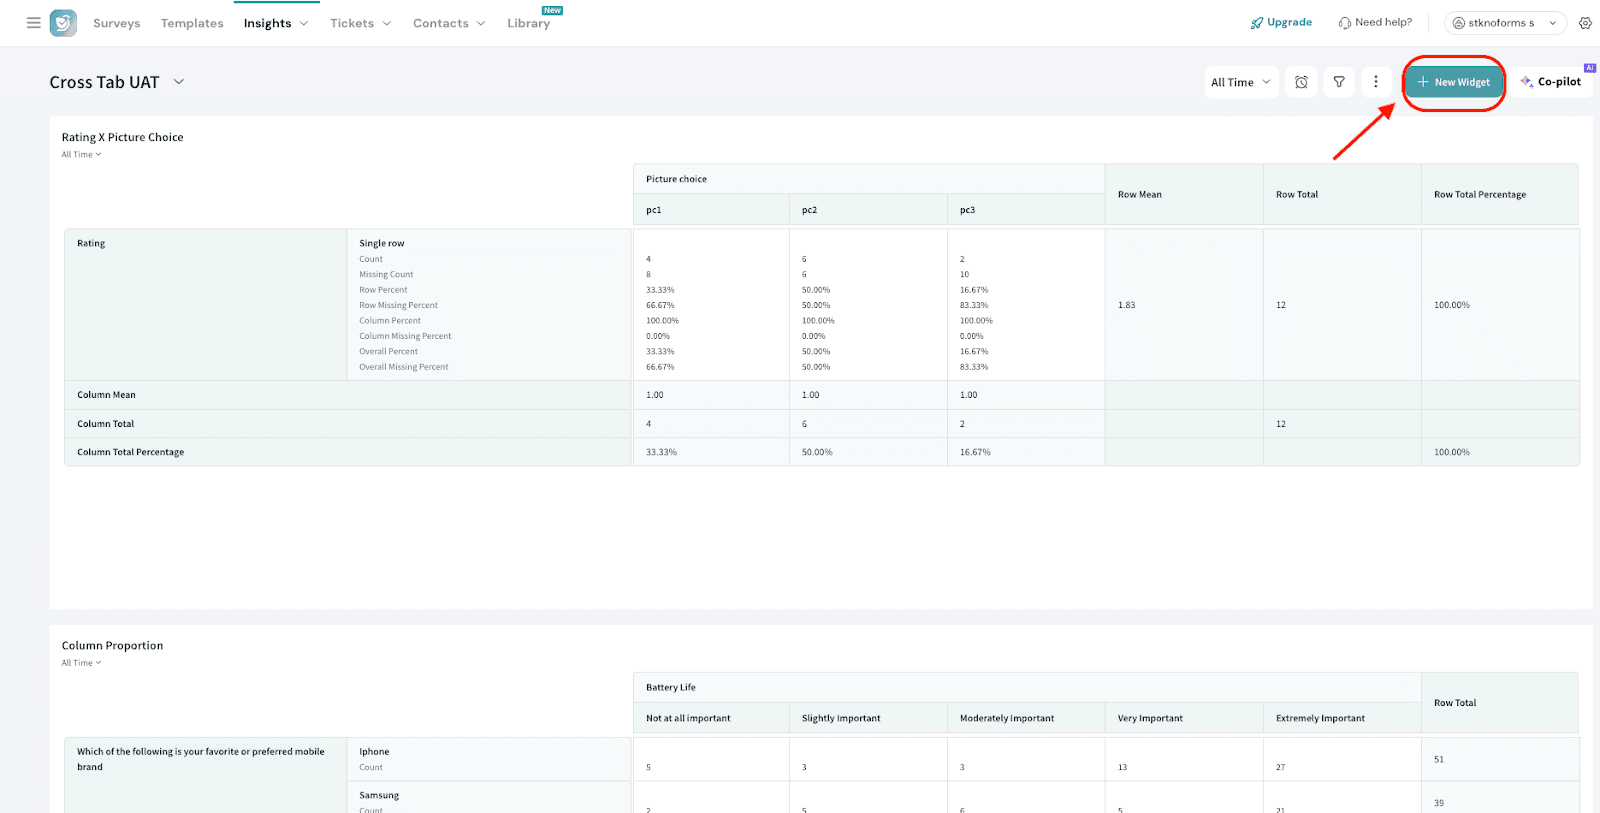
- Navigate to Insights and go to Dashboards.
- Click New Widget.
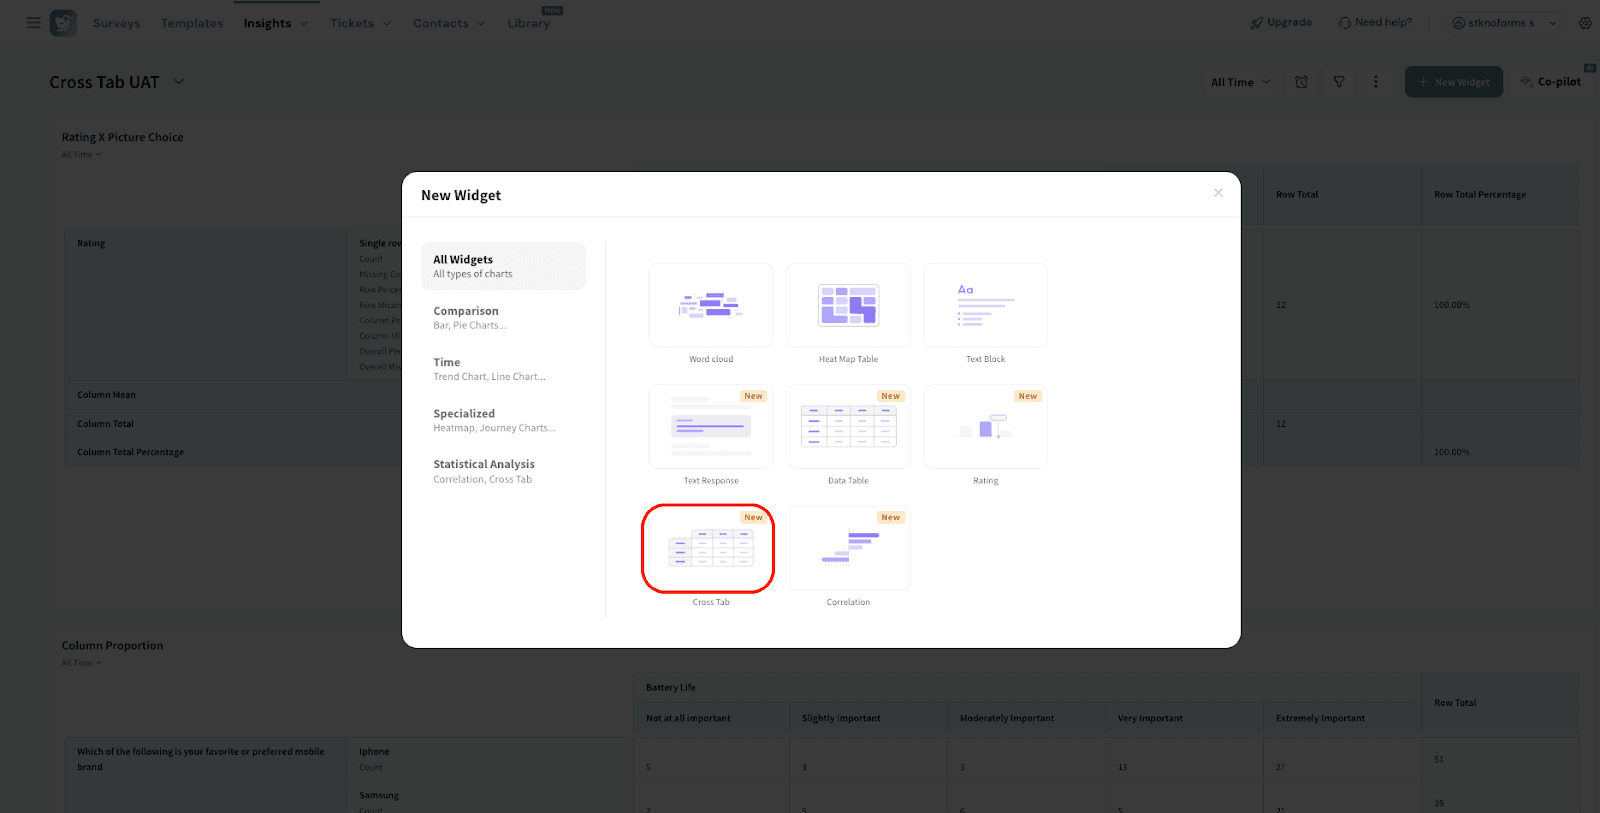
- Choose CrossTab.
- Select the survey (Source) for which you want to create the widget. You can also choose multiple surveys.
Note: The following are the supported question types.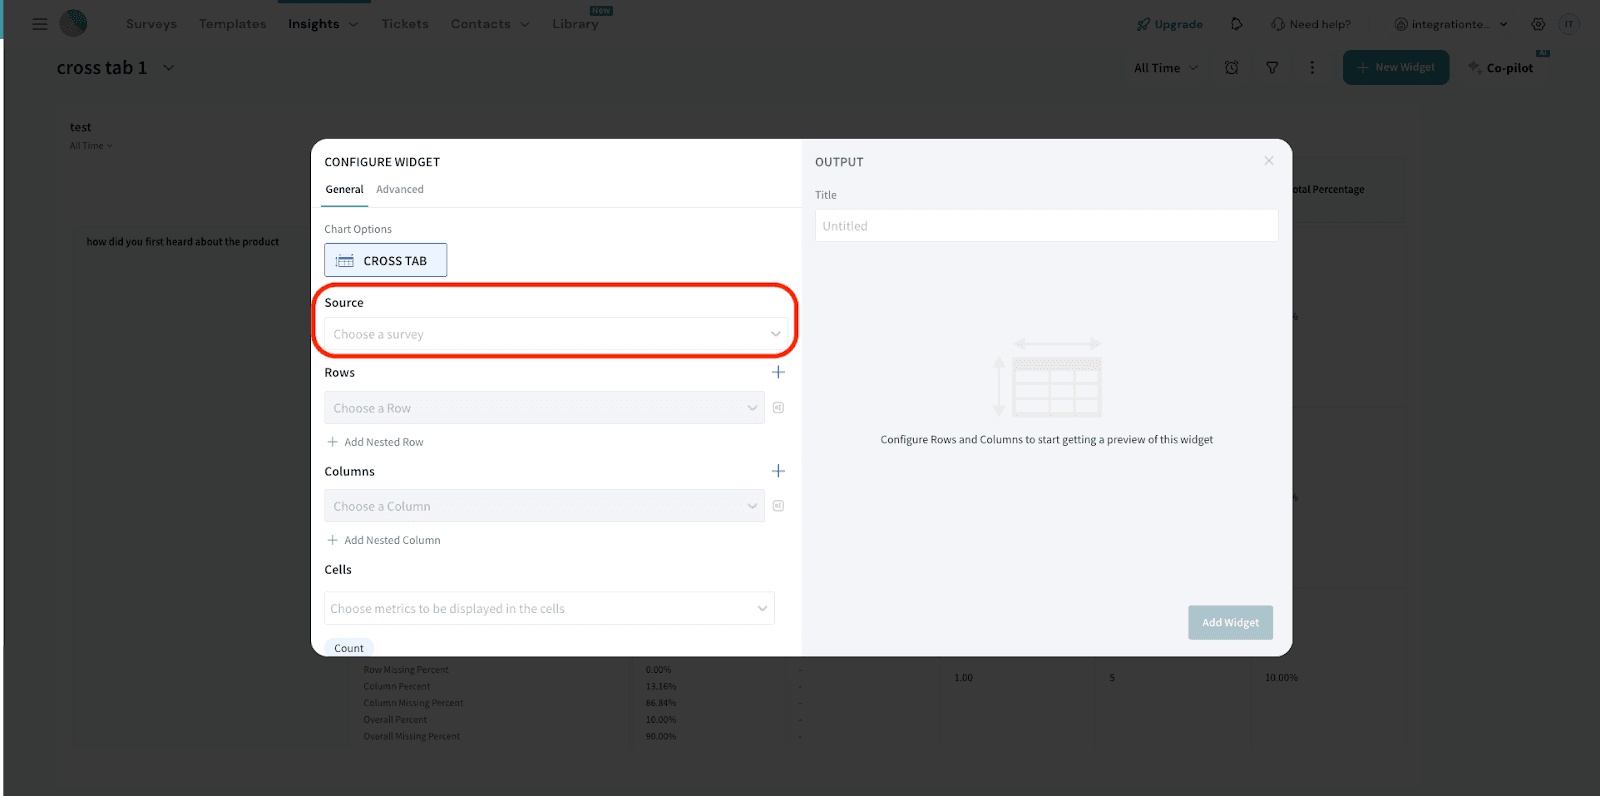
- Drop-down
- MCQ
- Yes/No
- Maxtrix Radio
- Matrix Checkbox
- CX Questions
- Rating
- Opinion scale
- Group Rating
- Picture choice
- Contact properties - Drop-down and single-line text
- Variable - String
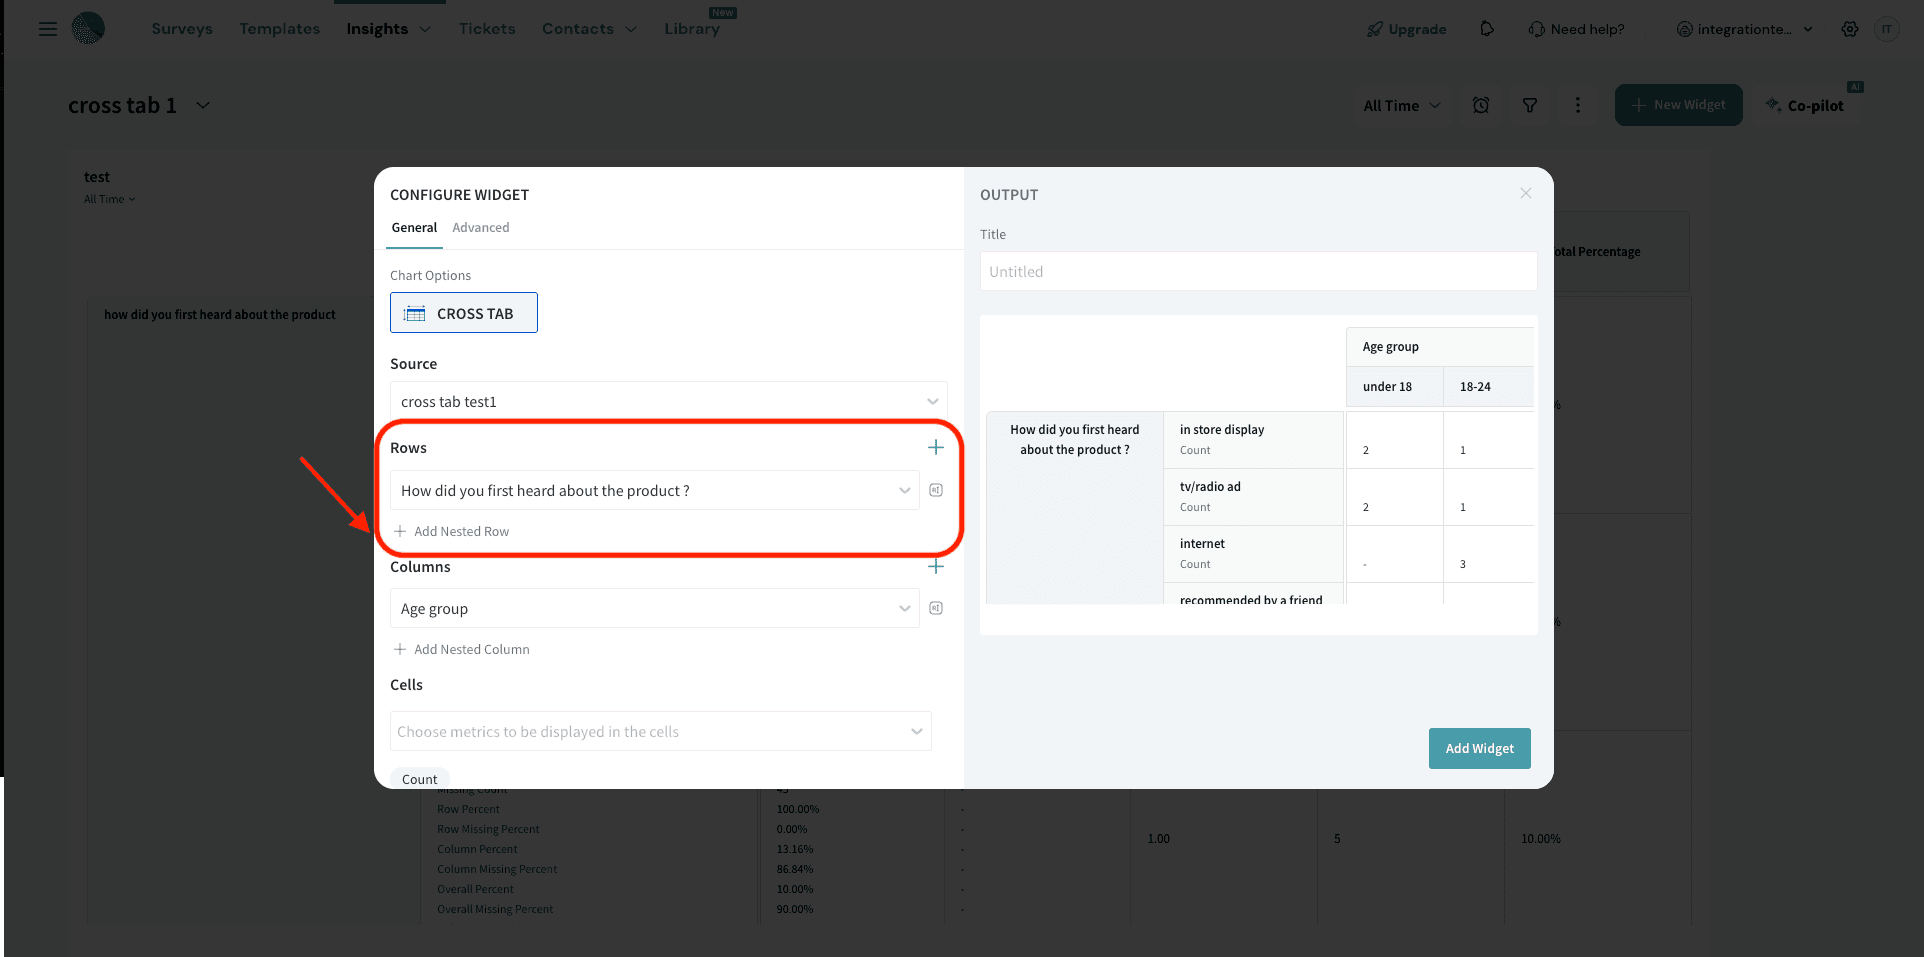
- Add your Rows also known as Stubs.To add more rows, select Add Nested Row to add them. Delete any answer options from the list below that you do not wish to include.
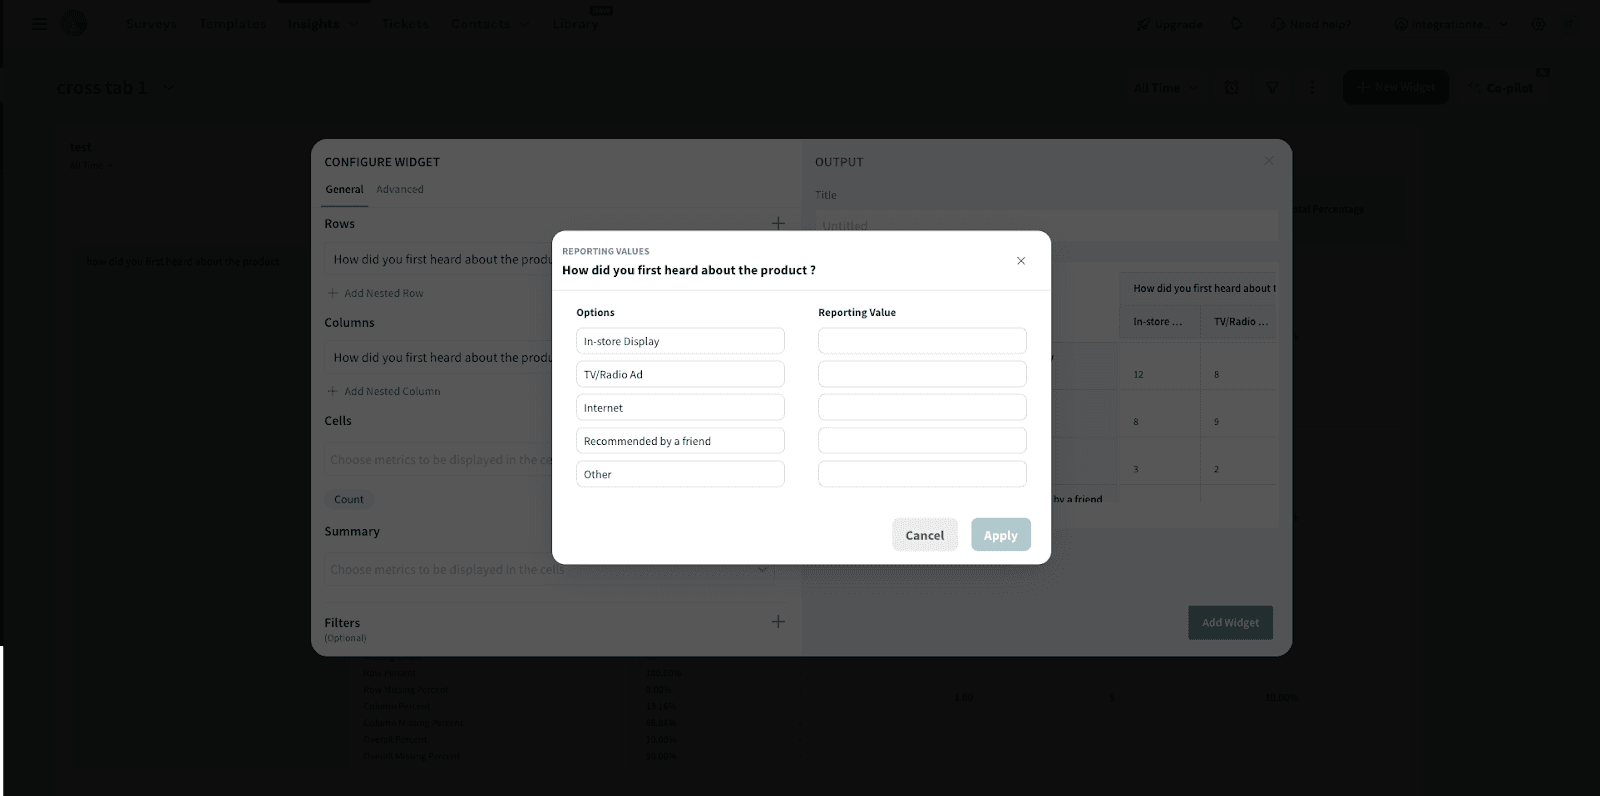
- You can add reporting values to each choice to enable calculations like row and column means, especially for non-numeric questions such as multiple choice or matrix questions.
Note: Reporting values are required for non-numeric question types as they are necessary for calculating row and column means.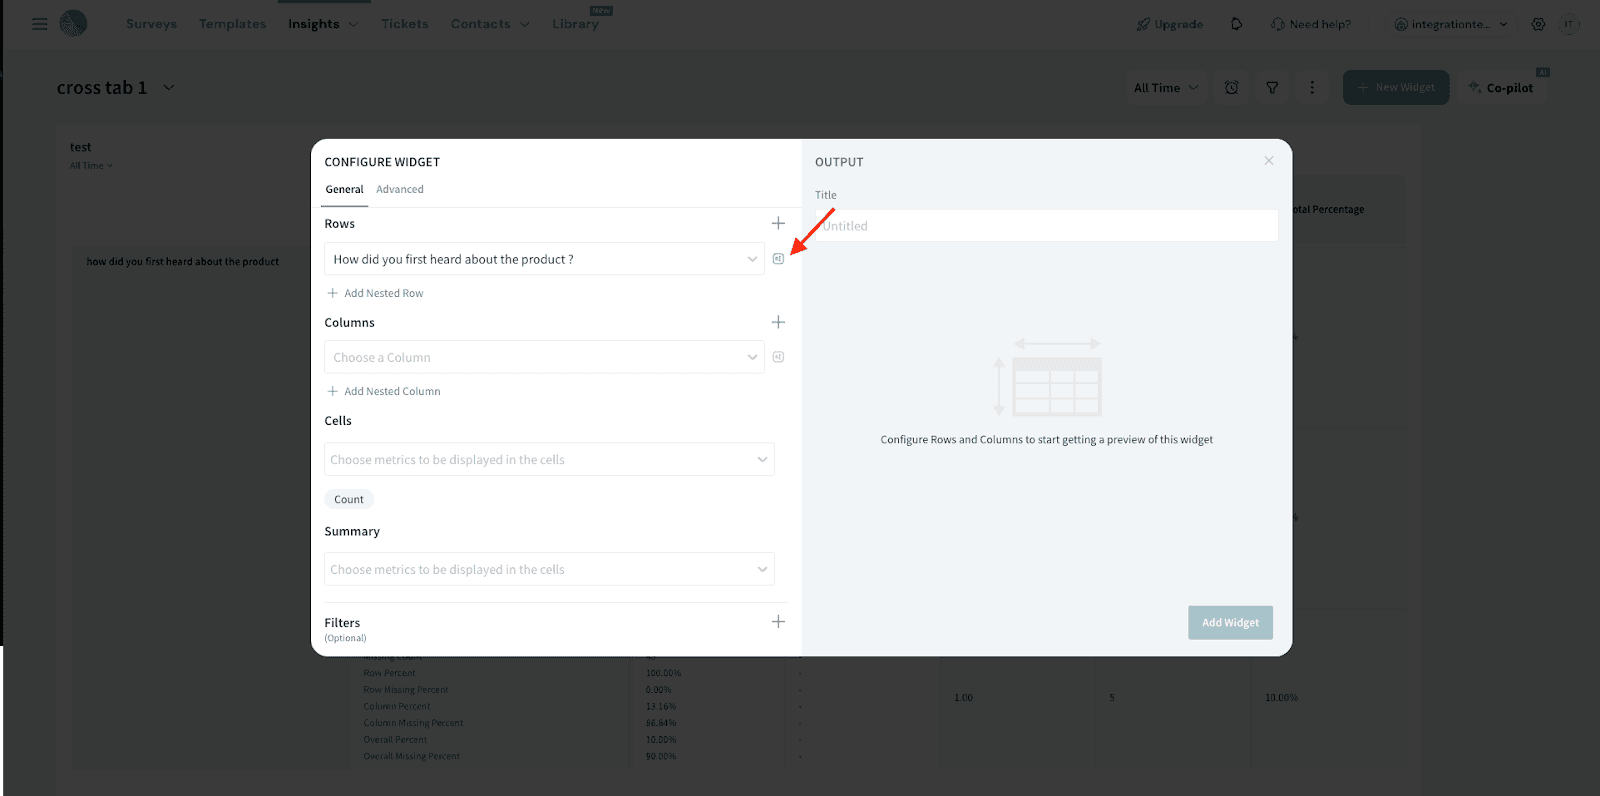
- Next, add your Columns also called Banners.
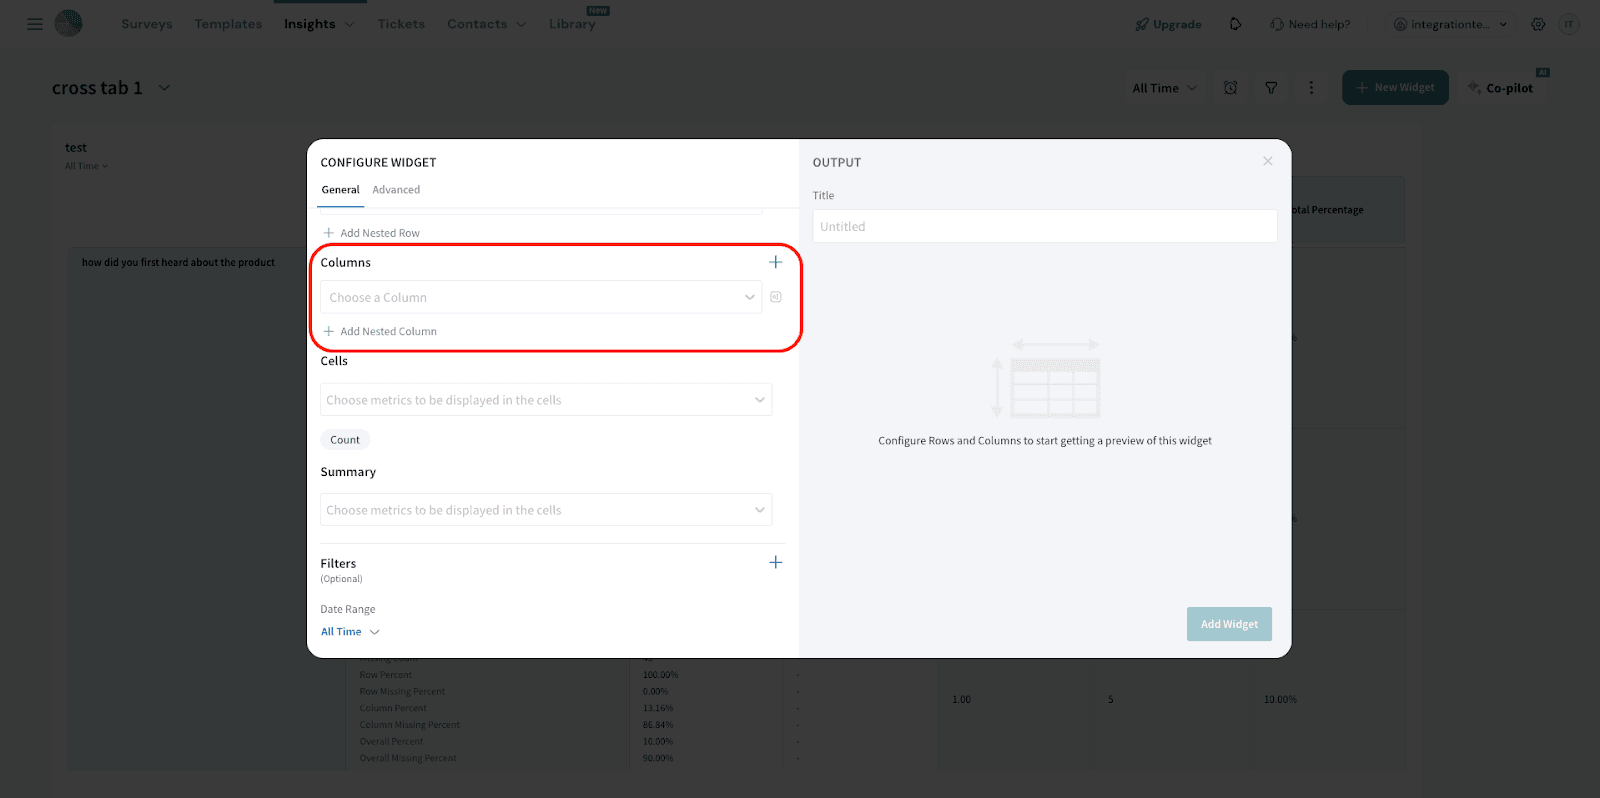
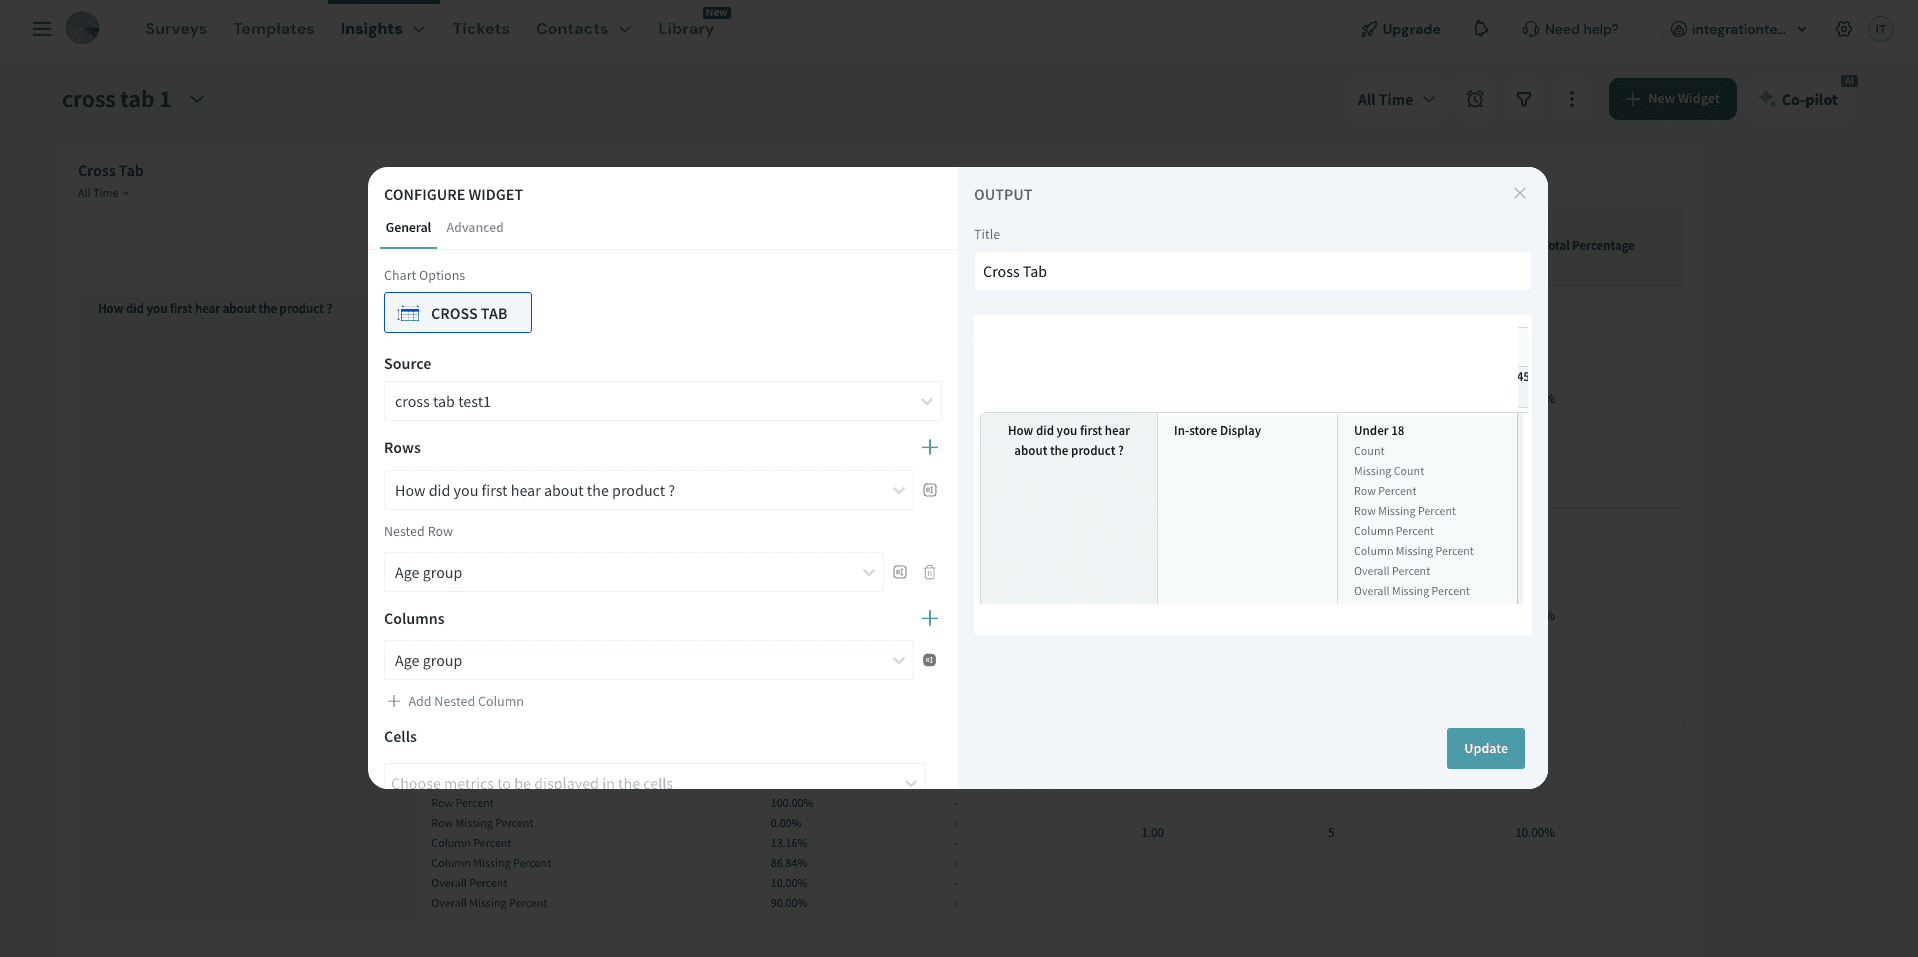
- Click on the Cells dropdown to select which data points you'd like displayed in each cell of your Crosstab.
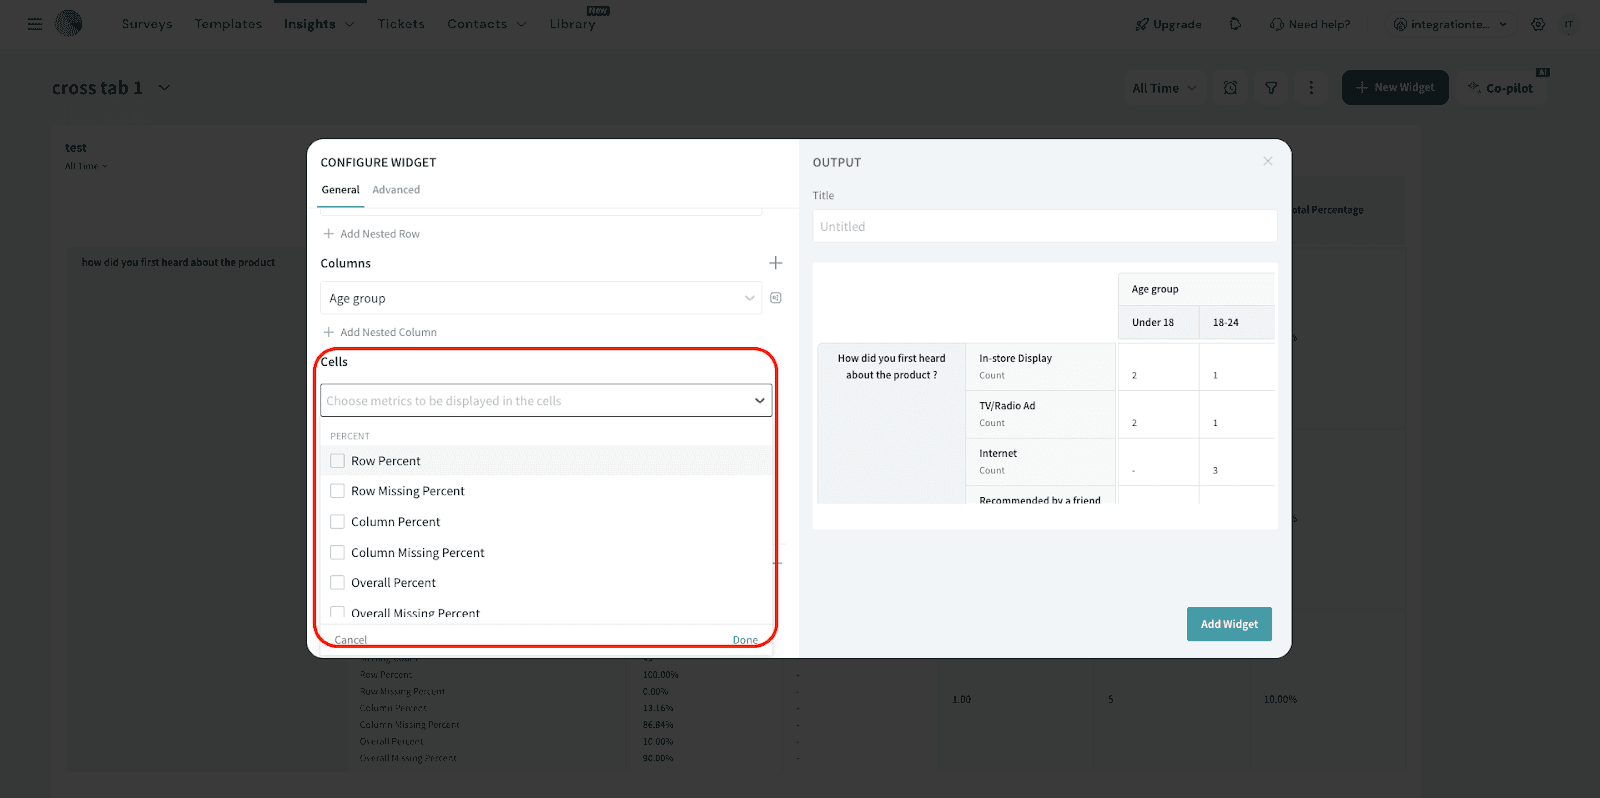
The available options include:
- Row Count: The number of responses in each cell.
- Missing Count: The difference between the total number of respondents and those who answered the question
- Row Percent: Calculated as the cell count divided by the total for that row.
- Row Missing Percent: Calculated as 100 minus the row percent.
- Column Percent: Calculated as the cell count divided by the total for that column.
- Column Missing Percent: Calculated as 100 minus the column percent.
- Overall Percent: The percentage of the cell count relative to the overall total.
- Overall Missing Percent: Calculated as 100 minus the overall percent.
With Summary, you can perform advanced metrics and significance tests to help you analyze your data more deeply.
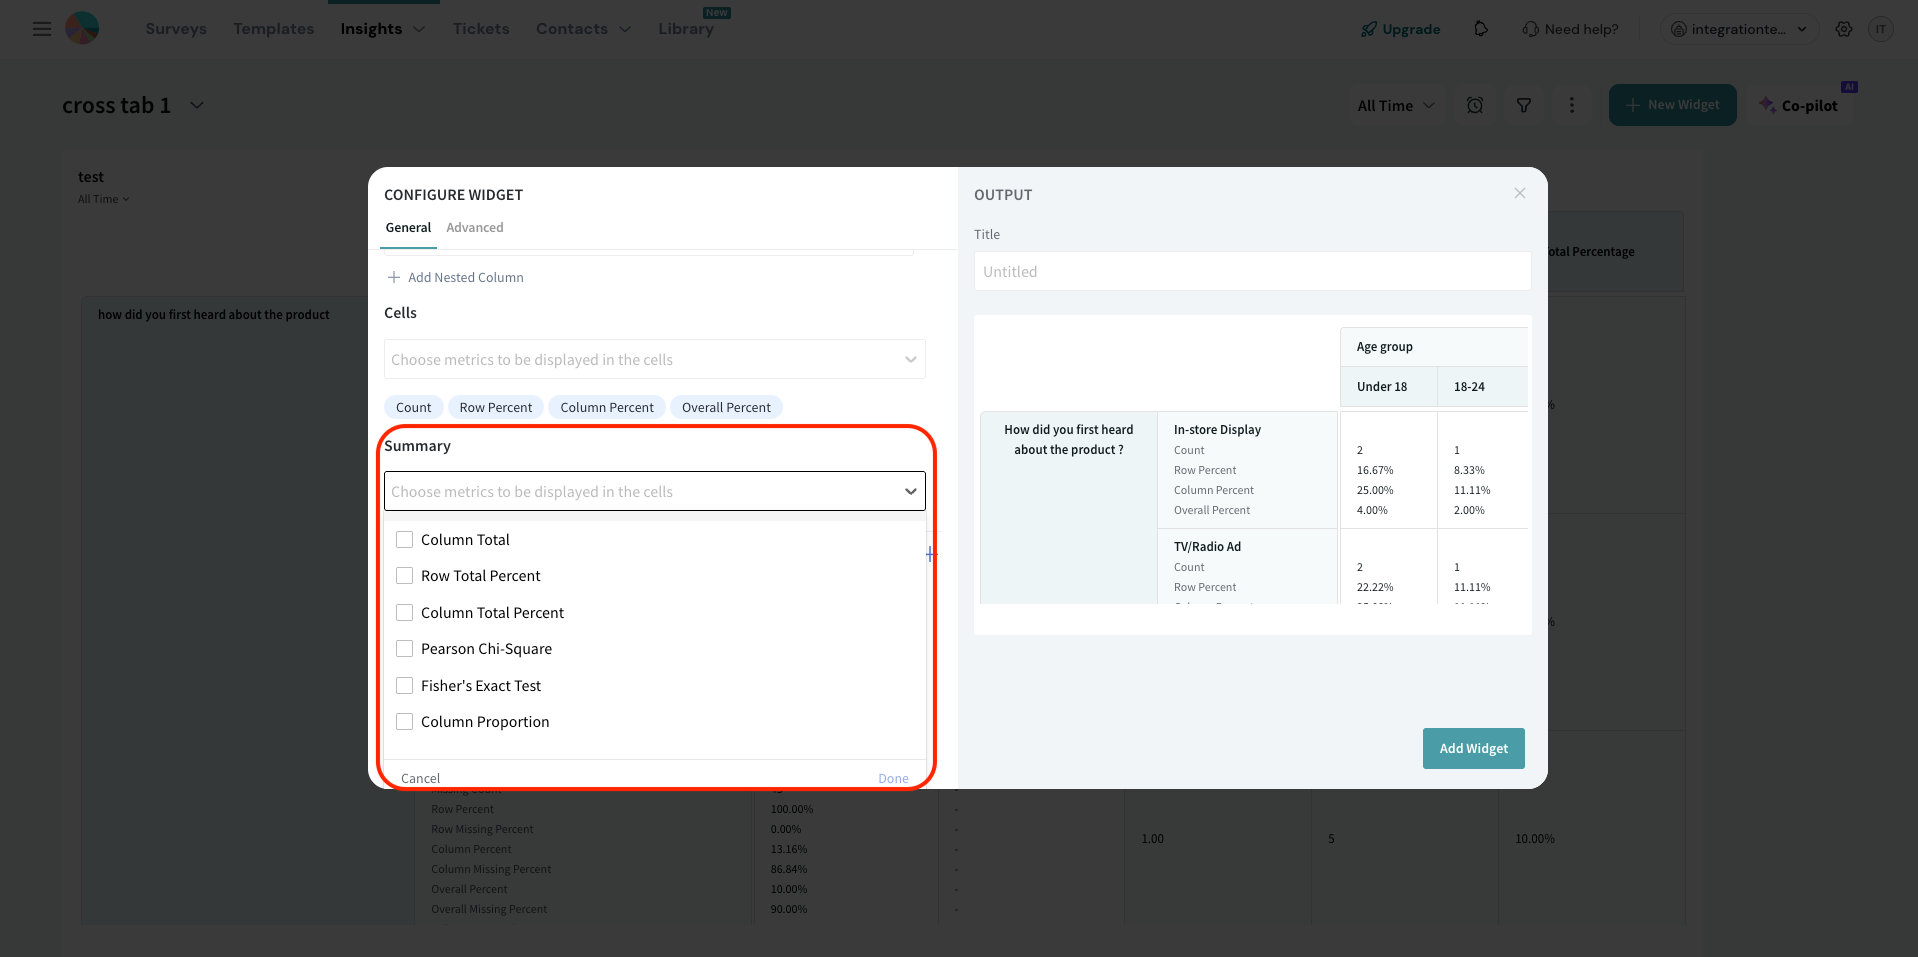
The available options include:
- Row Means: The average value for each row, available only if the column question has numeric reporting values.
Note: Row means are not available if the data includes grouped answers or nested questions. - Column Means: The average value for each column, available only if the row question has numeric reporting values.
Note: Column means are also unavailable for grouped answers or nested questions. - Row Totals: For single-select questions: The total number of responses shown in that row. For multi-select questions: The number of respondents who selected at least one of the displayed options.
Note: Row totals may not equal the sum of selected options due to multiple selections by individual respondents. - Column Totals:For single-select questions: The total number of responses shown in that column.
For multi-select questions: The number of respondents who selected at least one of the displayed options.
Note: Like row totals, column totals may vary due to multiple selections. - Row Total Percent: Percentage of responses each cell contributes to the total responses in its row.
- Column Total Percent: Percentage of responses each cell contributes to the total responses in its column.
Significance Tests - The Chi-Square (X²) statistic is used to determine whether there is a significant relationship between two questions in a Crosstab. It tests the independence of the variables — that is, whether the distribution of responses in one question is related to the other.
A significant Chi-Square result (based on the selected confidence level) suggests that the two questions are statistically related, not independent. - Fisher’s Exact Test is available only for 2x2 tables, where each of the two questions being compared has exactly two answer options. It is considered the most accurate method for calculating significance because it provides an exact p-value, unlike Chi-Square, which uses an approximation. While especially useful for small sample sizes, Fisher’s test remains valid regardless of sample size.
- Column Proportions: This significance test compares all pairs of columns within each row of a given banner question. After a significant relationship is found between two questions using the Chi-Square test, the Column Proportions test helps identify which specific pairs of columns differ significantly. It does this by comparing the proportion of respondents in each column calculated as the cell count divided by the total responses for that column.
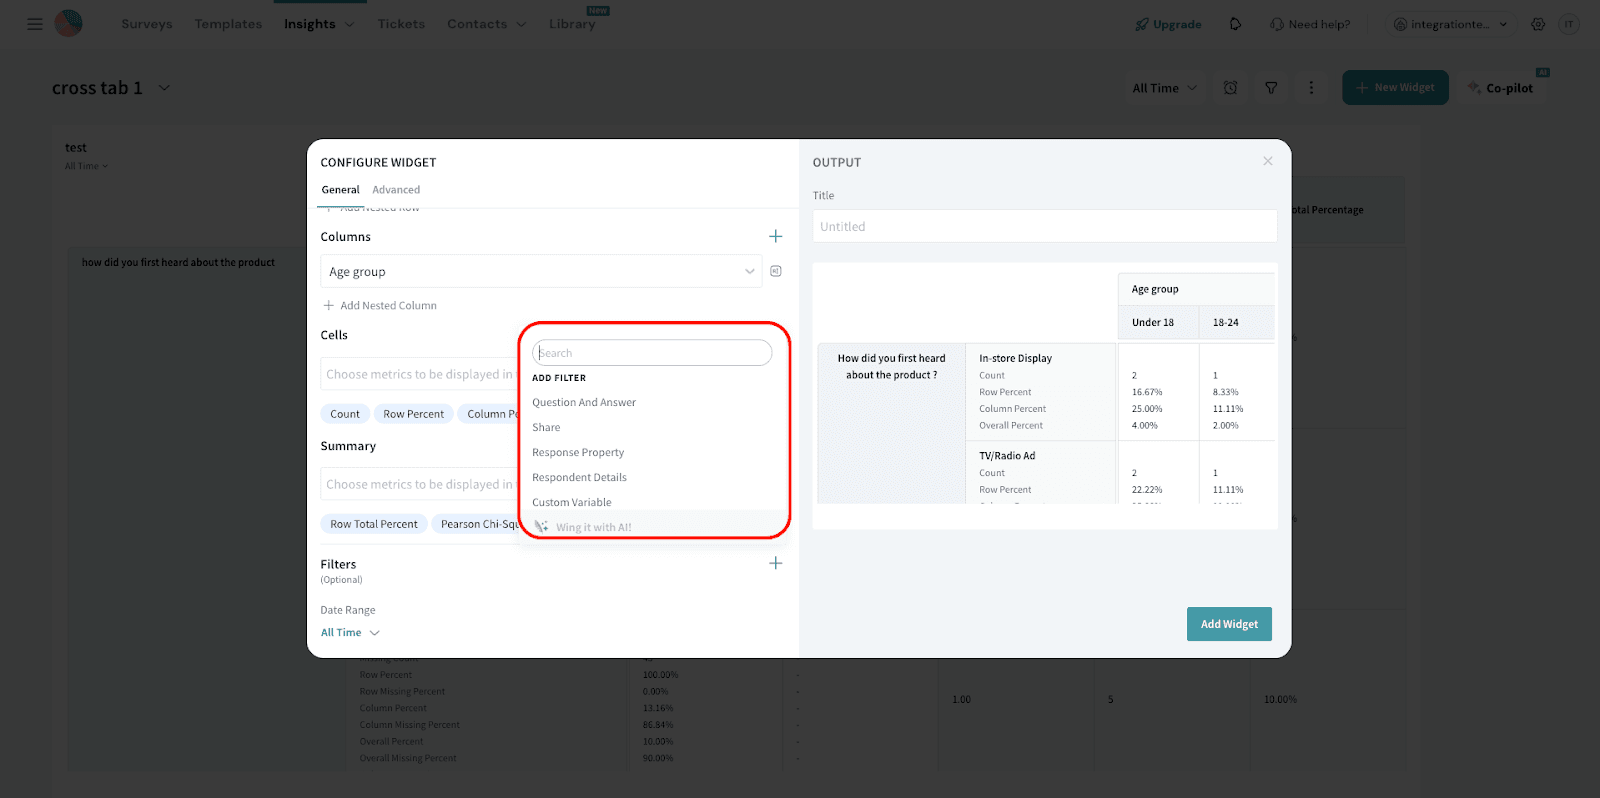
- If you wish to filter the response data further, click the + sign to add the filters. You can either select a preset filter, use a custom variable or use AI to create a filter.
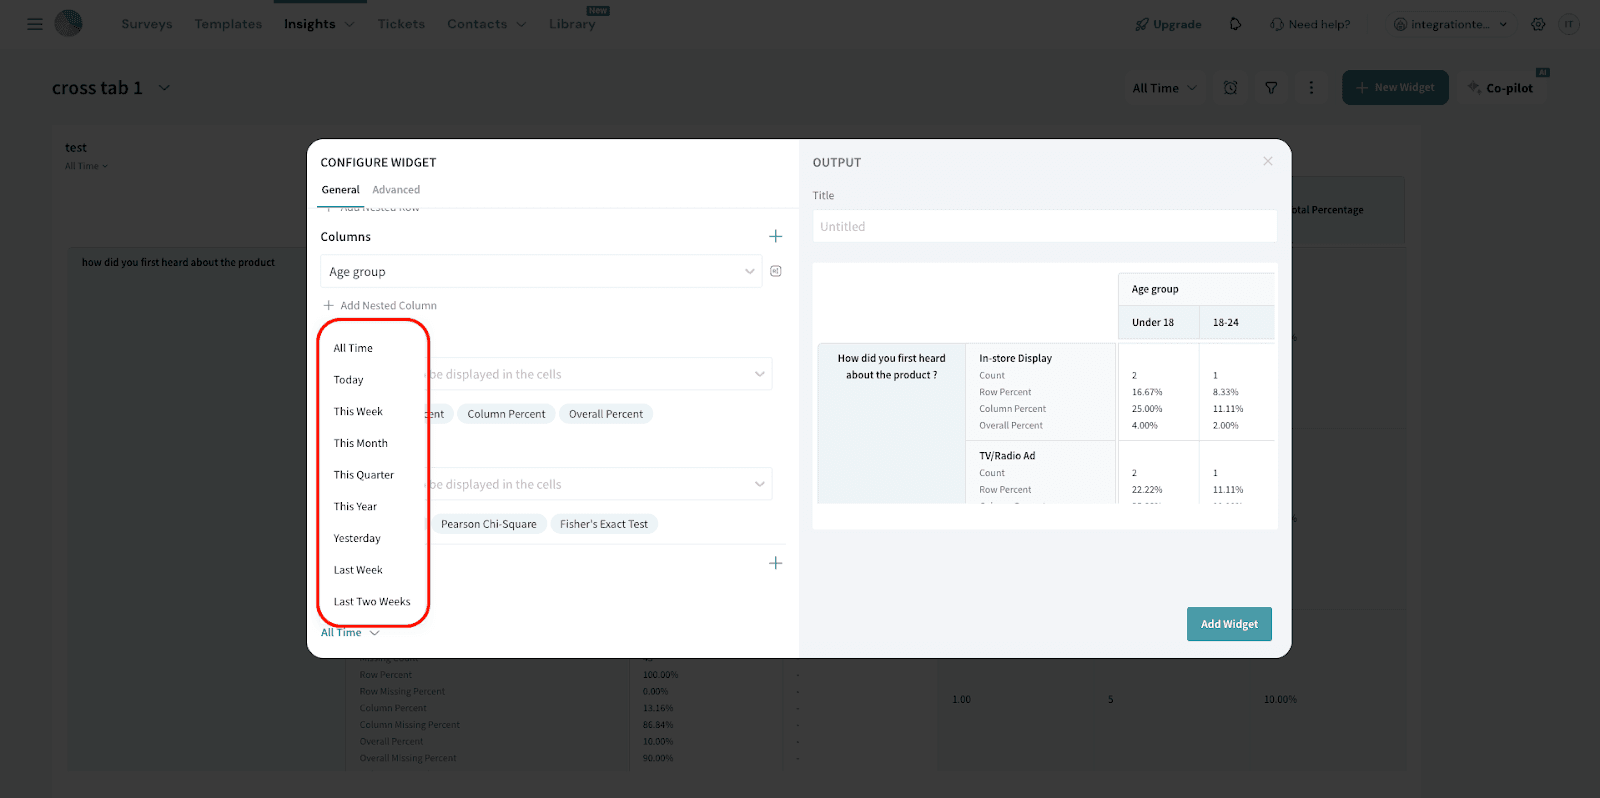
- You can also select the Date Range.
- Navigate to the Advanced tab to further customize your Crosstab report with the following options:
Significance:
Select the desired confidence level for statistical testing. Available levels are 0.10, 0.05, or 0.01. This setting applies to both Chi-square and Column Proportions tests. Lower confidence levels (e.g., 0.01) indicate a stricter threshold for statistical significance.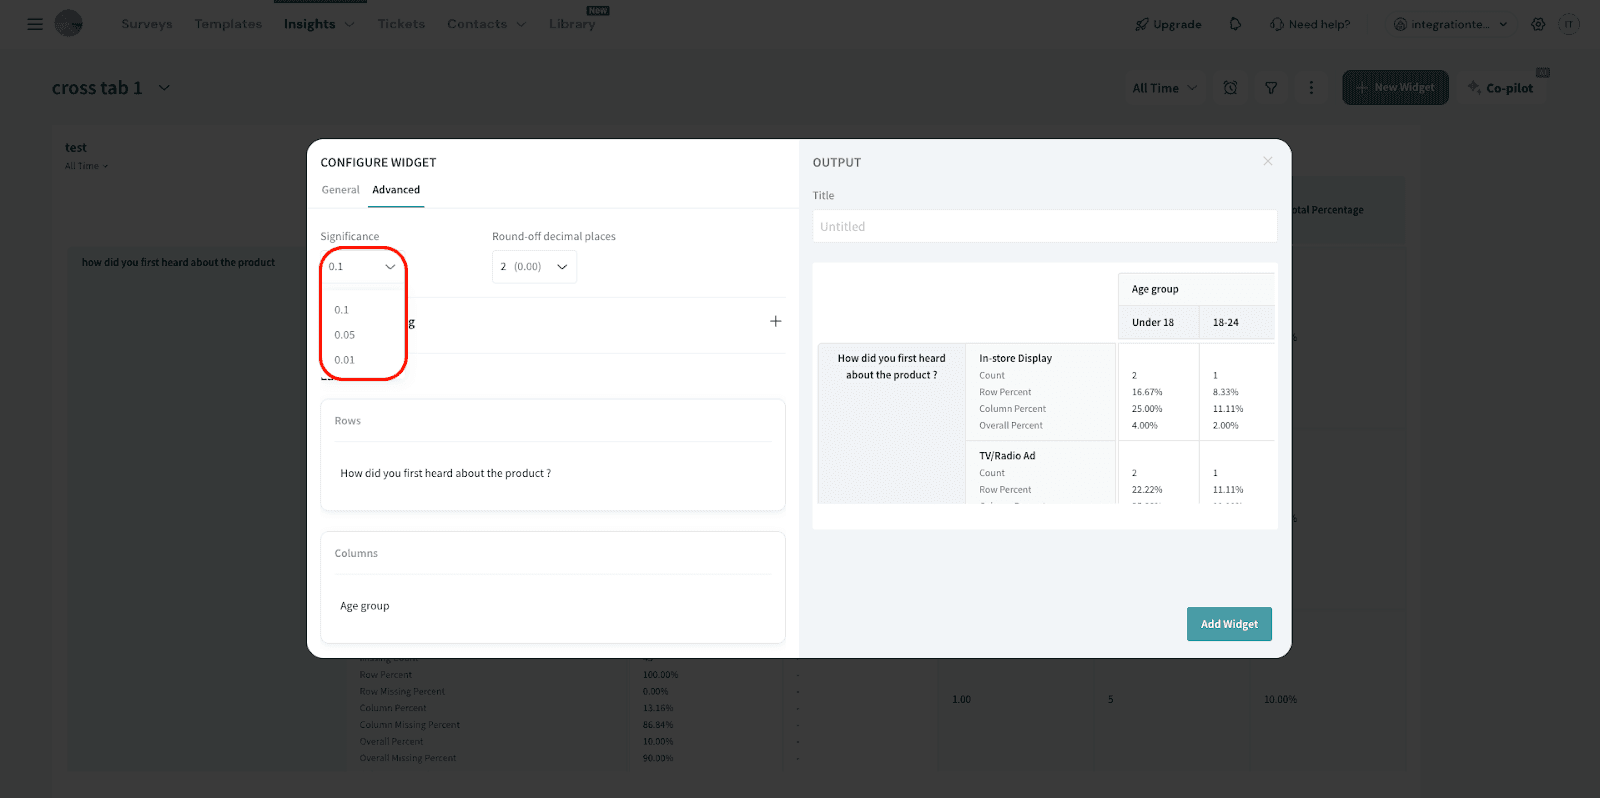
Round Off:
Choose how many decimal places to display in your Crosstab results. You can set values to 0, 1, or 2 decimal places based on your reporting needs.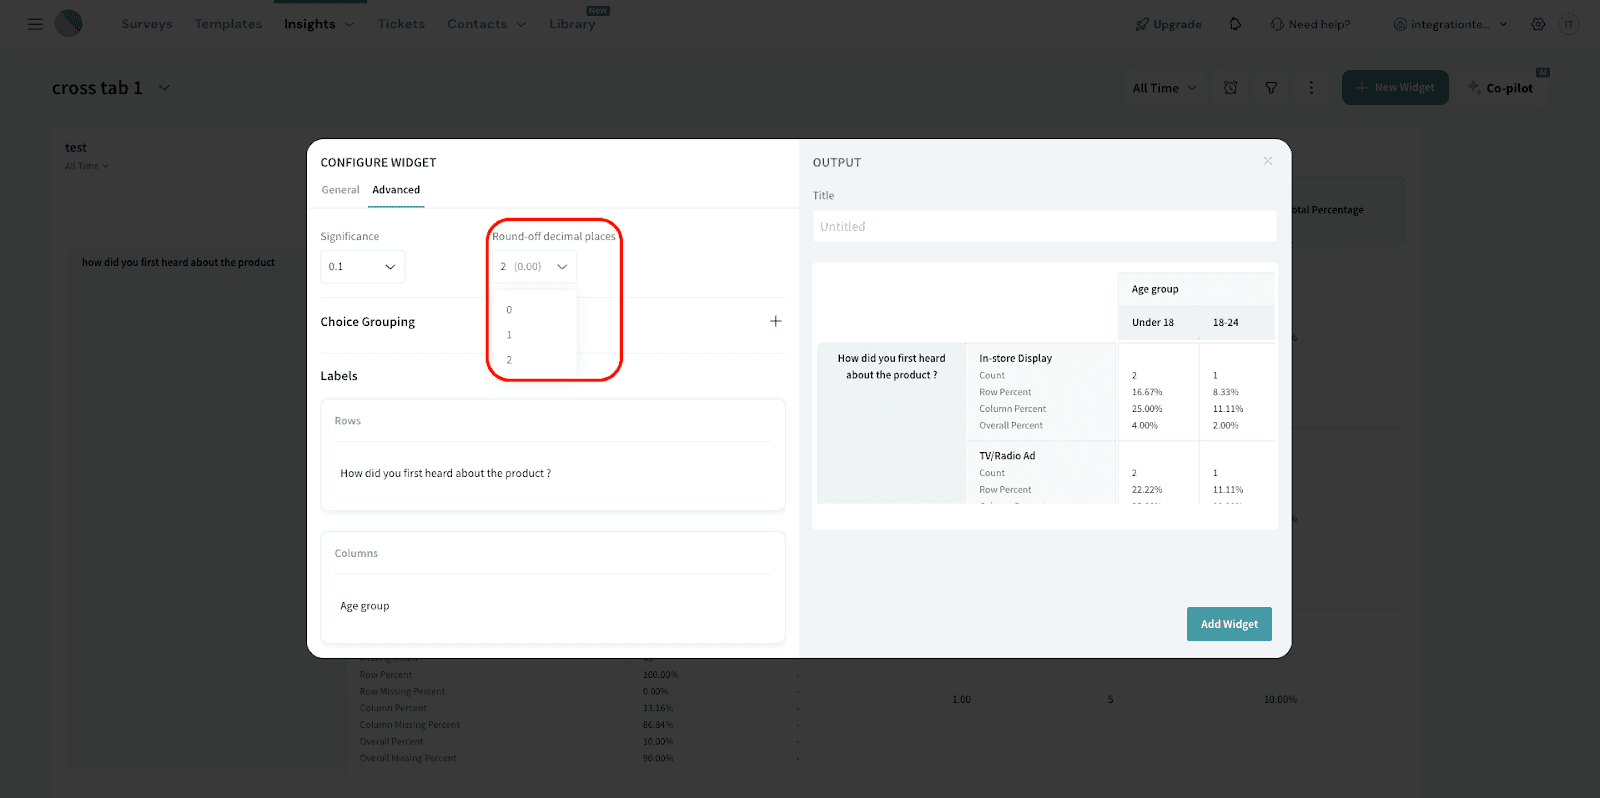
Choice Grouping:
Group related answer options together for clearer analysis.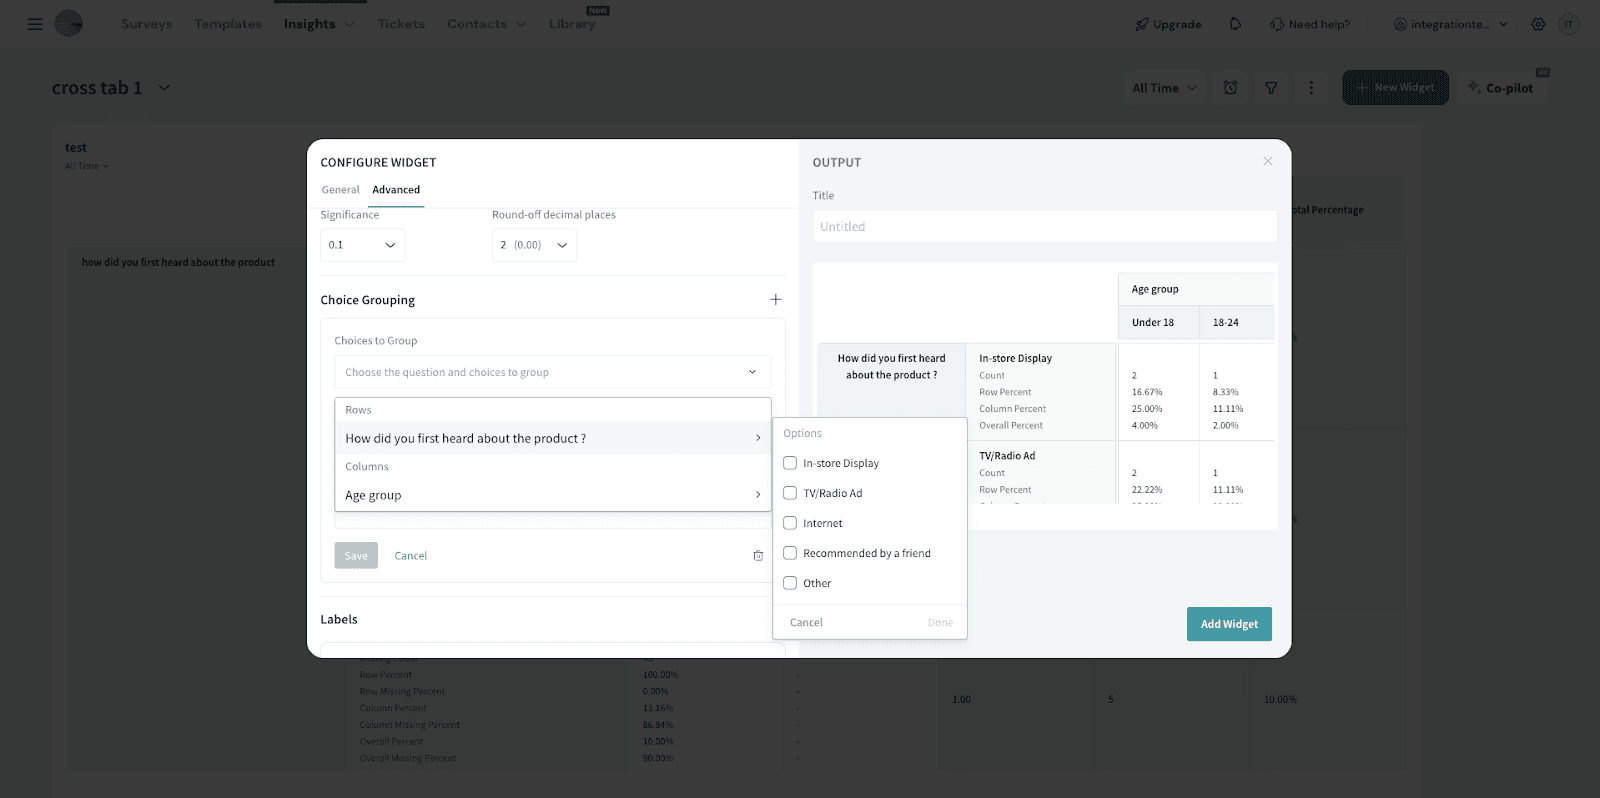
- Group Name: Assign a label to the group for easy identification.
- Reporting Value: Numeric reporting values are required to calculate Row Means and Column Means.
Row Means are available only if the column (banner) question has numeric values.
Column Means are available only if the row (stub) question has numeric values.
Note: Means are not available when answer grouping or nesting is applied.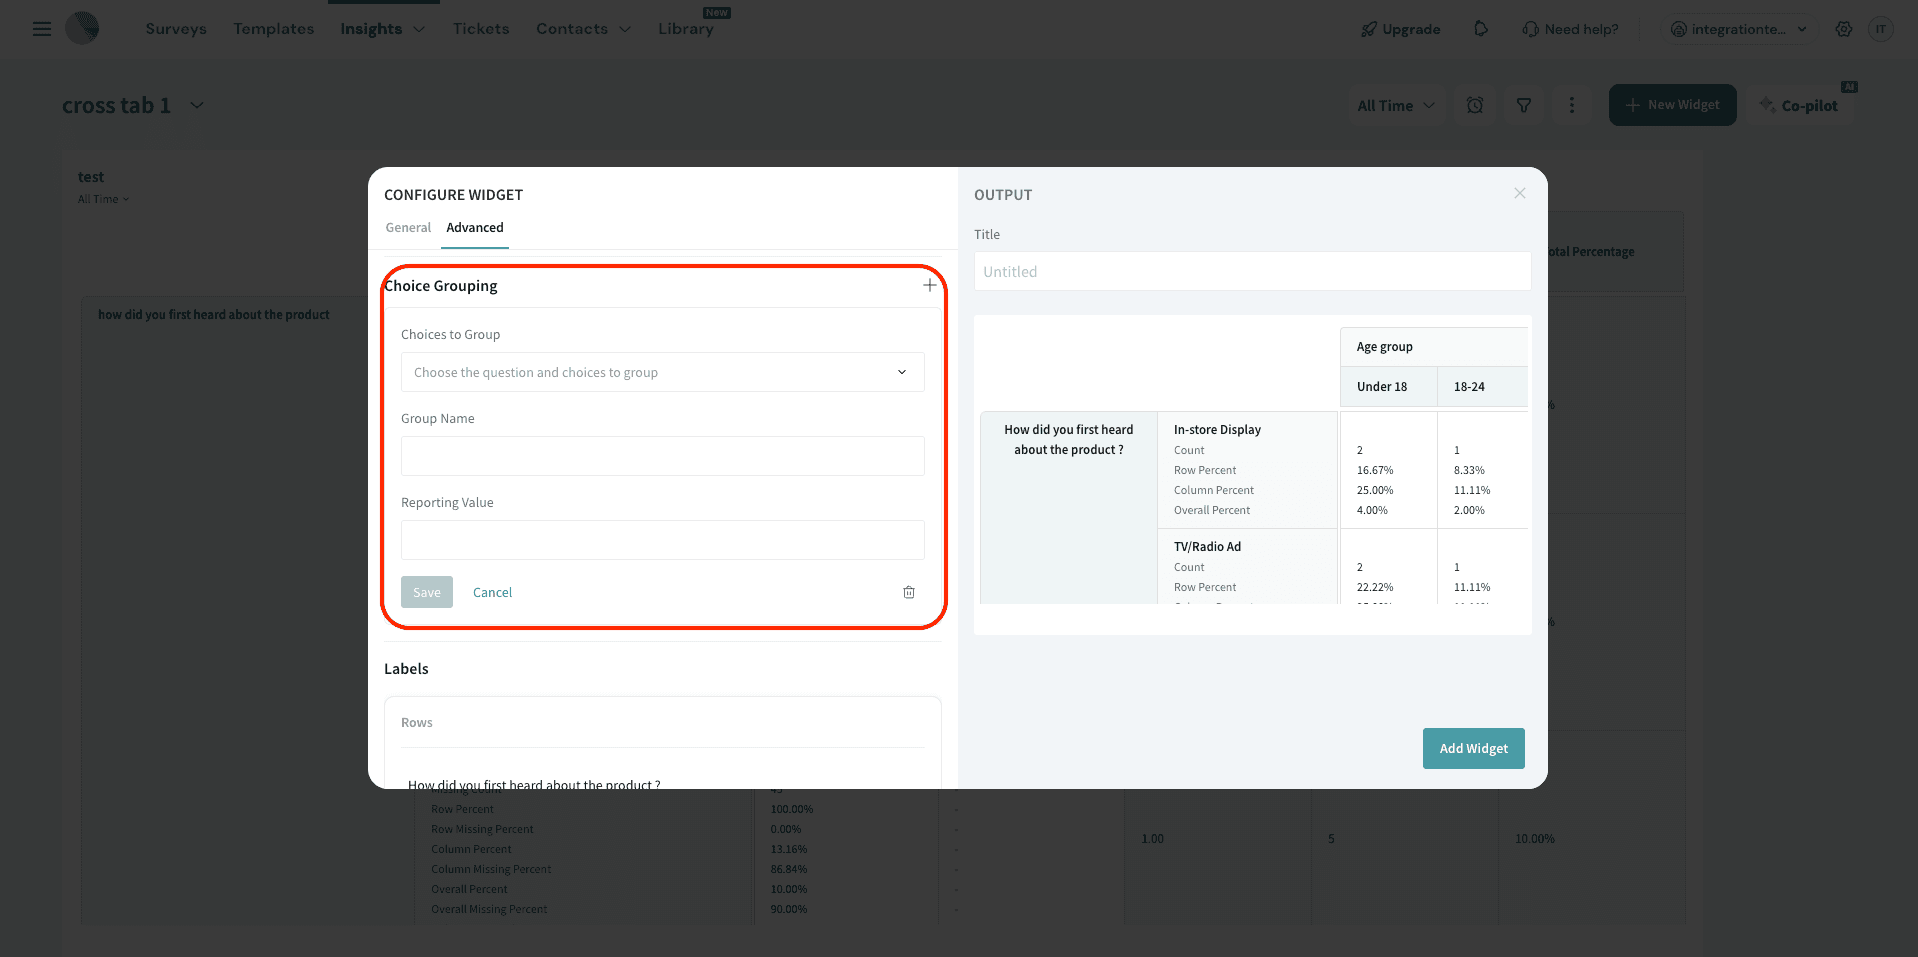
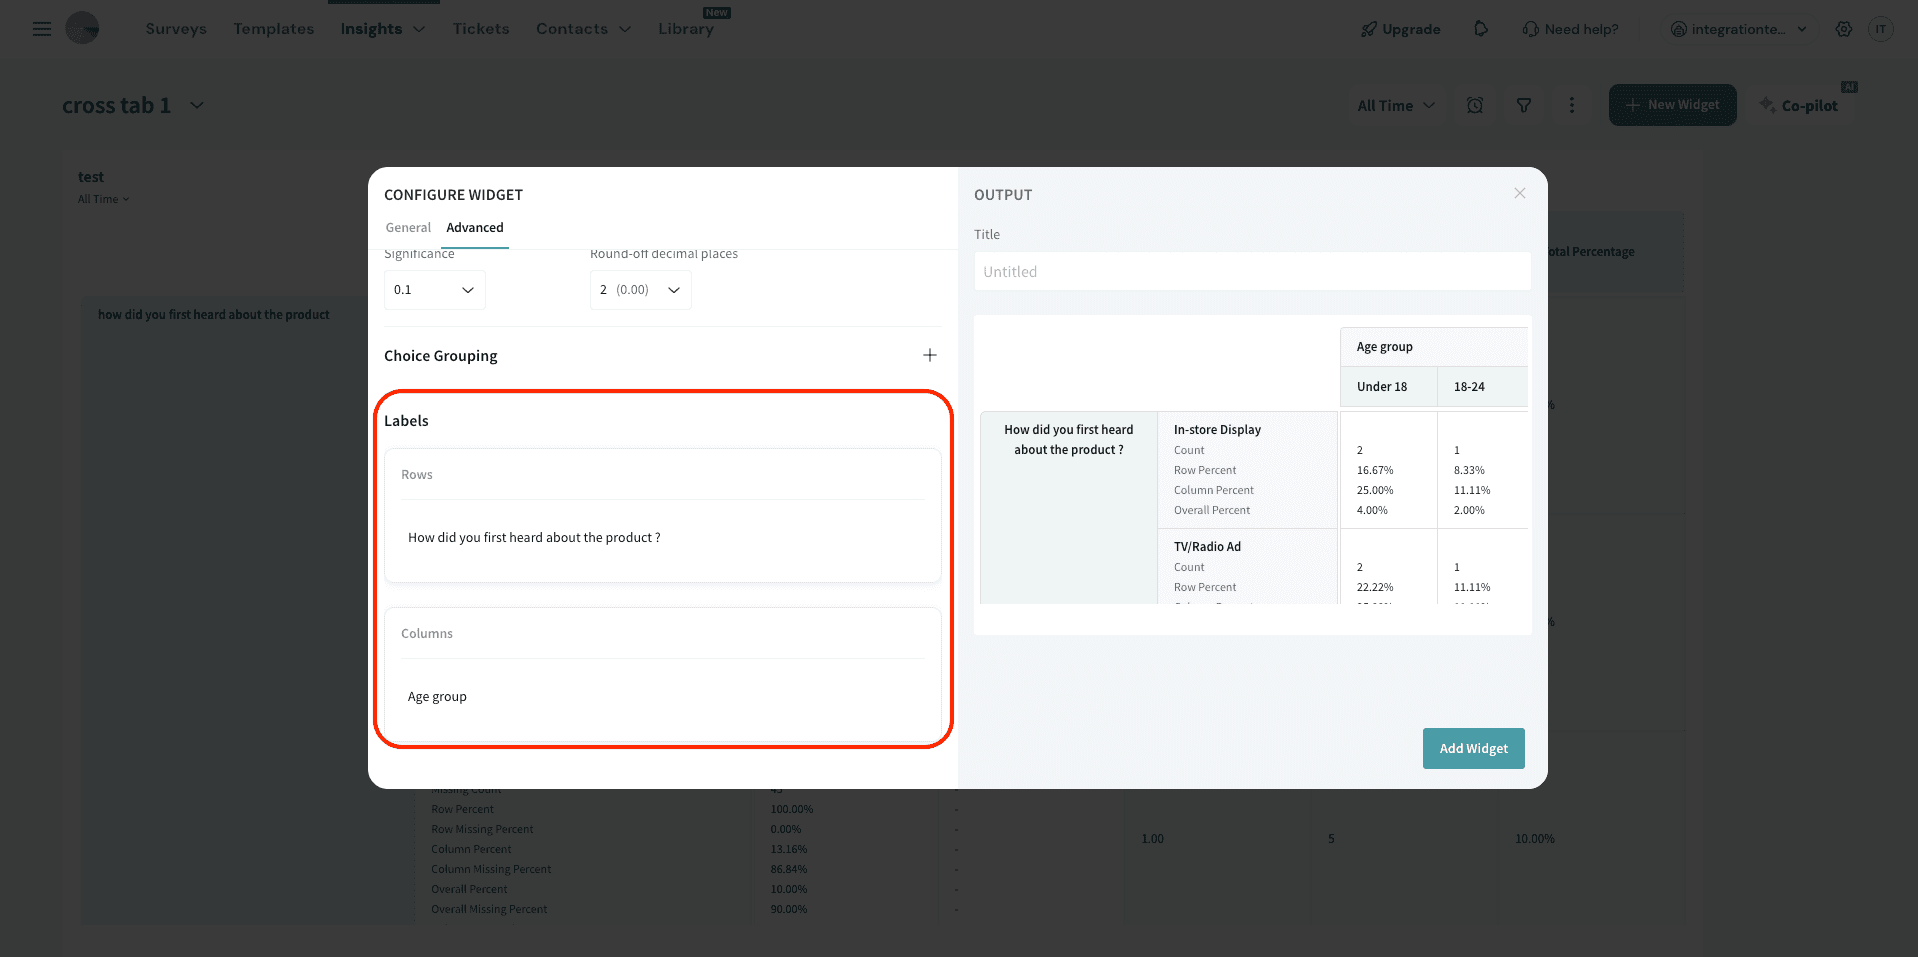
- Labels: Customize the display names of individual rows and columns to make your Crosstab report easier to interpret for your audience.
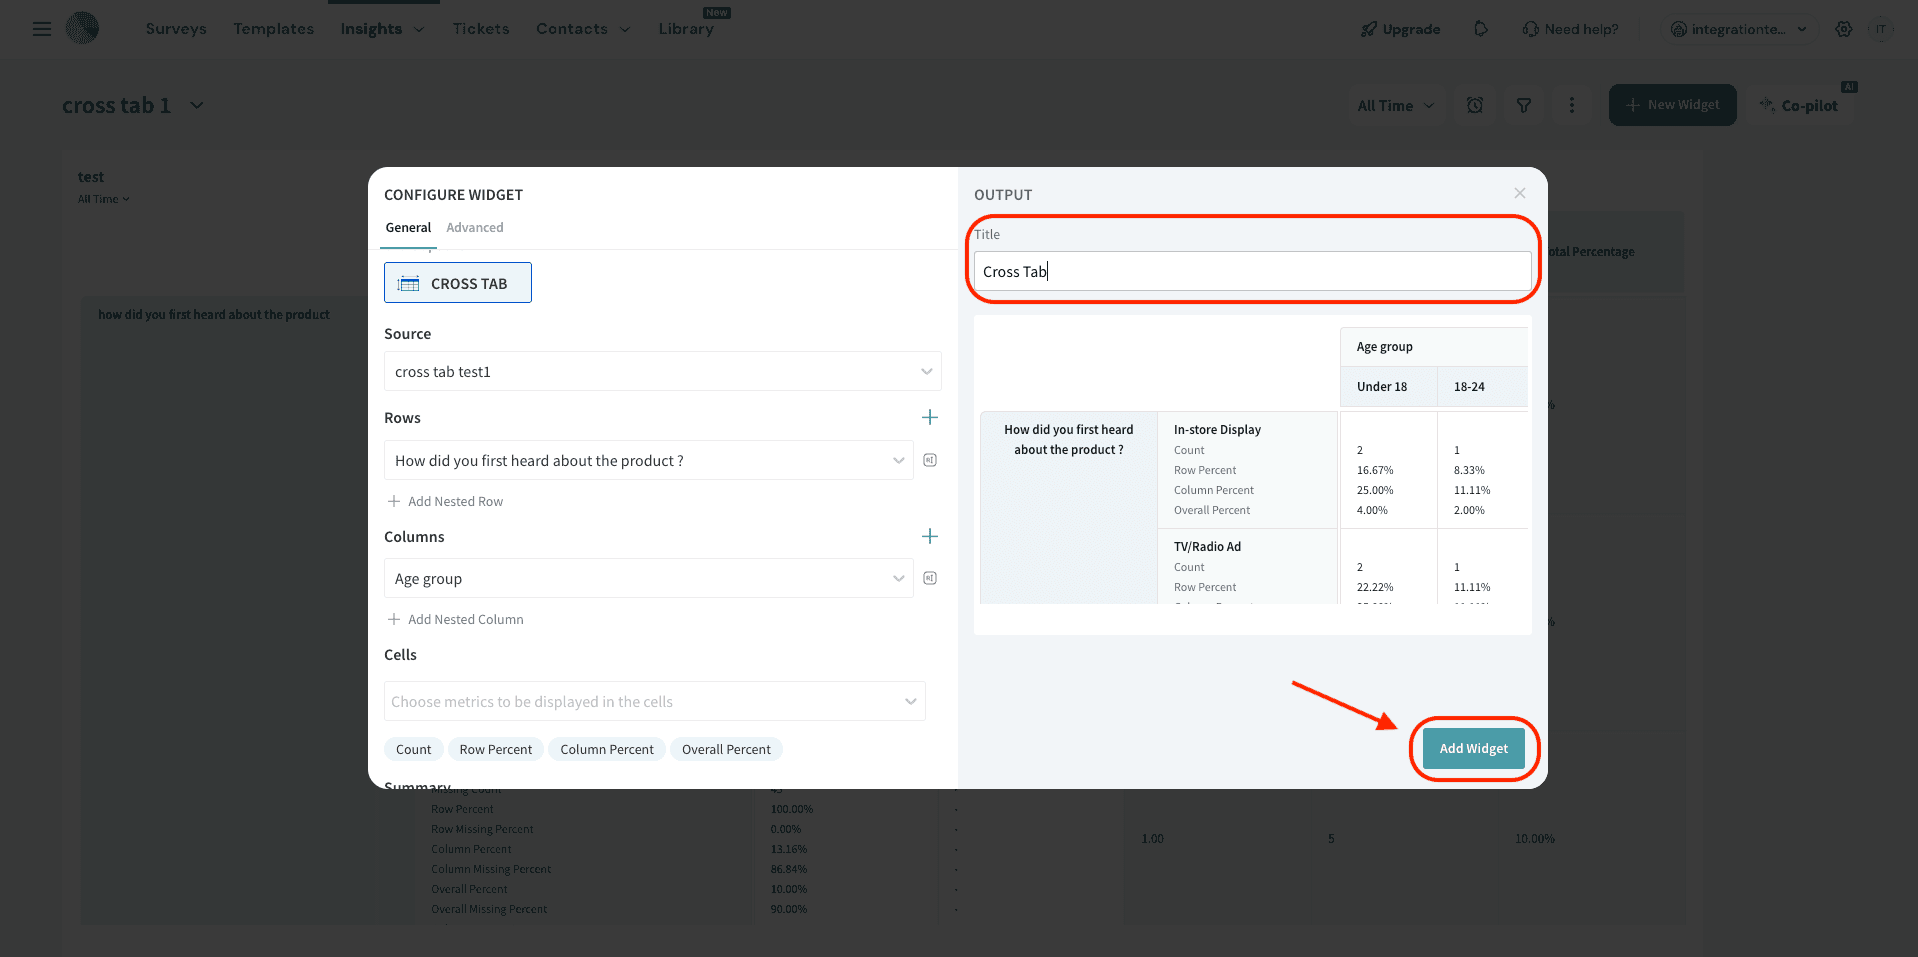
- Once done, add the title for the widget and click Add Widget.
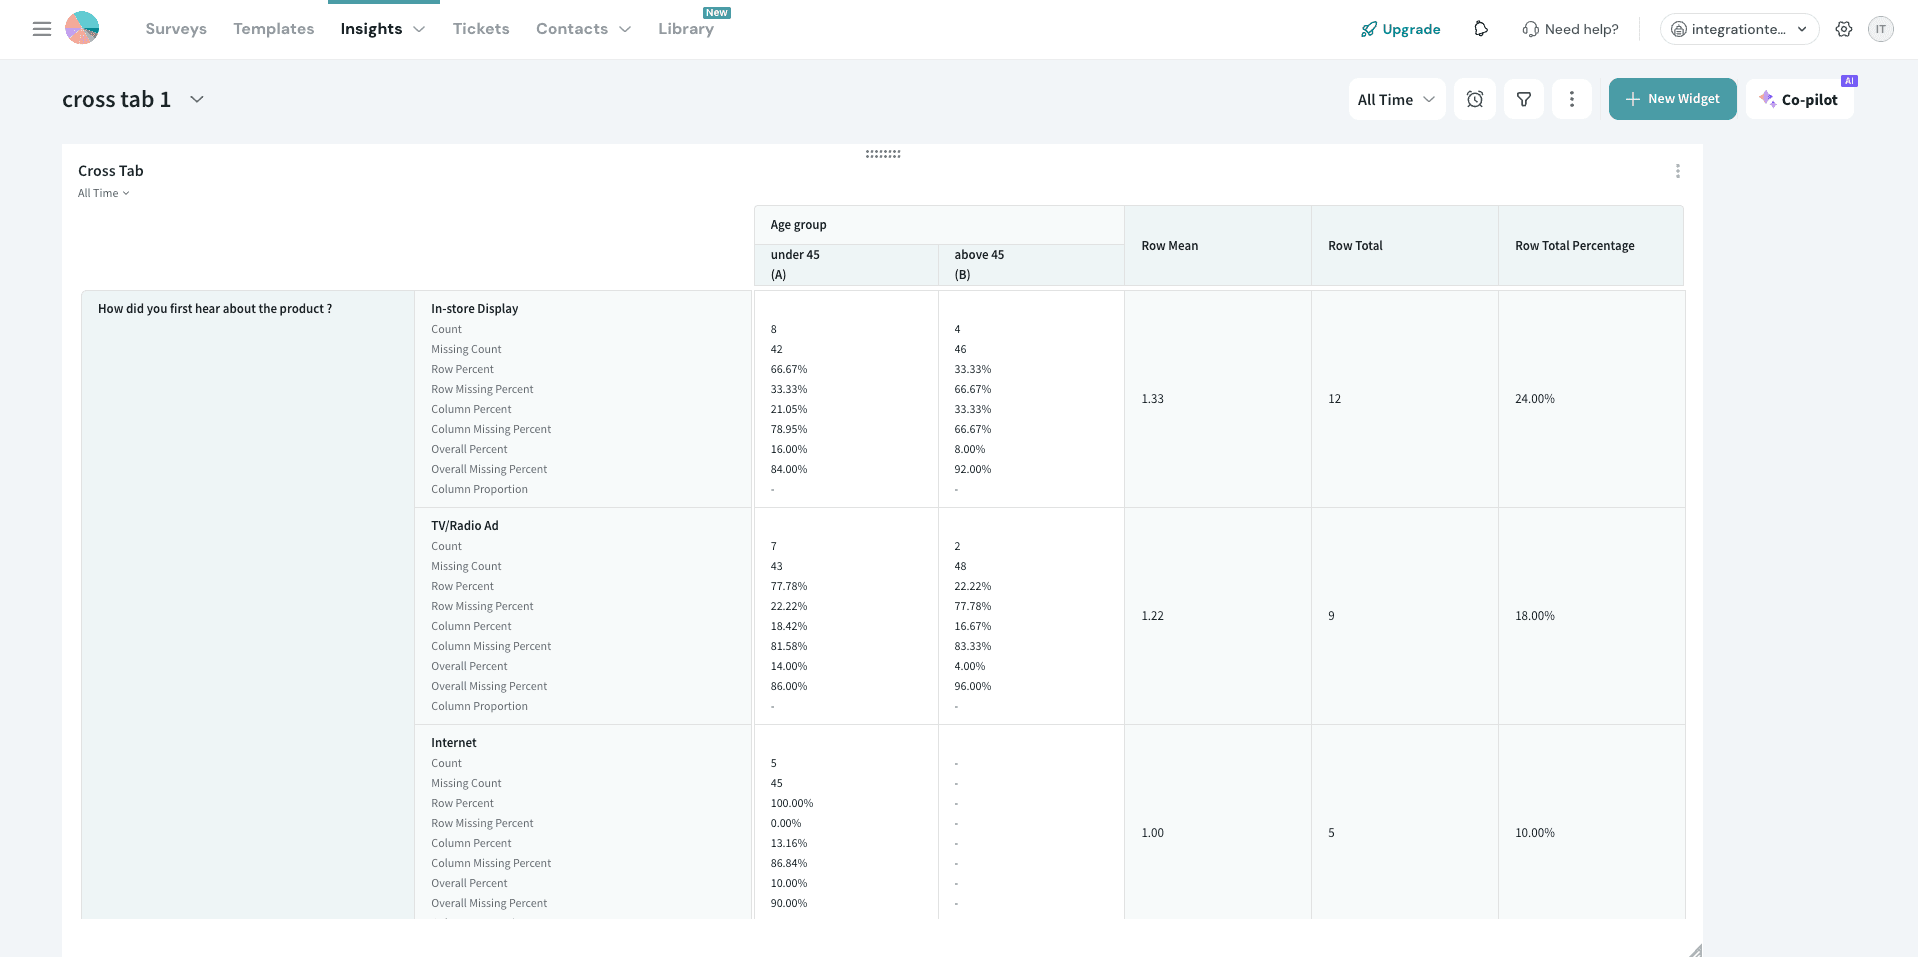
- The widget will be displayed on your dashboard. You can move and resize the widget to your liking.
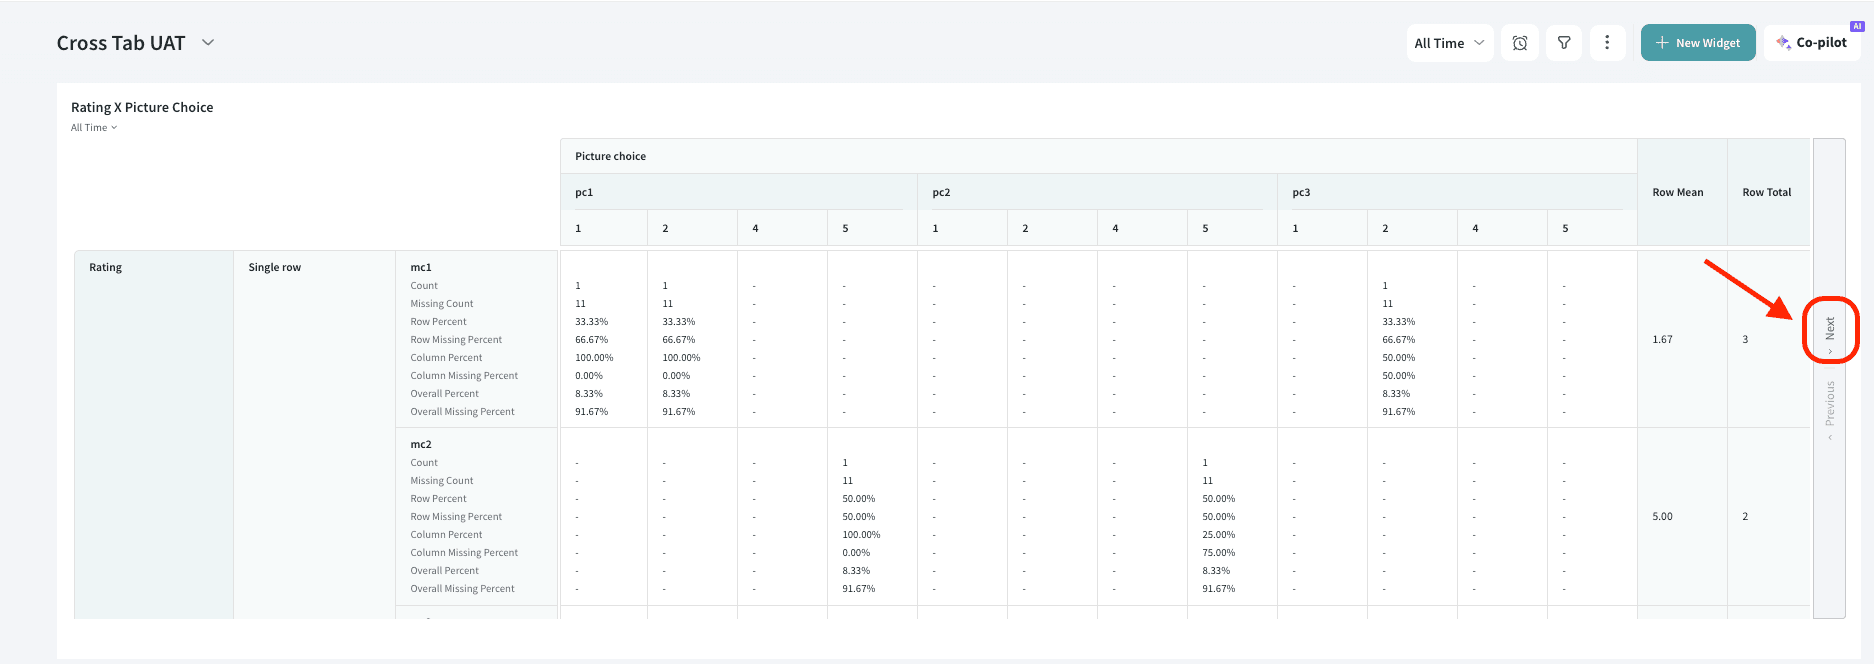
- You’ll notice the additional columns added to the structure. To view them, navigate to the ‘Next’ where the expanded column layout will be displayed.
That's all about Cross Tab widget.
Feel free to reach out to our community if you have any questions.