Social Listening
What is Social Listening?
Social listening is the process of tracking and analyzing online conversations about your brand, industry, and competitors. It helps businesses understand customer sentiment, identify trends, and craft strategies.
Dive deep into social conversations to stay proactive.
Why is it important?
- Helps brands understand what customers like and dislike about their brand and product
- Brands gain a deeper understanding of customer’s perceptions about their competition
- Brands can immediately address any negative comments or conversations happening, ensuring customer satisfaction
- Helps brands be proactive instead of being reactive to customer sentiments
Let's look at it with an example.
Starbucks noticed a growing conversation about their Expresso shots across platforms like Instagram, Twitter, and Facebook. Customers were sharing their experiences, with many mentioning inconsistencies in the taste and flavour of their coffee.
Some customers expressed disappointment, while others offered suggestions on how to improve. This feedback caught the brand’s attention. Starbucks recognized the need to address these concerns to ensure their customers continued to have a consistent, high-quality experience.
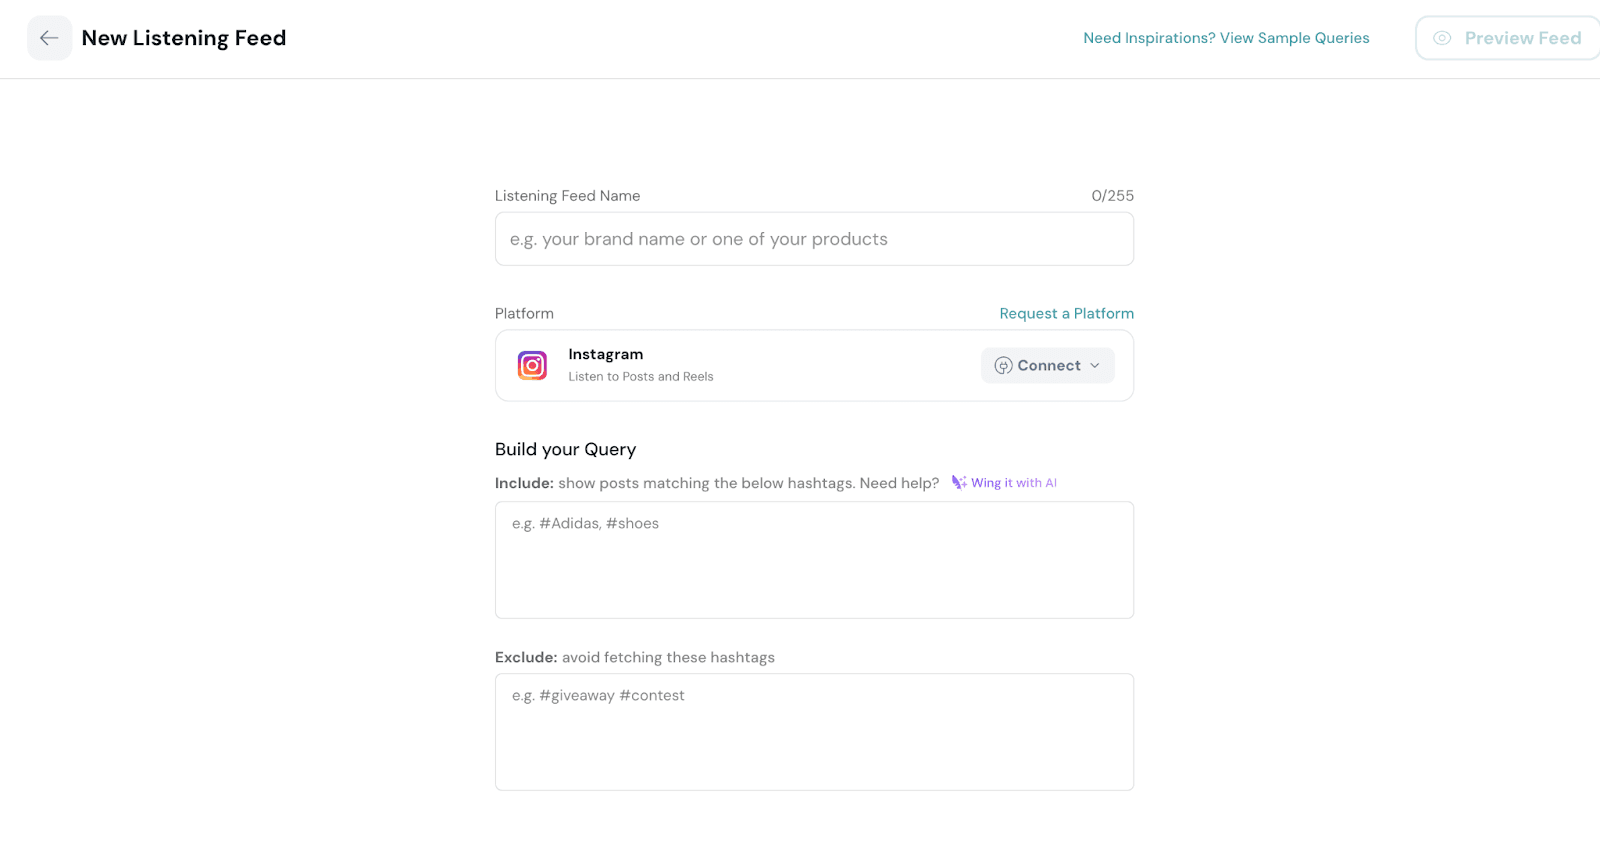
How to set up?
- Navigate to Social under Reputation
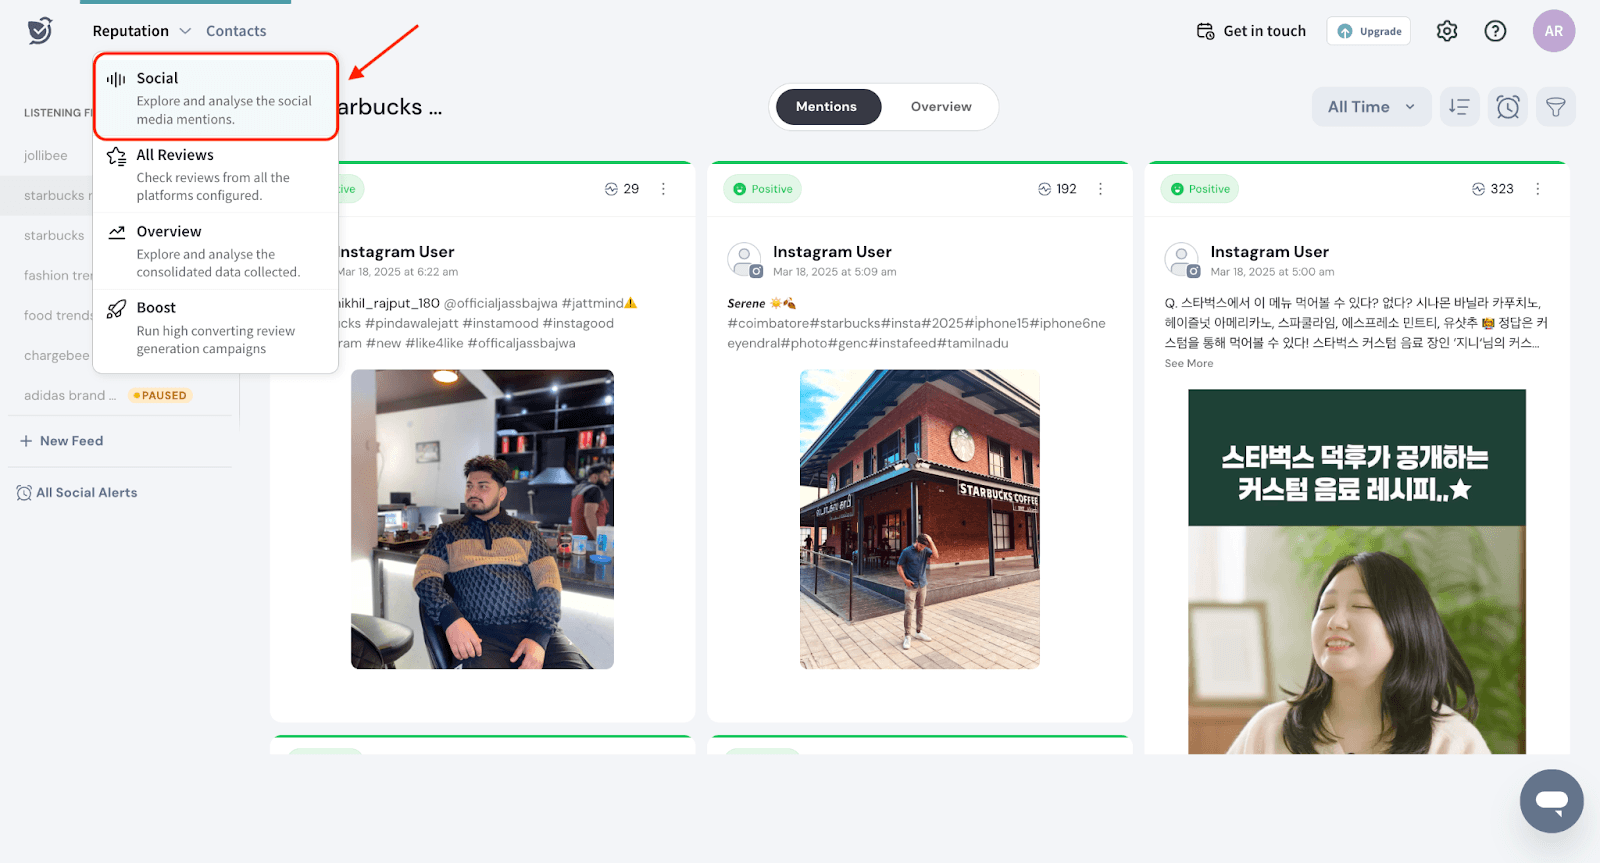
- Click ‘ New Feed’ to create a new listening feed.

- Enter the Listening Topic
Listening Feed name - Enter a name for the Feed. This helps track and manage specific campaigns or product-related conversations, such as monitoring customer feedback on Expresso quality. In our example the topic name can be “Starbucks Expresso Quality Feedback. - Platform- Choose the social media platform from where the feedback can be monitored. It can be, Instagram , Facebook (coming soon), Twitter( coming soon) and Reddit(coming soon)
- Build your Query(Include)- Enter relevant keywords or hashtags. This helps capture posts specifically mentioning brand and product, ensuring all relevant conversations are tracked. In our example of Starbucks we have hashtags like #StarbucksExpresso or #ExpressoQuality.
Note: The "Wing it with AI" suggestion link helps users by providing AI-driven keyword recommendations based on real-time trends and existing data. - Build your Query(Exclude)- Irrelevant terms can be excluded, to filter out posts unrelated to product quality. For example, Starbucks might exclude hashtags like #FreeCoffee or #StarbucksRewards to focus only on genuine feedback about their Expresso drinks.
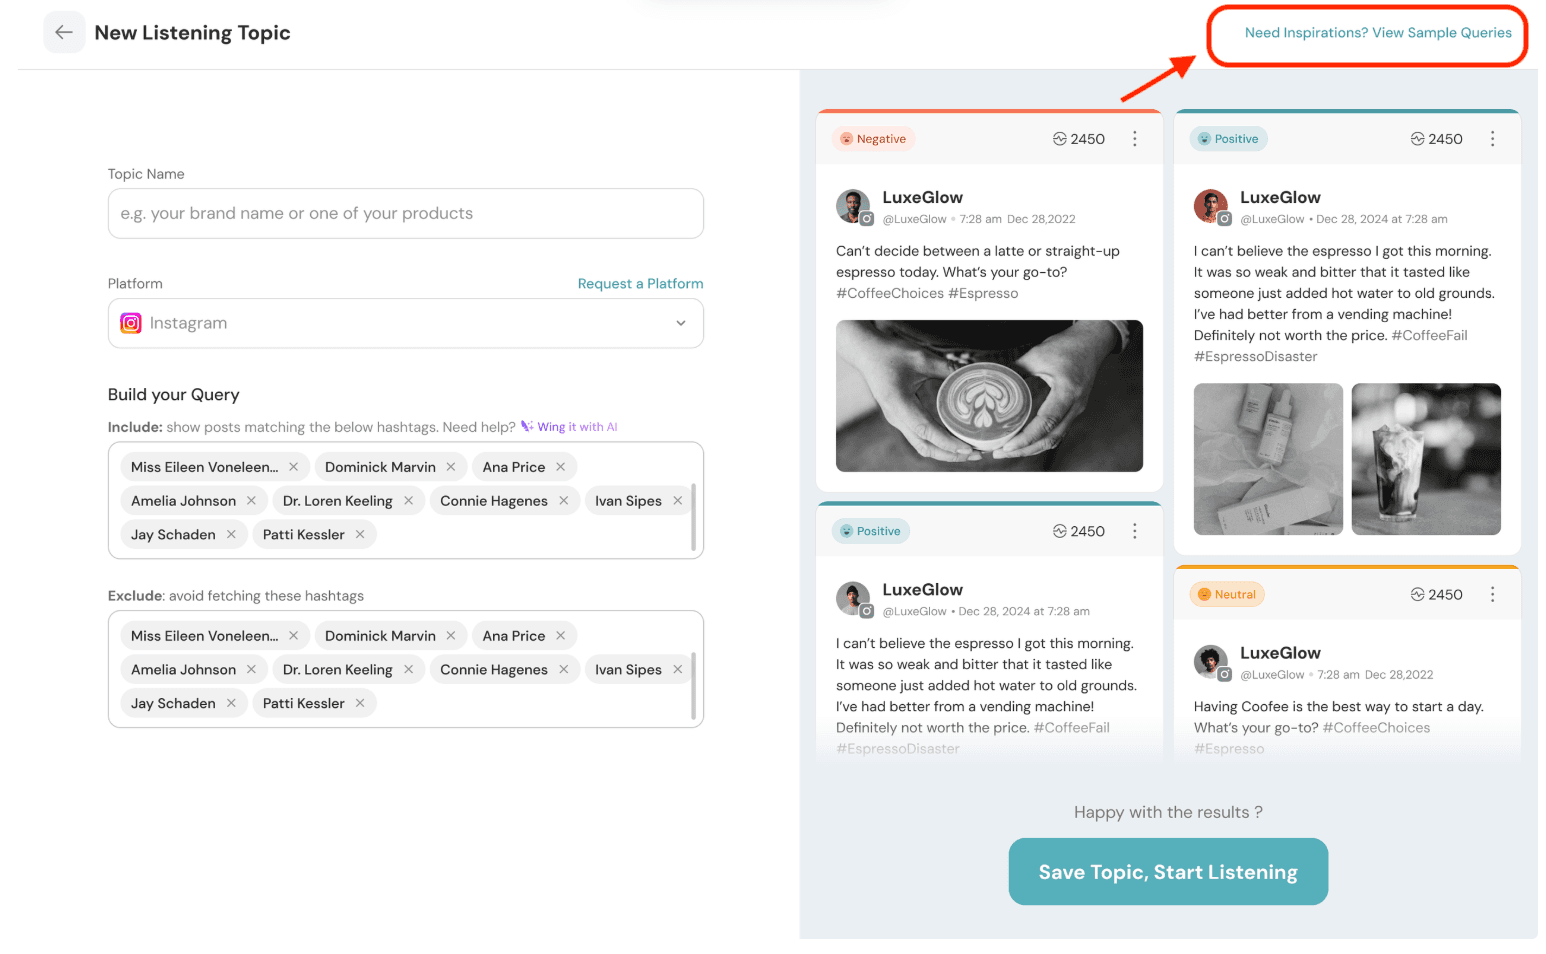
- Click on Preview Feed to preview the results of the query before finalizing it.
This is an example of how the Preview will appear.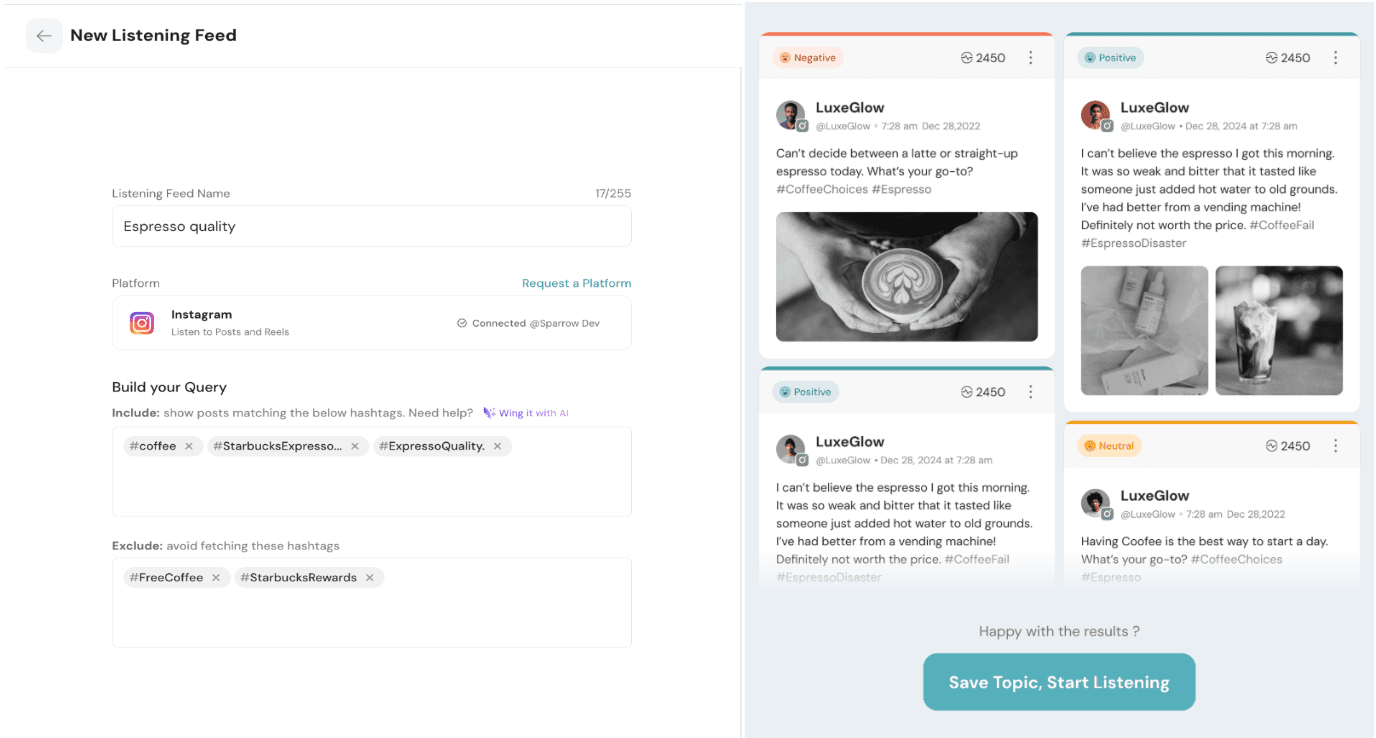
- You can also use ‘Need Inspirations? View Sample Questions’ to get sample queries related to various industries, Feeds, or campaigns. This will help you in building the query in detail.
- Once the feed is created, the listing view can be seen. This consists of all the mentions by customers on the particular feed.
In our example, since we want to understand what customers have to say about Espresso, we will get all the mentions with Espresso.
You can even view a mention in detail.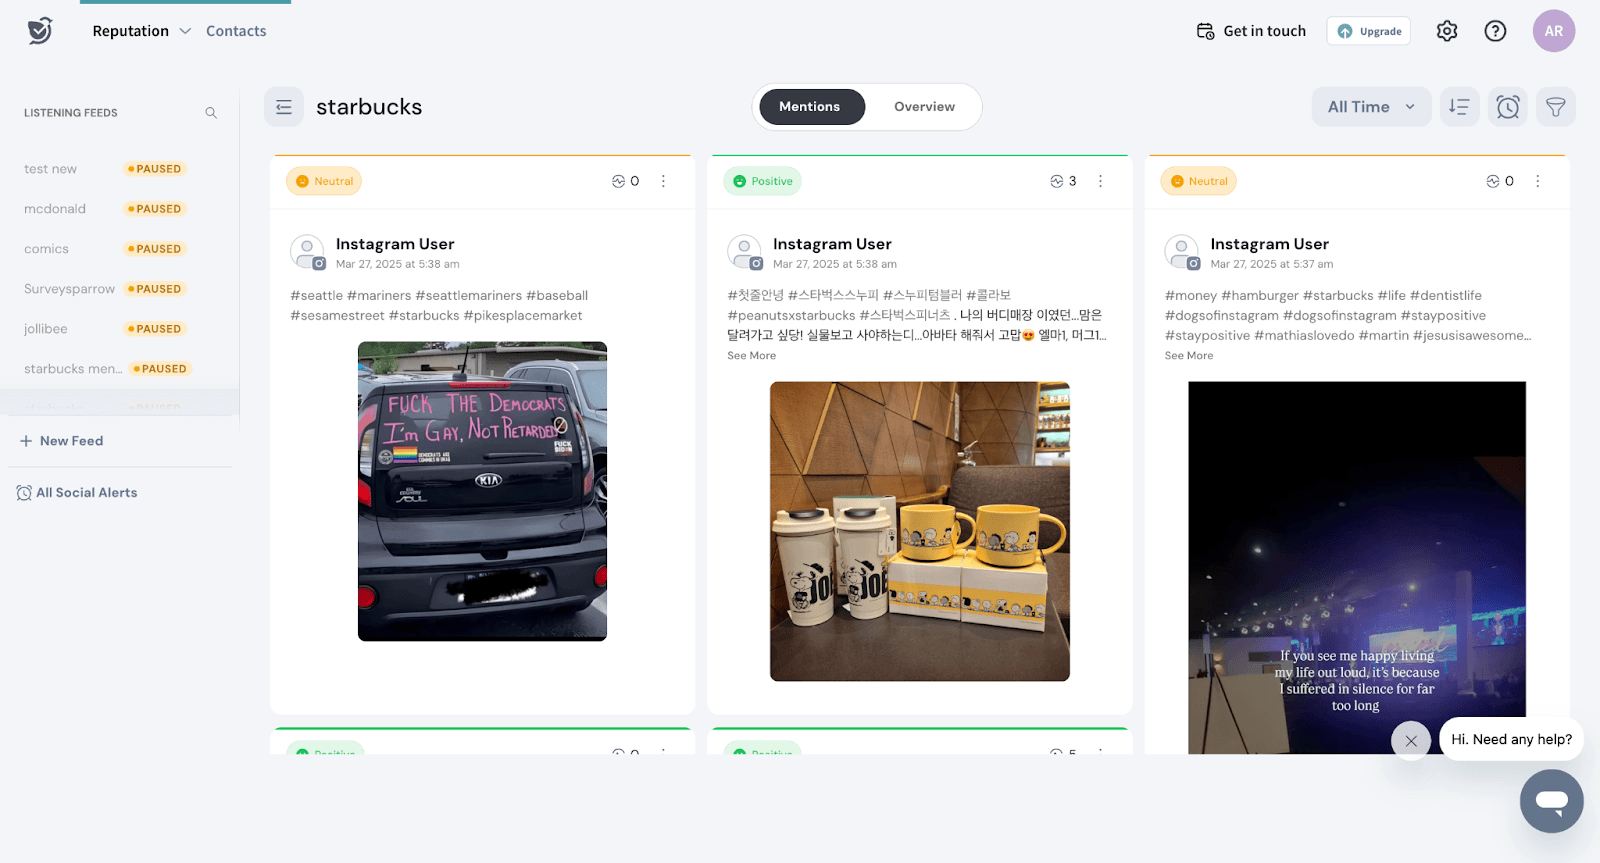
Upon clicking on a specific mention, you will be redirected to the particular post.
Interpreting the Social Listening Dashboard
The Overview Dashboard provides a snapshot of brand mentions and sentiment trends, helping you quickly understand audience perception.
Here’s what you’ll find on the dashboard:
- Mention Summary Cards – Displays total mentions with a breakdown of positive and negative mentions.
- Sentiment Distribution – A percentage breakdown of positive, negative, and neutral mentions.
- Mentions vs. Sentiments – Tracks mention volume and sentiment trends over time.
- Sentiment Spikes – Highlights sudden sentiment changes for key events.
- Daily Trend Heatmap – Shows when brand conversations peak across different times and days.
- Engagement Distribution – Analyzes how likes, comments, and shares contribute to mentions.
- Keyword Clusters – Groups top keywords with sentiment highlights to reveal conversation themes.
The dashboard helps you monitor trends, detect spikes, and gain actionable insights to refine your strategy.
In this section we will break down the dashboard into widgets and understand how to interpret.
- Navigate to Overview to view the dashboard.
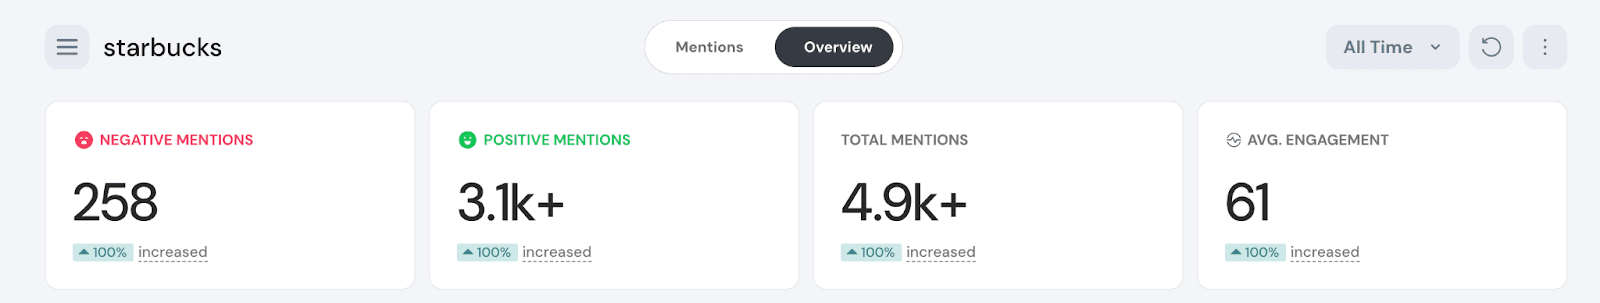
Mention Summary Cards
At the top of the dashboard we can see four main metrics.
- Negative Mentions
- Positive Mentions
- Total Mentions
- Avg. Engagements
Sentiment Distribution
Each card shows the total count for the current period chosen. At the bottom of each card, the percentage comparison with the previous period is also mentioned.
You can view trending hashtags by toggling the option at the top right of the widget. Click on a hashtag to see related posts.
Note:
- Red indicates negative mentions compared to the previous period
- Green indicates positive mentions compared to the previous period
- Yellow indicates neutral mentions compared to the previous period
You can also use AI to summarize the mentions by clicking on a particular key word. For a detailed explanation see the AI capabilities section.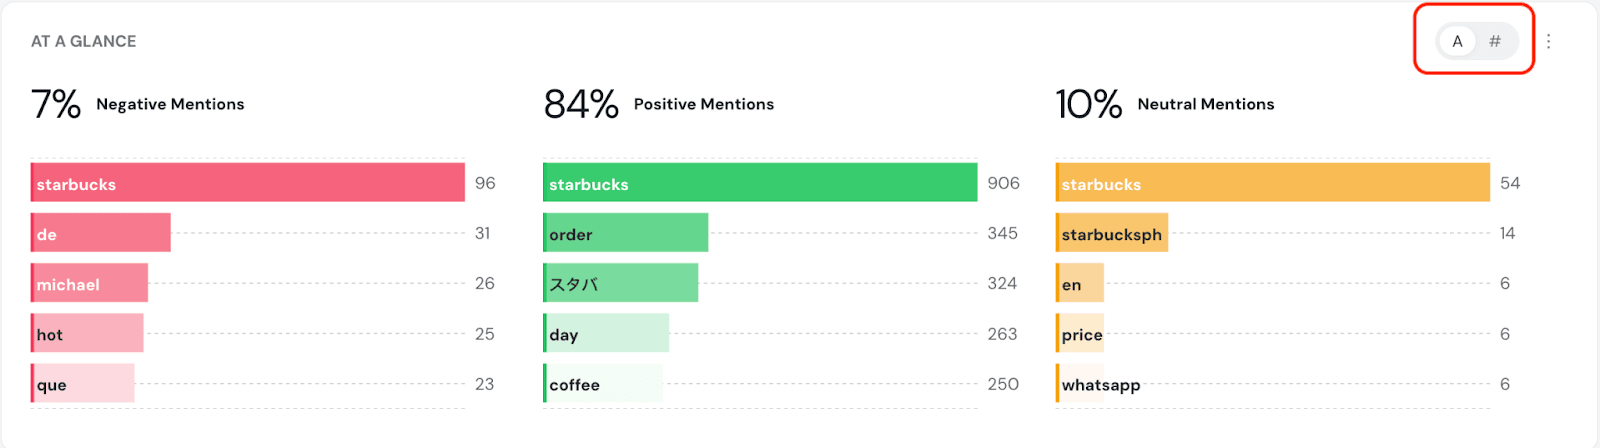
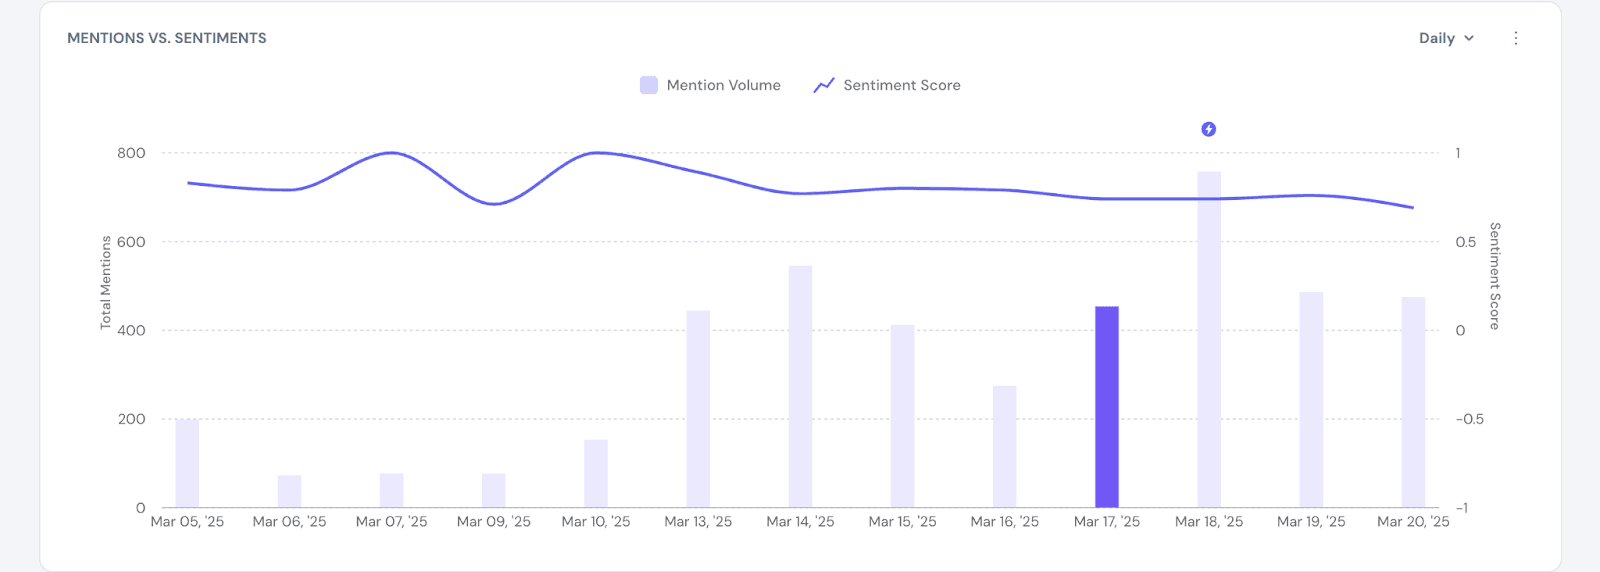
Mentions vs. Sentiments
You can observe how mention volume (bar chart) and sentiment score (line graph) change over months to identify patterns in brand perception.
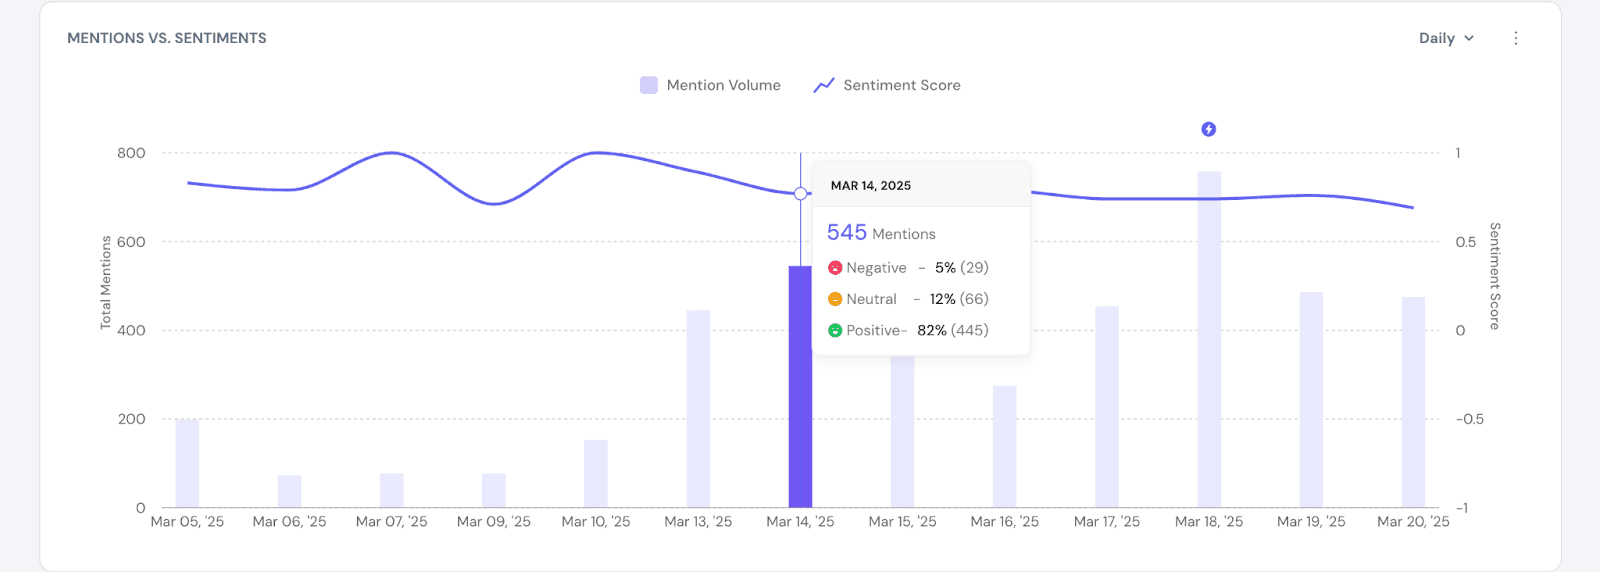
Note: Hover over any data point to see the exact number of mentions and a breakdown of sentiment ( positive, negative, neutral) with percentages and counts.
Click on the lightning icon to view key insights to understand what’s driving conversations.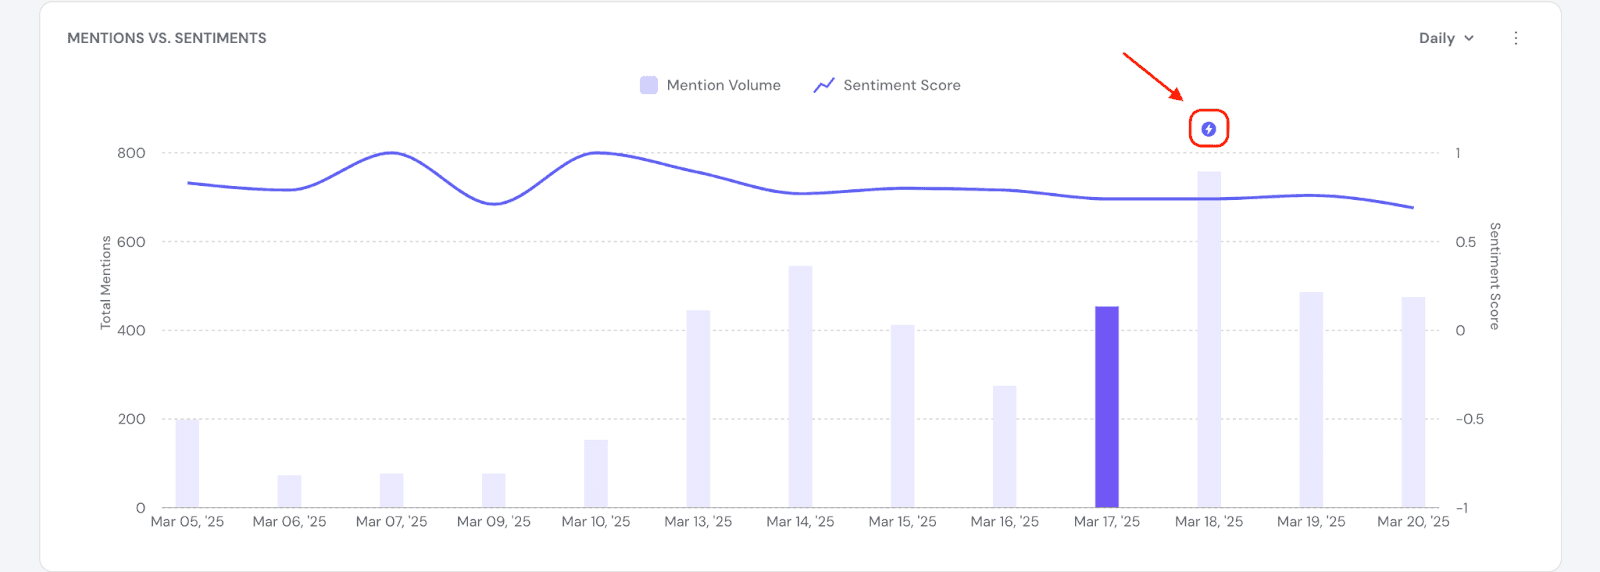
You can see:
- Total Mentions – Number of mentions during the spike.
- Sentiment Distribution – Breakdown of positive, neutral, and negative sentiment.
- Top-Used Hashtags – Trending hashtags linked to the spike.
To further deep dive, click on ‘View Insights’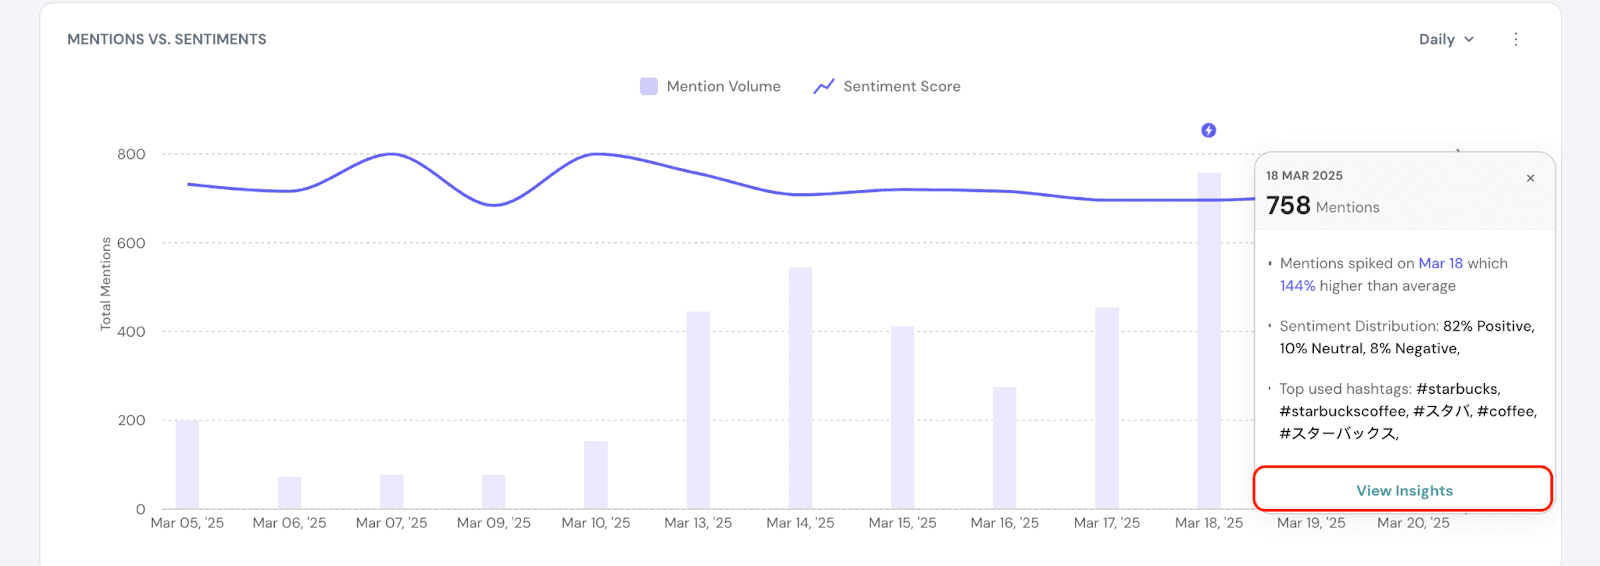
Under View Insights, you can see the following:
Sentiment Distribution:
View a horizontal bar chart showing sentiment percentages (e.g., 7.92% negative, 10.29% neutral,81.53% positive).
Top Keywords:
Identify frequently mentioned keywords (e.g., "Starbucks," "Coffee," "Available").
Note: You can click on a keyword to view related posts and understand its context.
2.3 Top Hashtags
Review a table of hashtags with columns for:
- Hashtag (e.g., "#starbucks", "#coffee").
- Mentions Count (e.g., 147 for "#starbuckscoffee").
- Total Engagements (e.g., 25,980 for "#starbucks").
This helps you quickly analyze brand perception and trending discussions.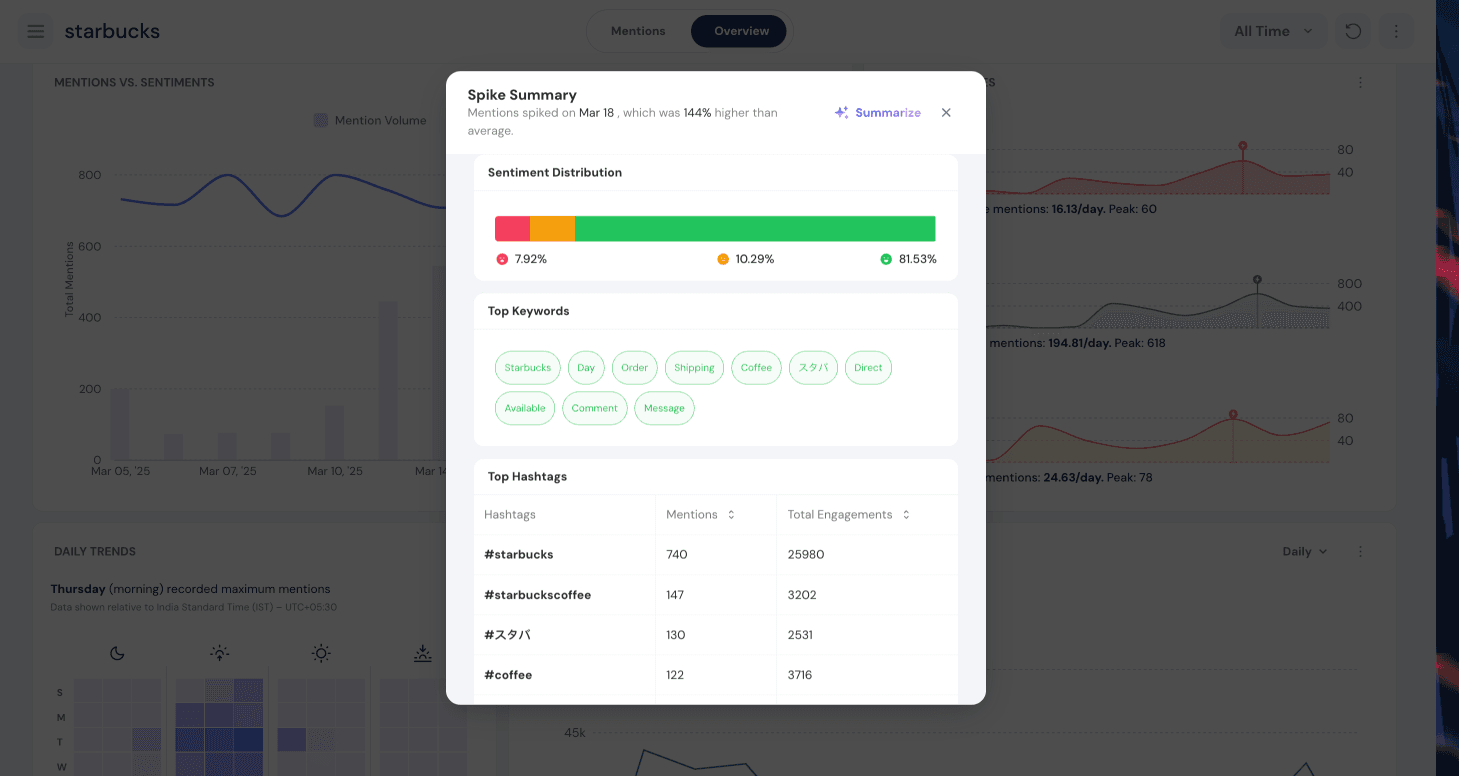
Sentiment Spikes
You can get an overview of the sentiments.
See the total count of negative (258), positive (3,117), and neutral (394) mentions at a glance.
Analyze Daily Averages and Peaks for each sentiment:
- Negative – Avg: 16.13/day, Peak: 60
- Positive – Avg: 194.81/day, Peak: 618
- Neutral – Avg: 24.63/day, Peak: 78
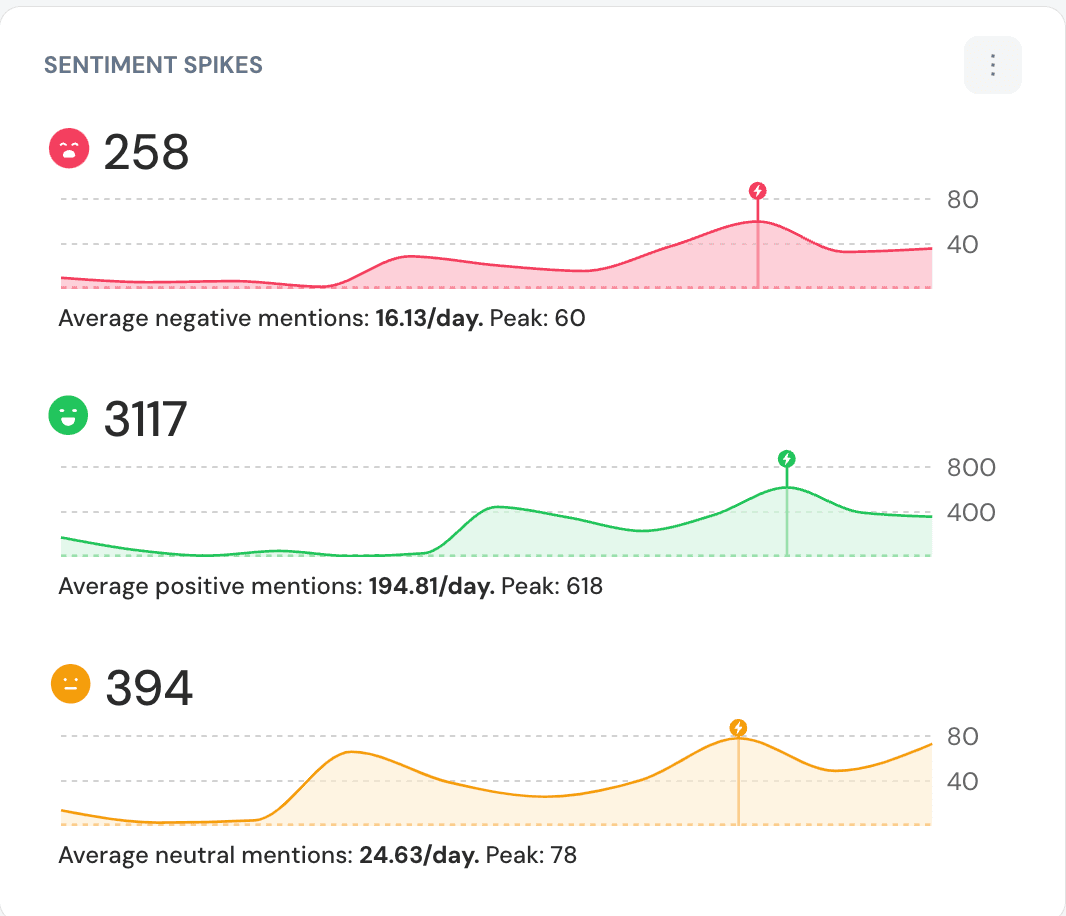
Focus on Spikes
- Highlighted spikes (marked with a lightning bolt icon) indicate significant changes in sentiment volume, helping users identify key events impacting brand perception.
Interpret Sentiment Trends
- Analyze the line graph trends (red for negative, green for positive, yellow for neutral) to spot sentiment spikes and shifts over time.
Identify when mentions peak during the week, such as Thursday mornings/evenings.
Daily Trend Heatmap
The heatmap shows mentions by day (rows) and time periods (columns: midnight, morning, afternoon, evening).
Darker shades indicate higher mention volumes, making it easy to spot activity spikes. You can hover on the widget to get details of the time and the number of mentions.
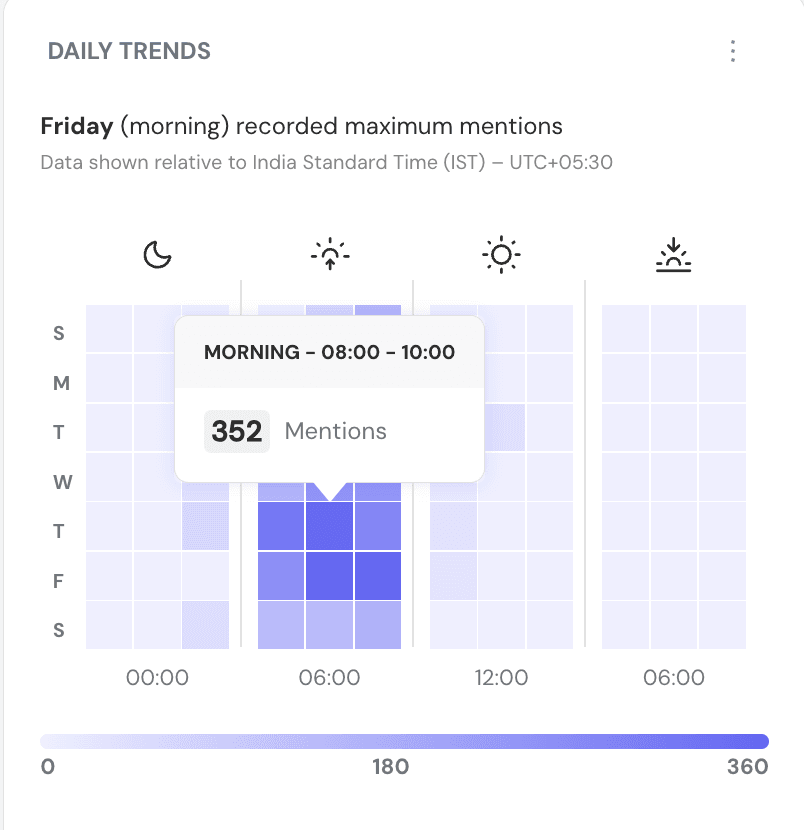
Note that data is shown in your current timezone (e.g., India Standard Time (IST) – UTC+05:30), ensuring accurate interpretation based on location.
Use the color intensity scale at the bottom to gauge the volume of mentions for each time slot.
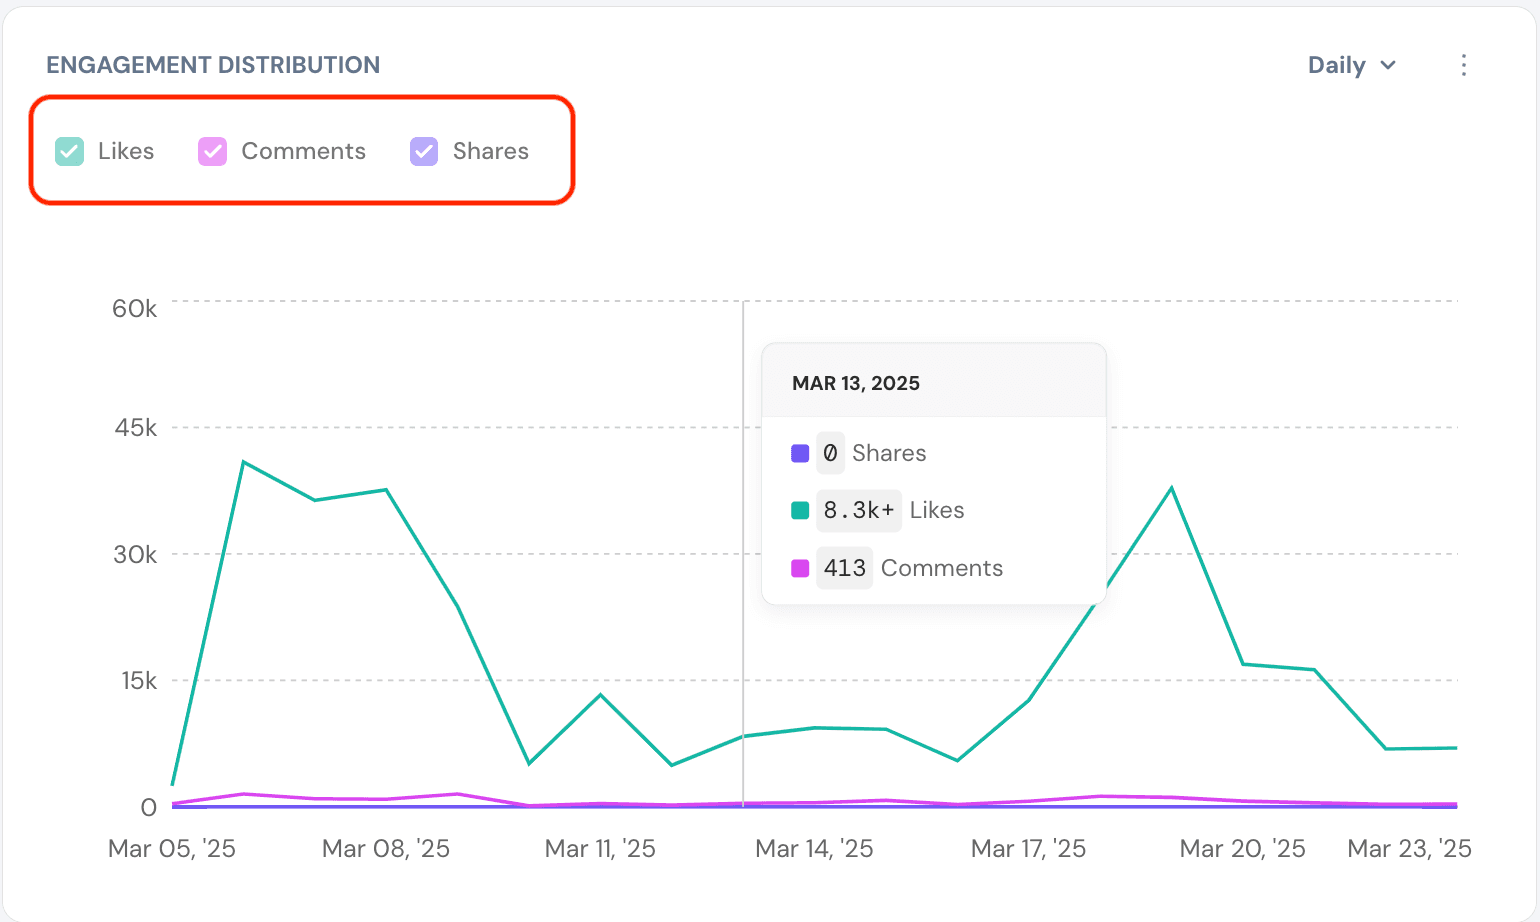
Engagement Distribution
Track how engagement changes month by month, identify patterns and peaks and also analyze how likes, comments, and shares contribute to total mentions over time.
You can hover on the graph to see the number of shares, likes and comments.
Note: Use the checkboxes in the legend (e.g., "Likes," "Comments," "Shares") to show or hide specific engagement types in the graph.
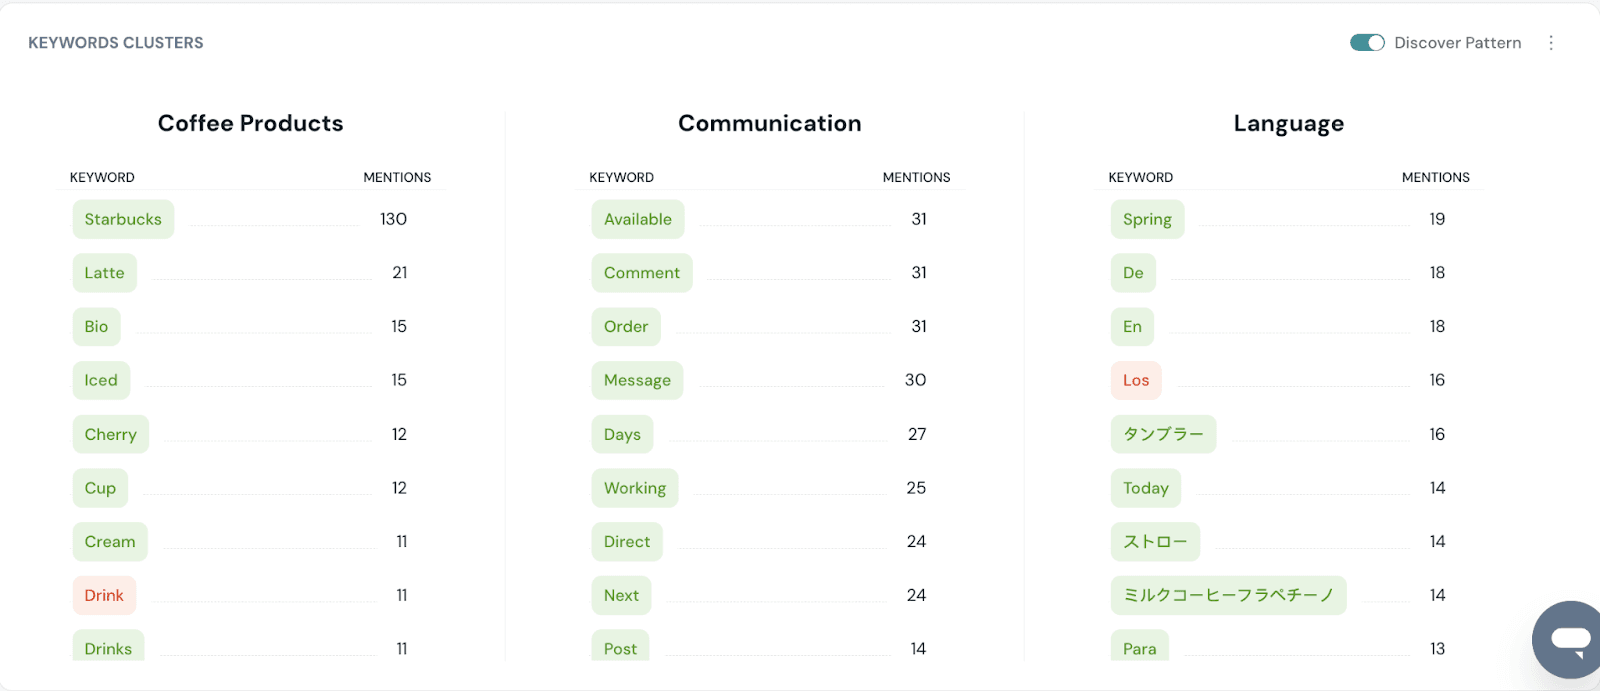
Keyword Clusters
By default, top keywords are displayed with colors indicating sentiment.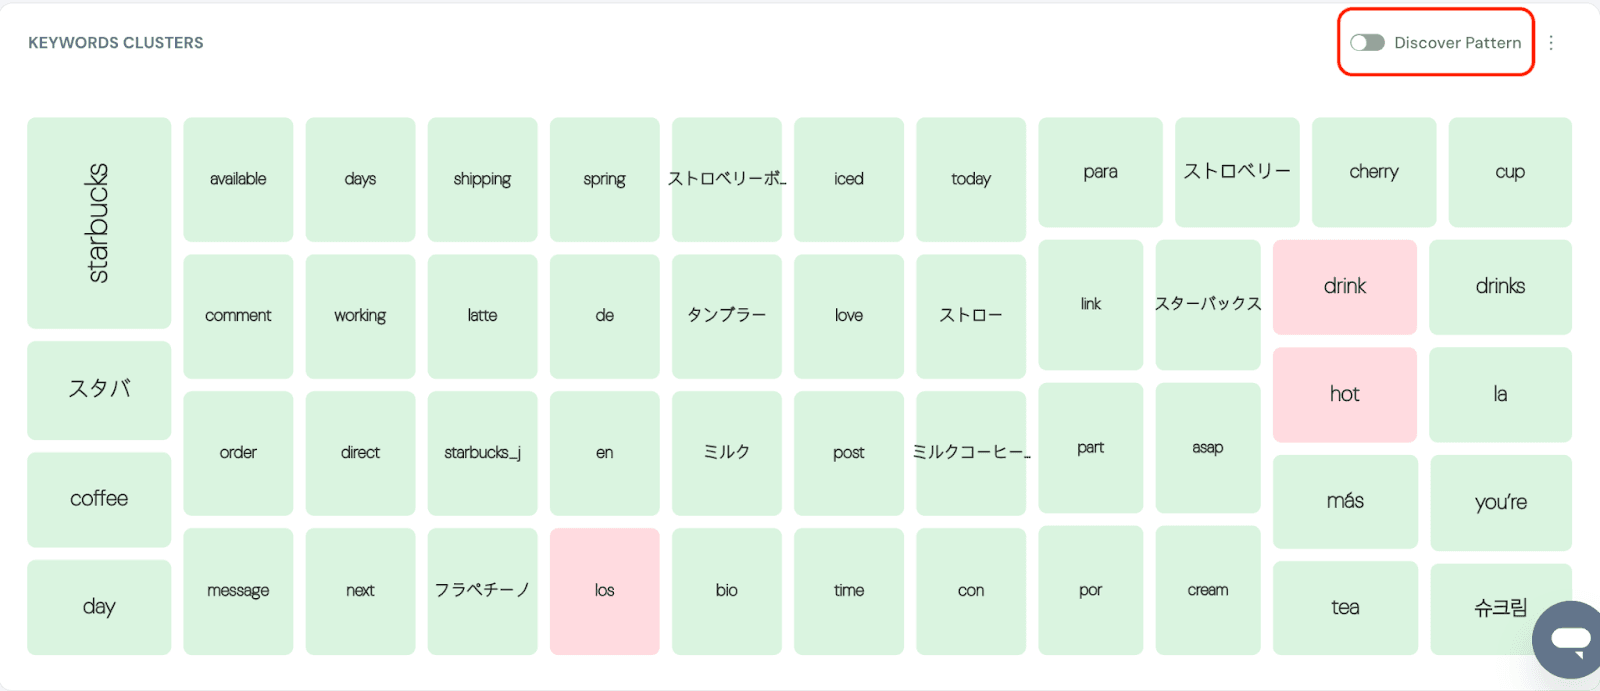
Clicking on ‘Discover Patterns’ toggle will generate the top 3 topic clusters, grouping related keywords into buckets for deeper insights.
AI Capabilities in Overview dashboard
At a Glance
You can click on a particular keyword, and summarise the mentions with AI.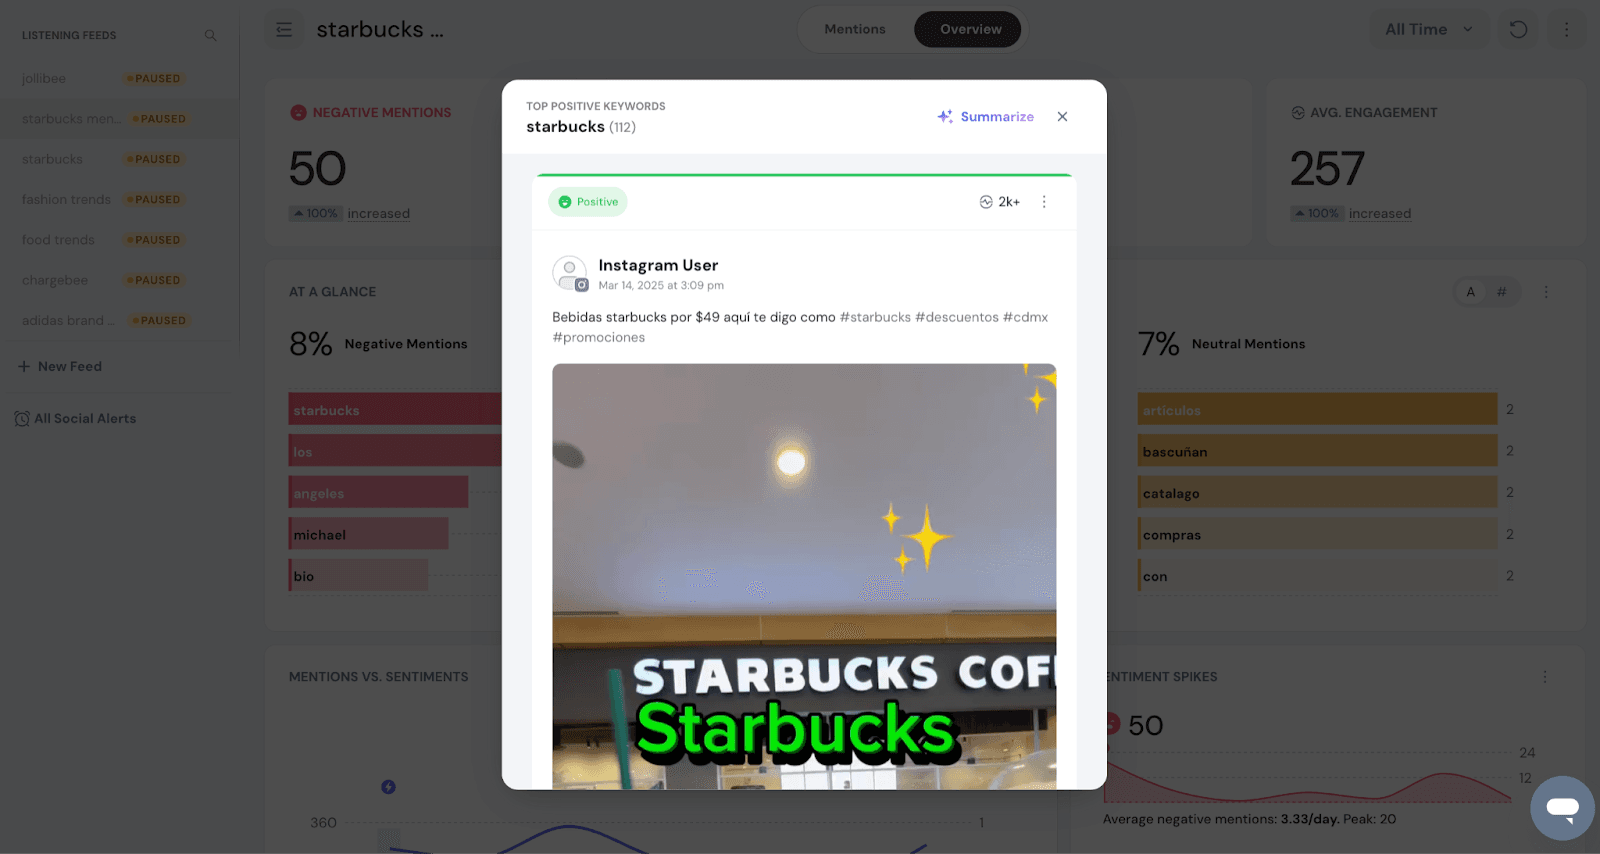
Mentions and Sentiments
You can use AI to summarize the mentions spiked on the particular day and get actionable insights from the mentions. 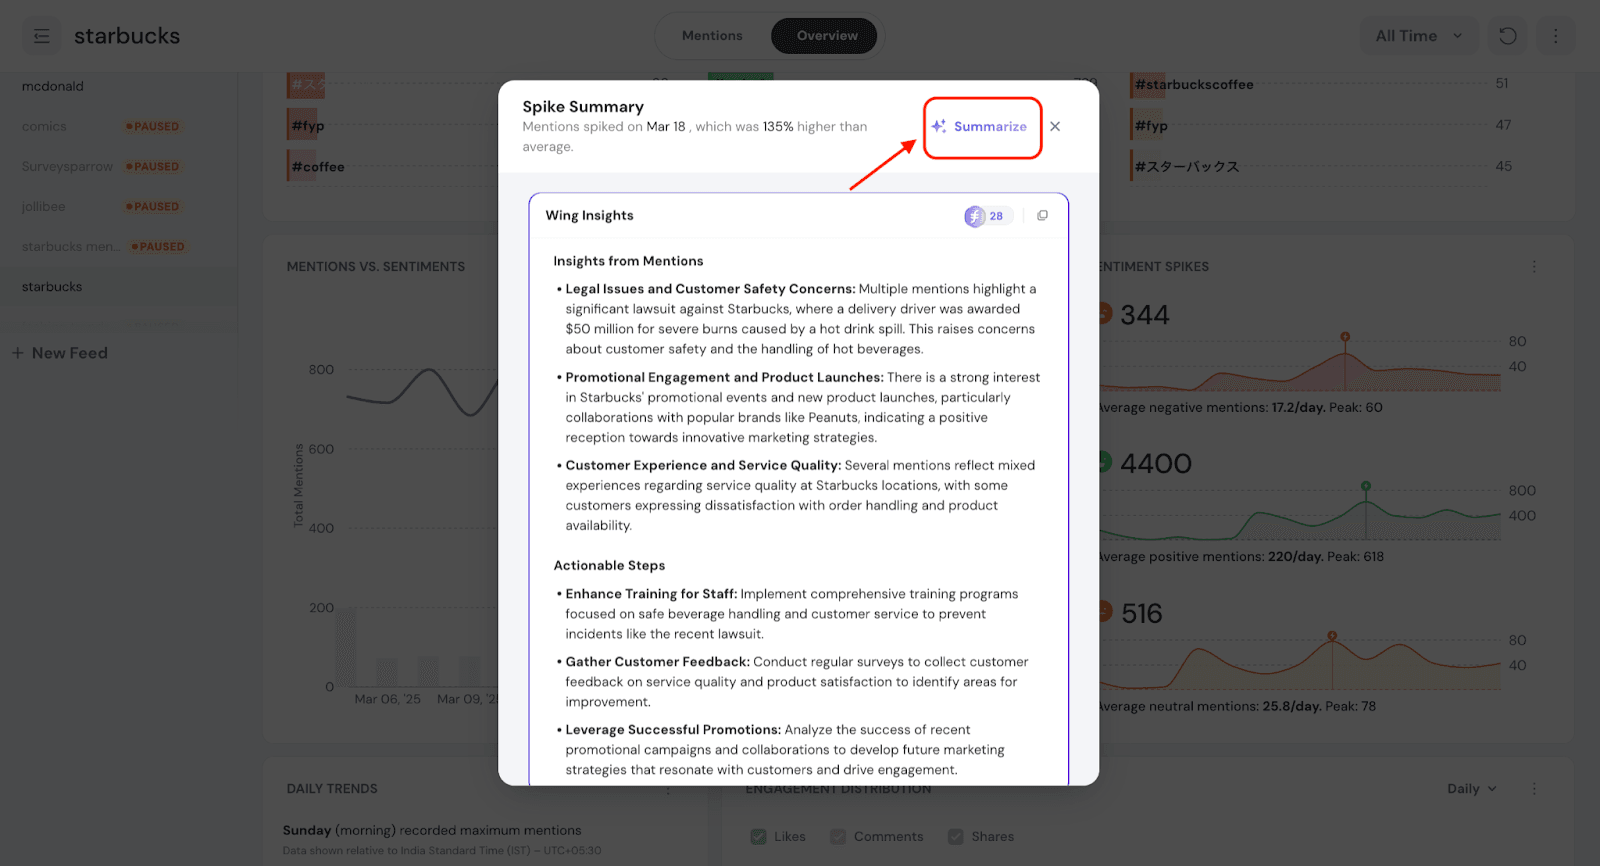
Sentiment spikes
You can use AI for each sentiment to analyse the mentions spiked on the particular day. 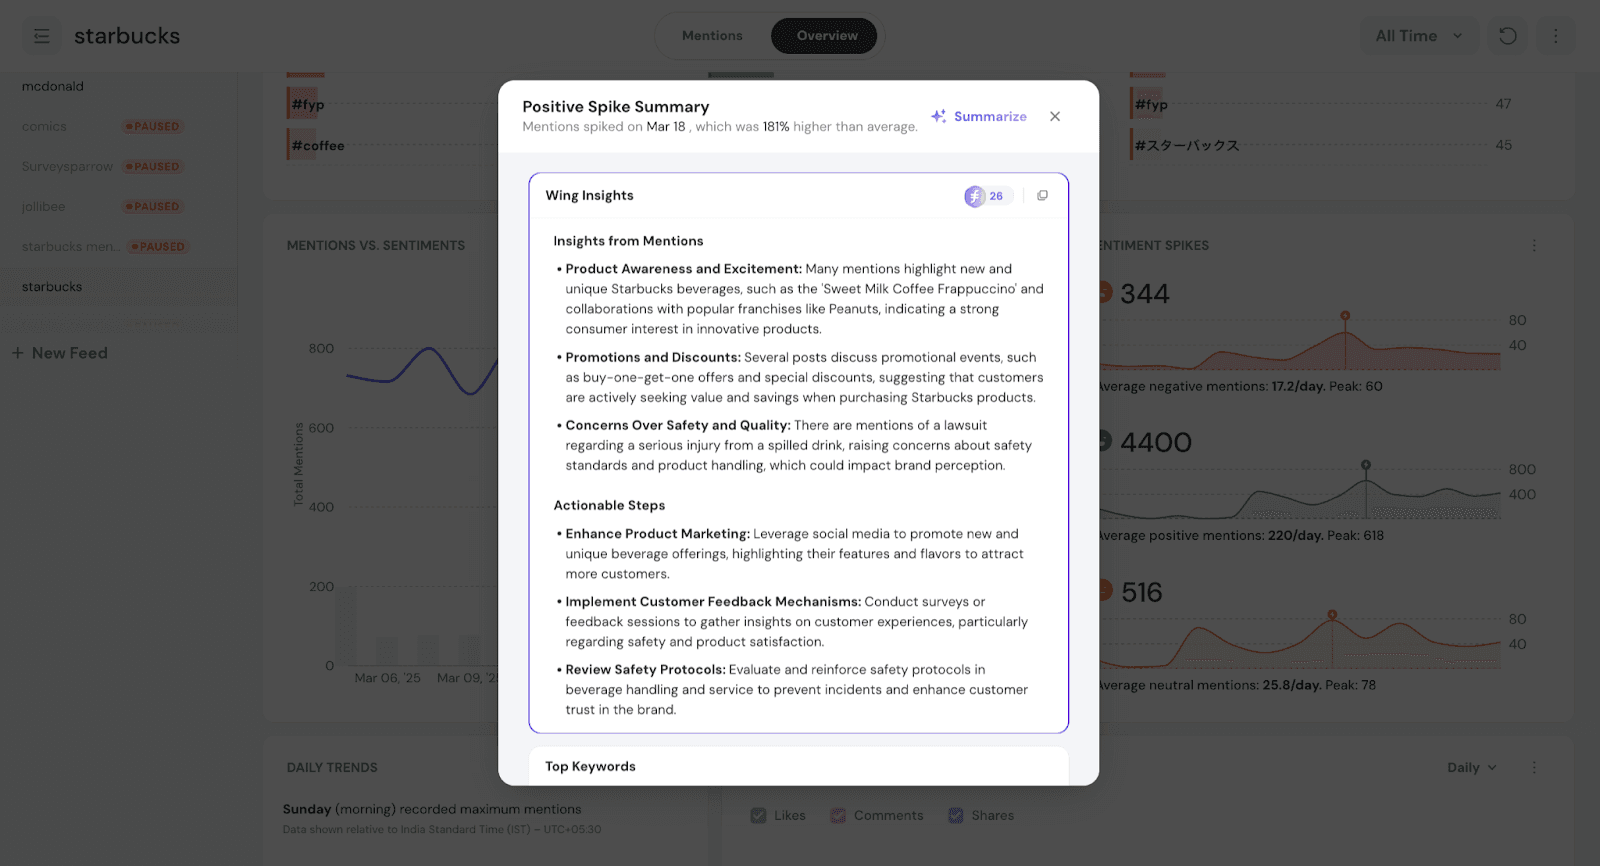
Keyword Clusters
You can click on a particular keyword, and summarise the mentions with AI.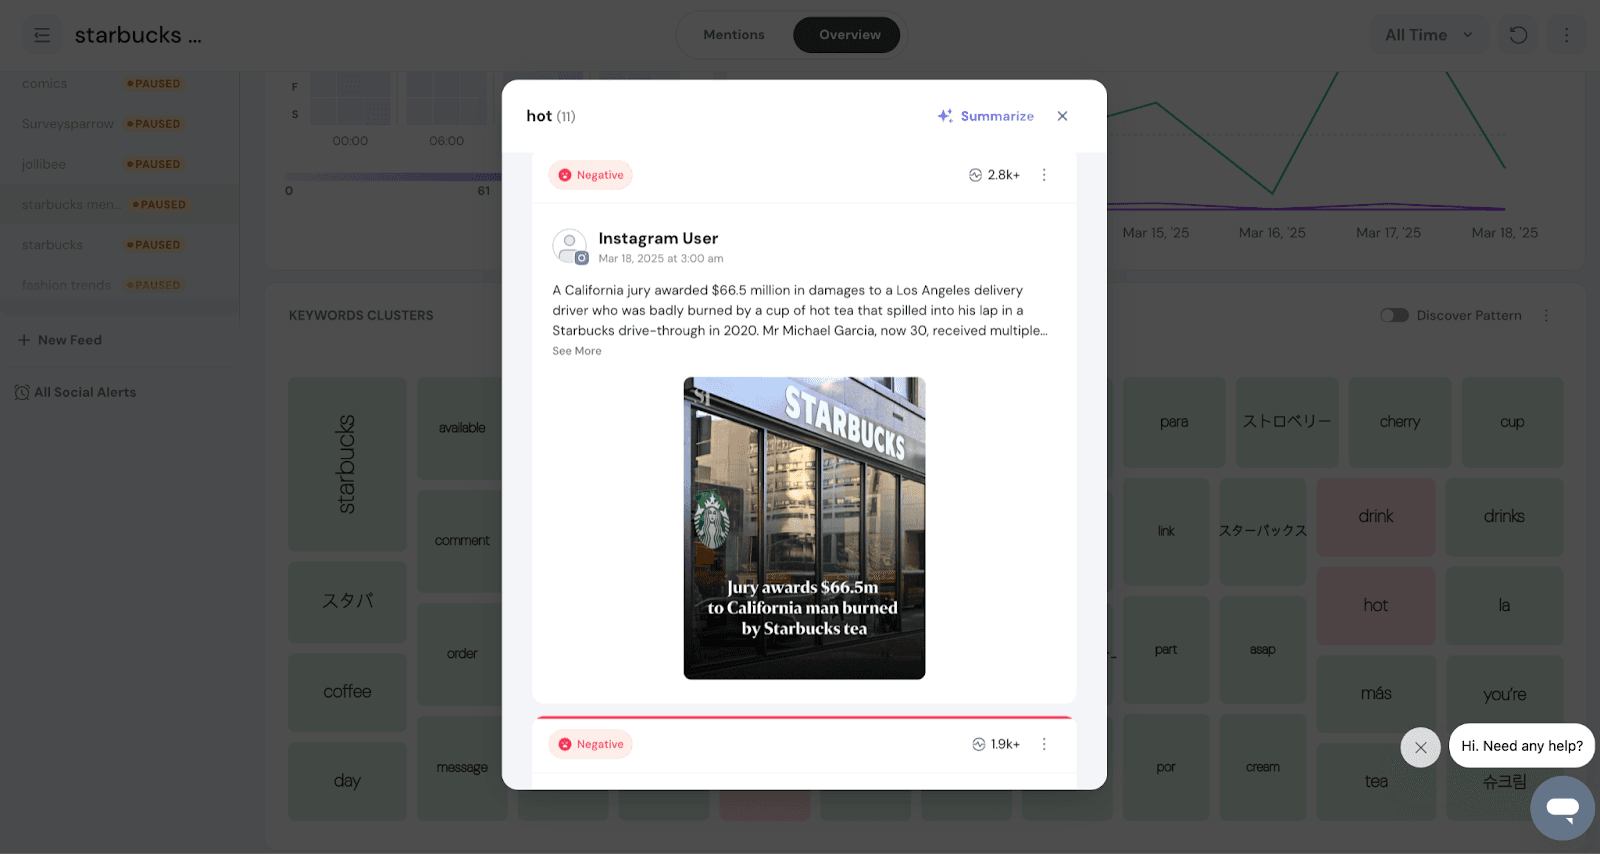
That's all about Social Listening. Hope you found it insightful.
Please feel free to reach out to us in case of questions.
Feel free to reach out to our community if you have questions.