
Search
For any thriving business, Key Performance Indicator(KPI) metrics provide a crystal-clear snapshot of performance and progress. KPI charts enable you to keep a close eye on these critical metrics on a centralized dashboard, making it easier for businesses to comprehend overall feedback data.
Now, let’s see how to add a KPI widget to your dashboard.
1. Under Insights, click Dashboards.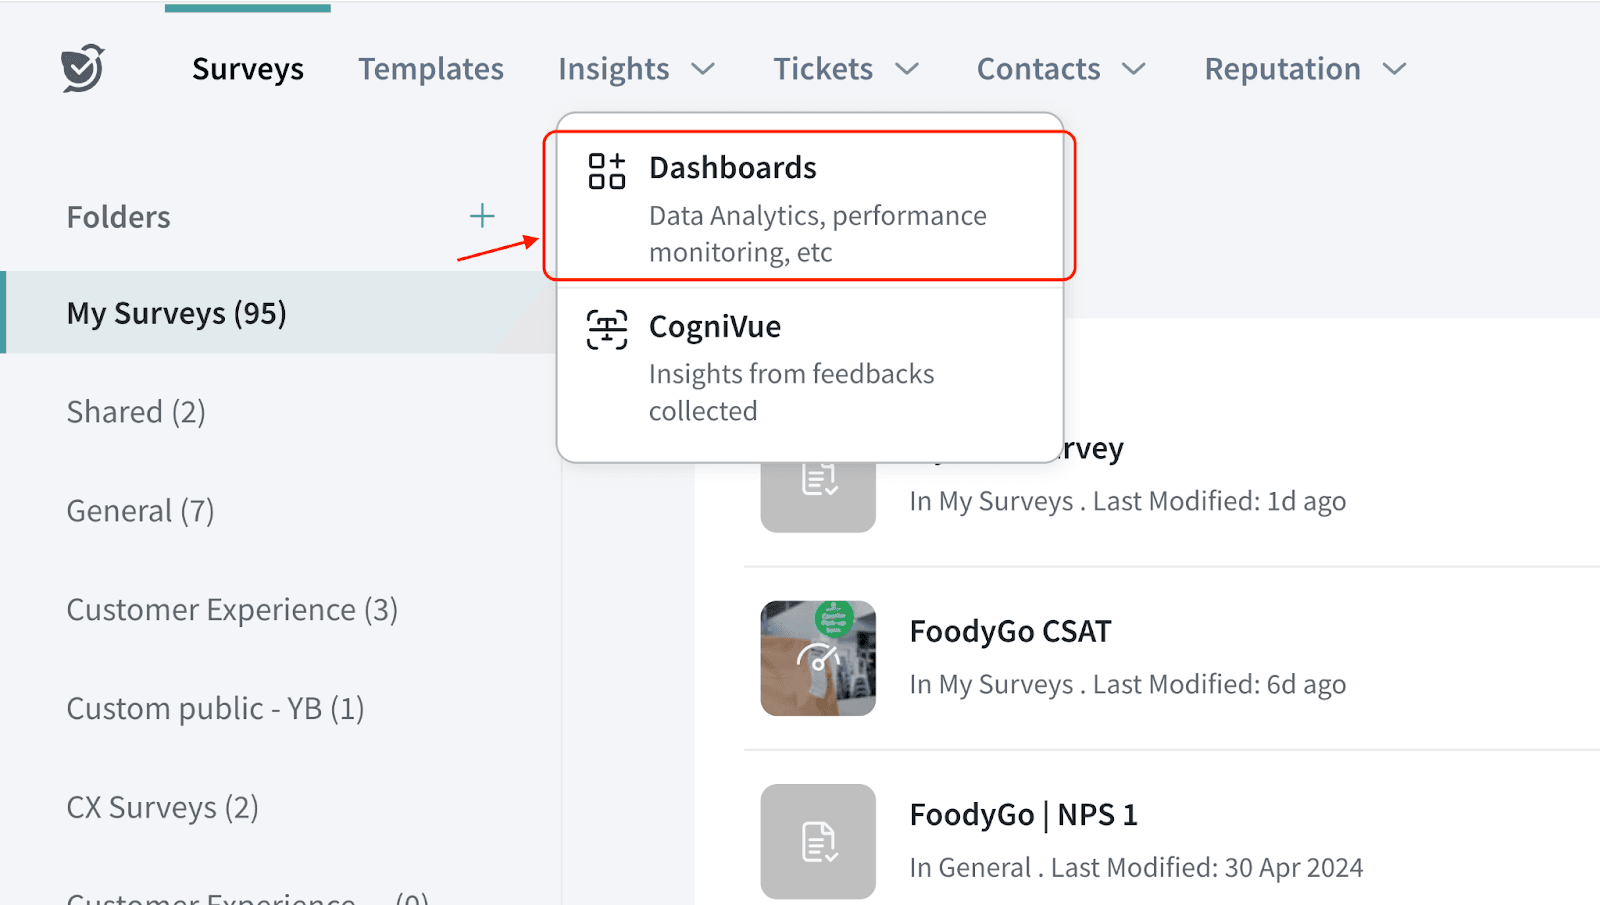
2. Click New Widget.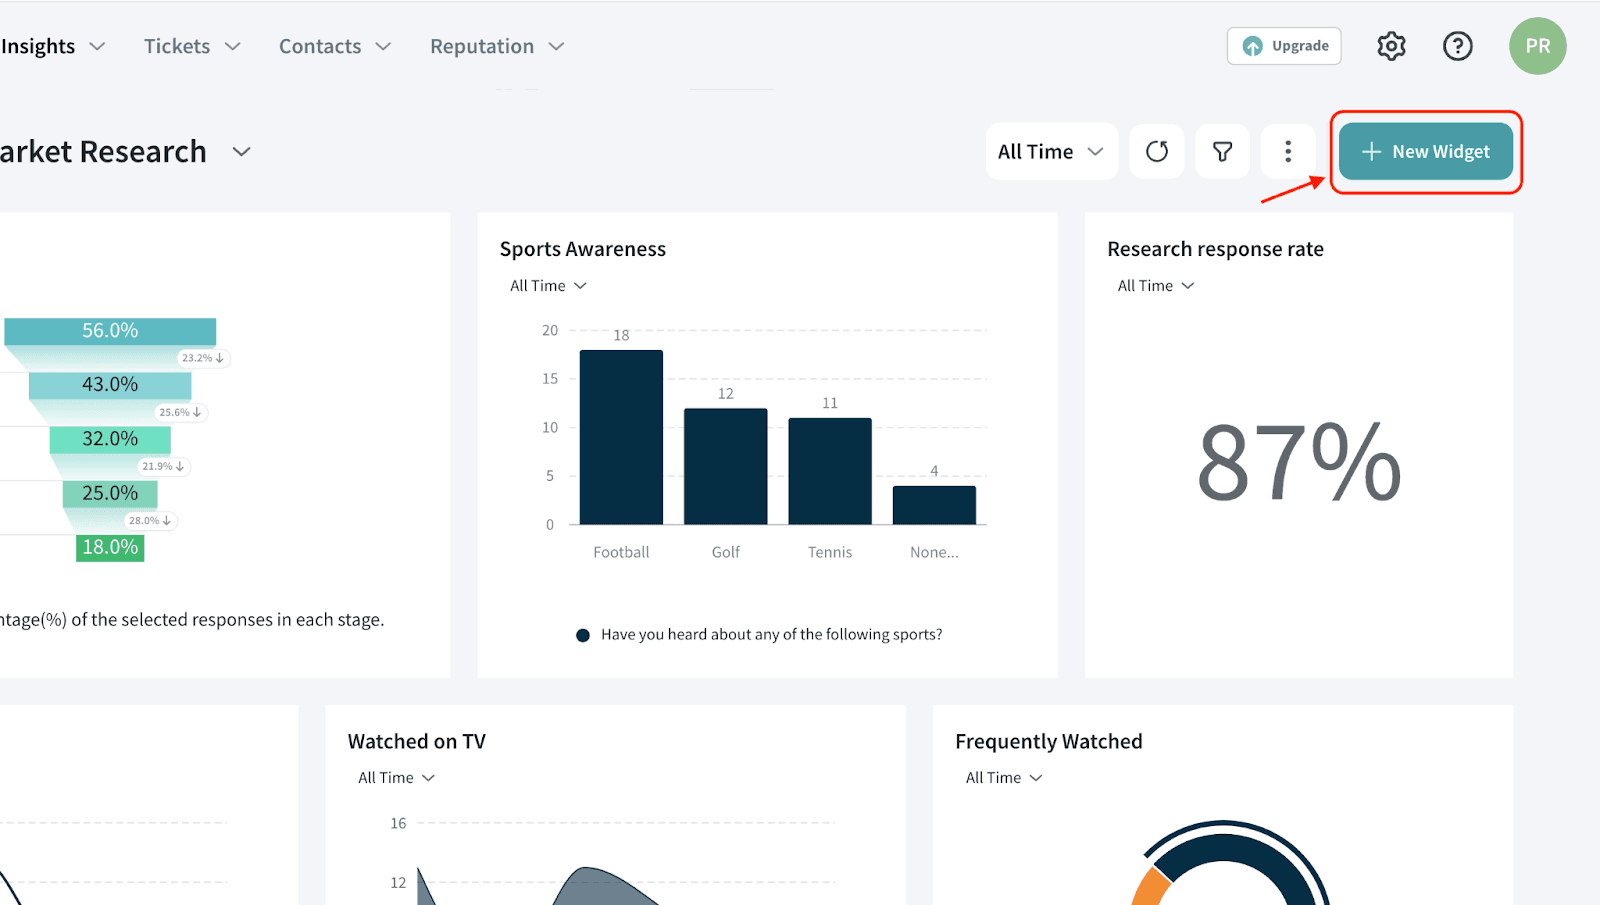
3. Select By Chart Type.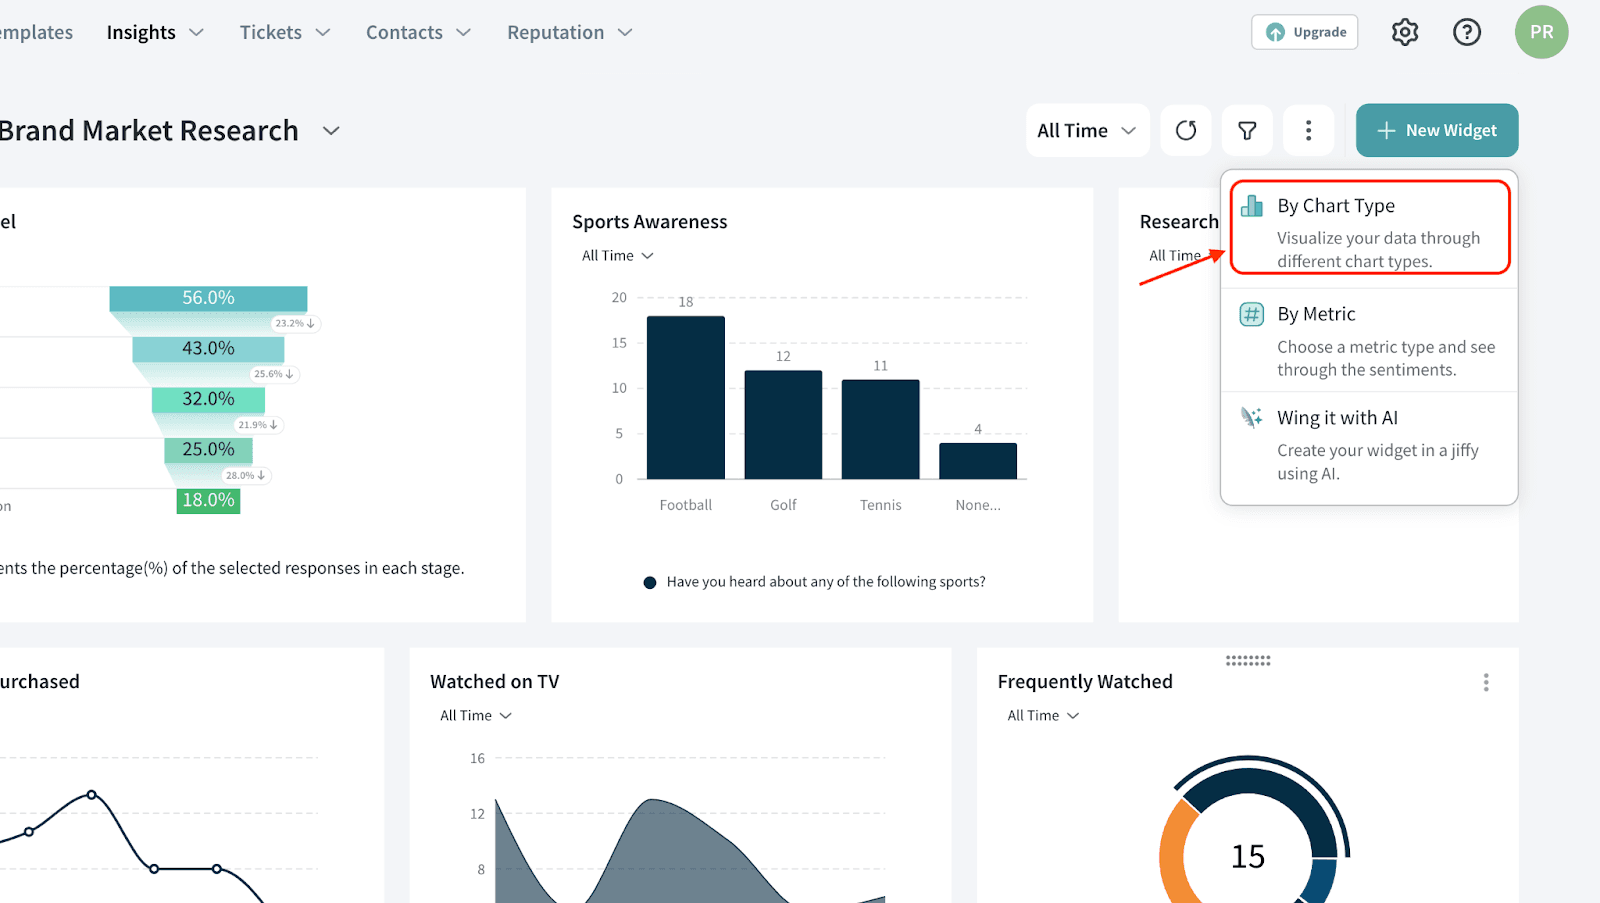
4. Click KPI Chart.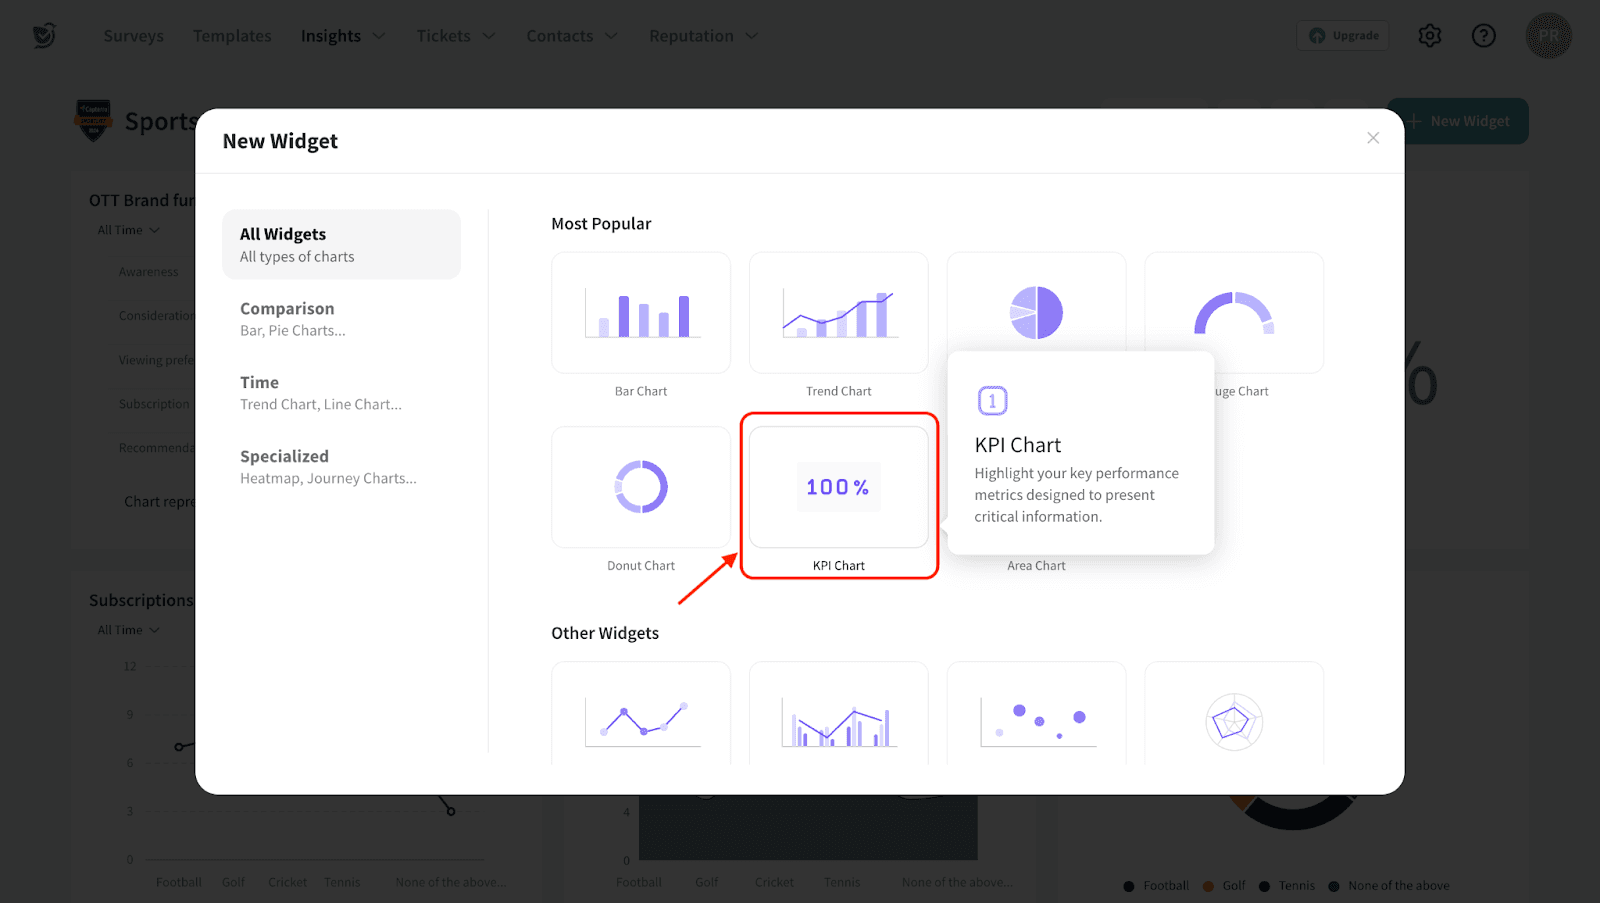
5. Select the metric that you’d like to monitor. You can choose from Source metrics, Question metrics and Custom metrics.
Source metrics represent the performance of a survey. You can choose from the following:
Question metrics denote the metrics calculated from the associated question from a survey. Following are the ready-to-use metrics:
Custom metrics are the ones specific to your business needs that you would have created for your account.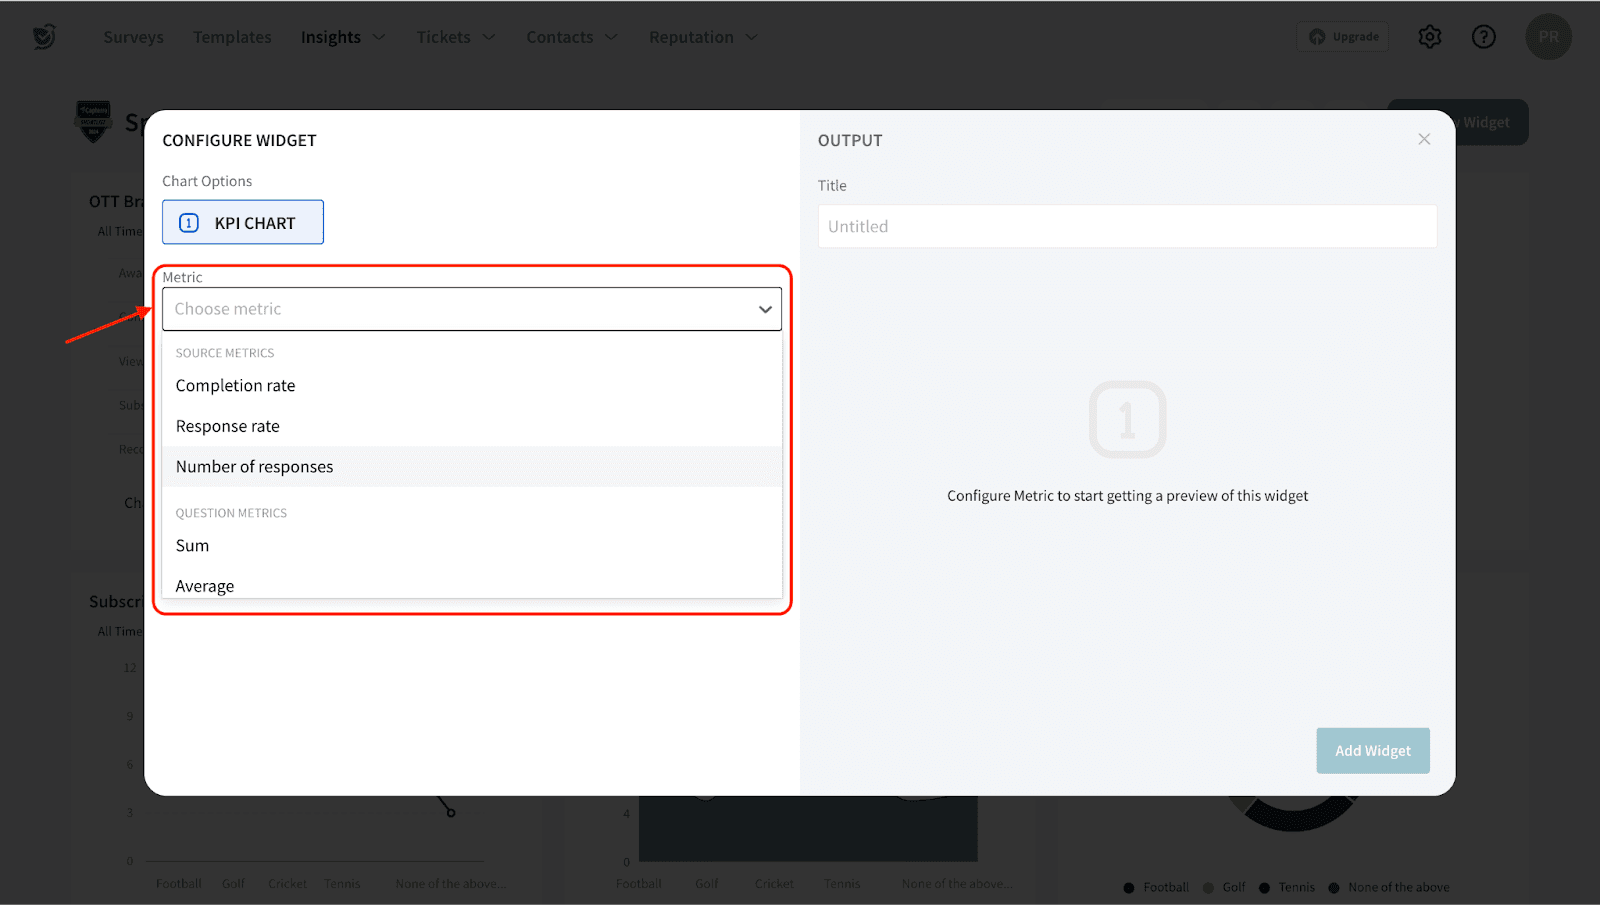
6. Select the survey from which you want to get the corresponding metric.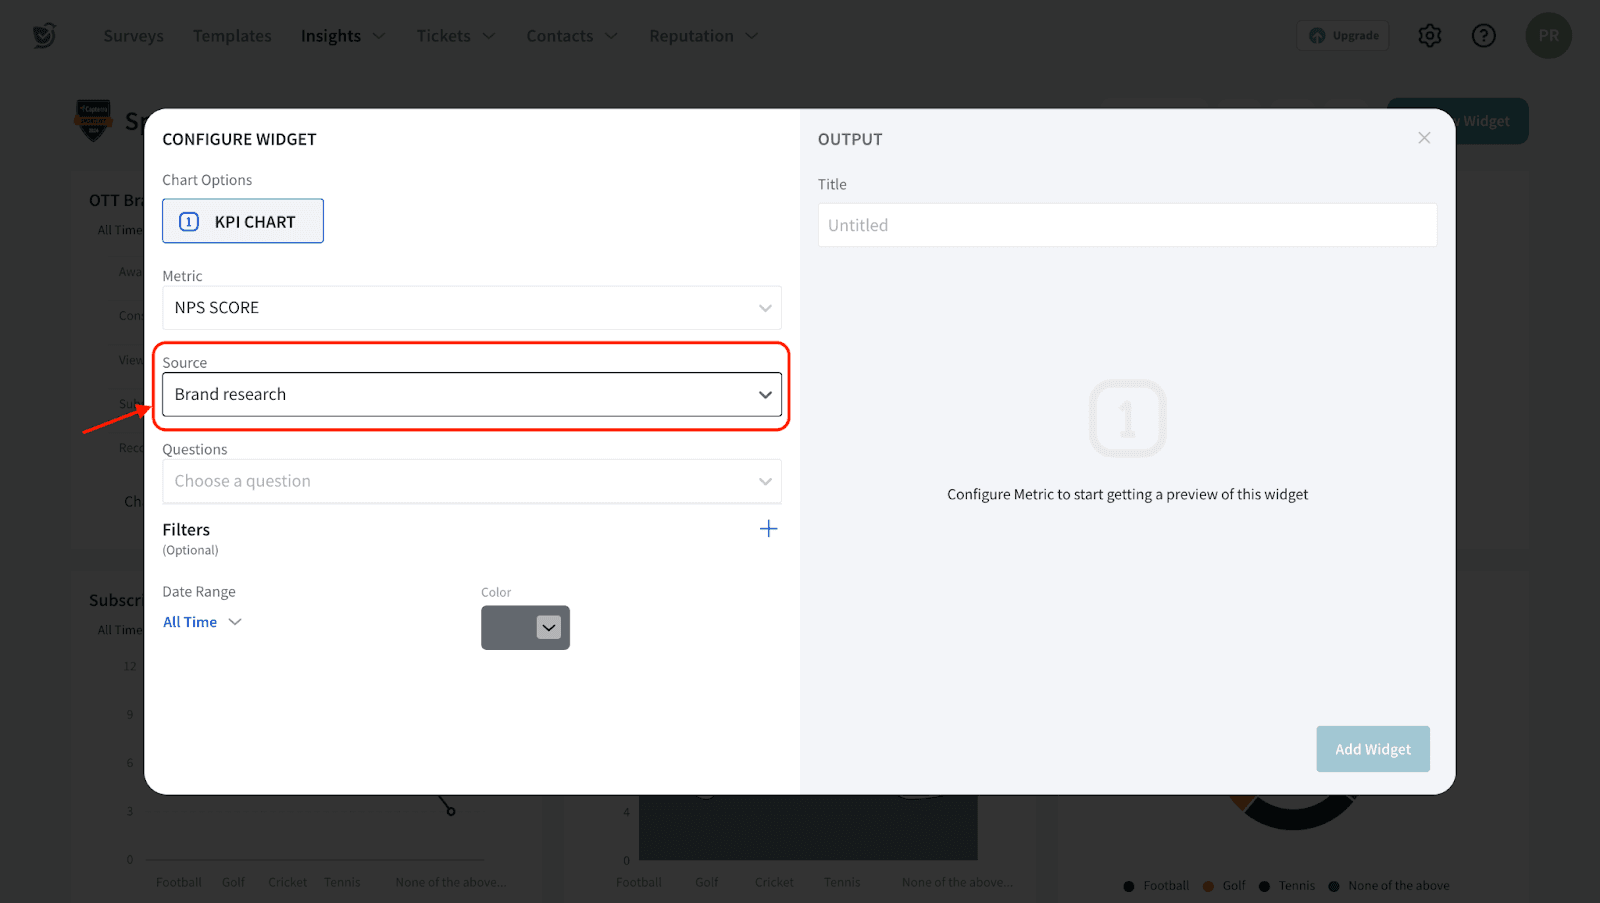
7. Choose the corresponding question to fetch the metric.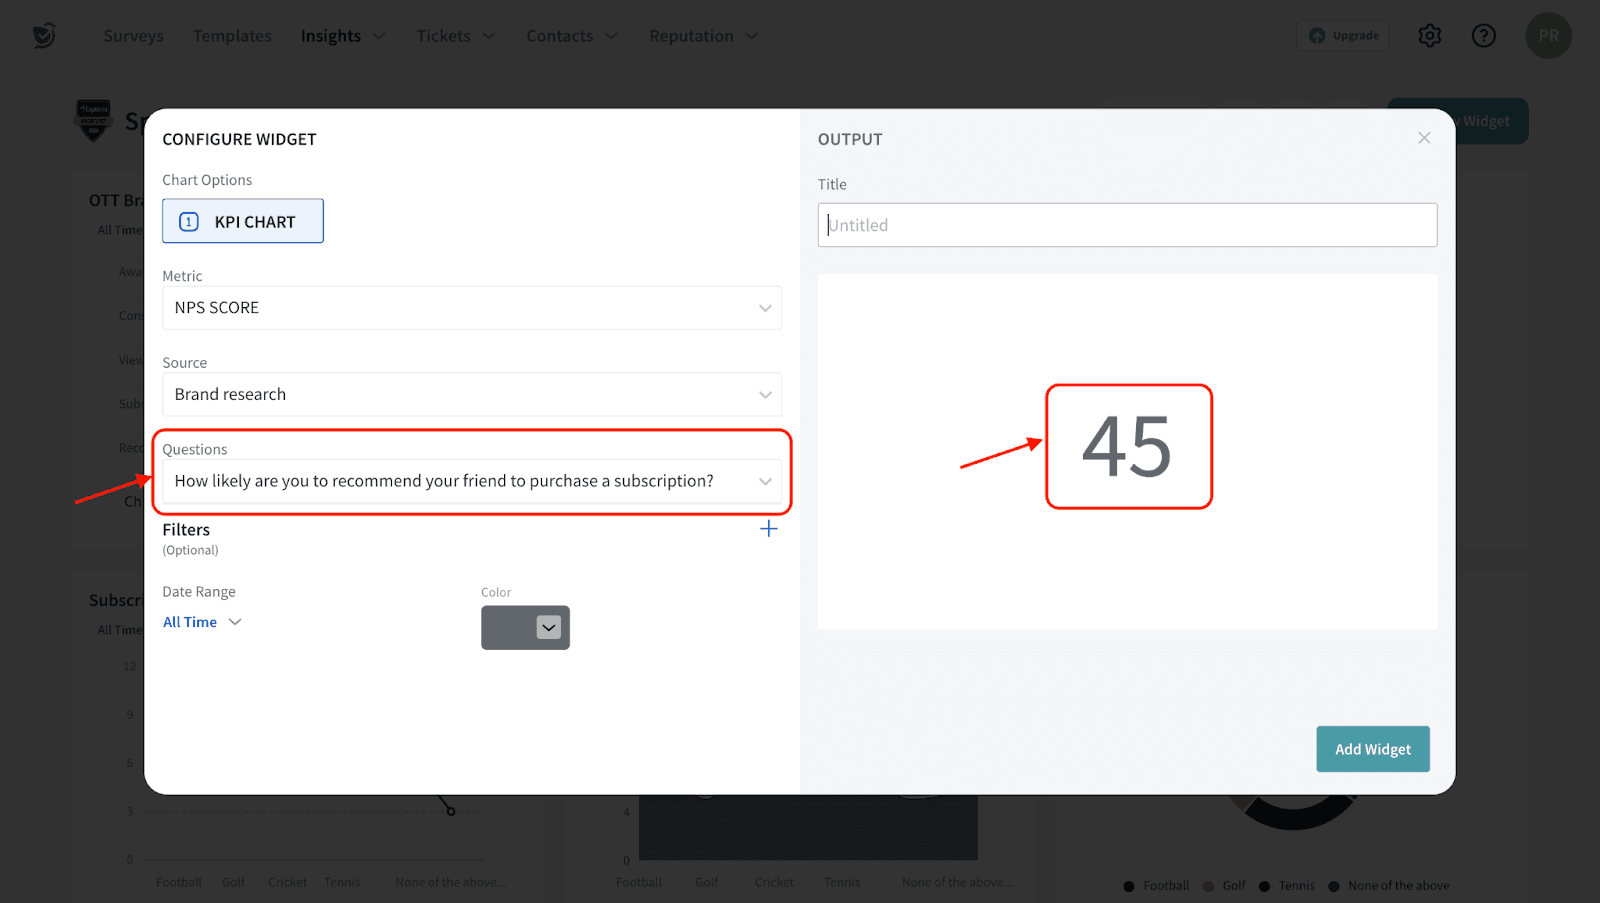
8. You can choose to apply filters to make the metric more relevant.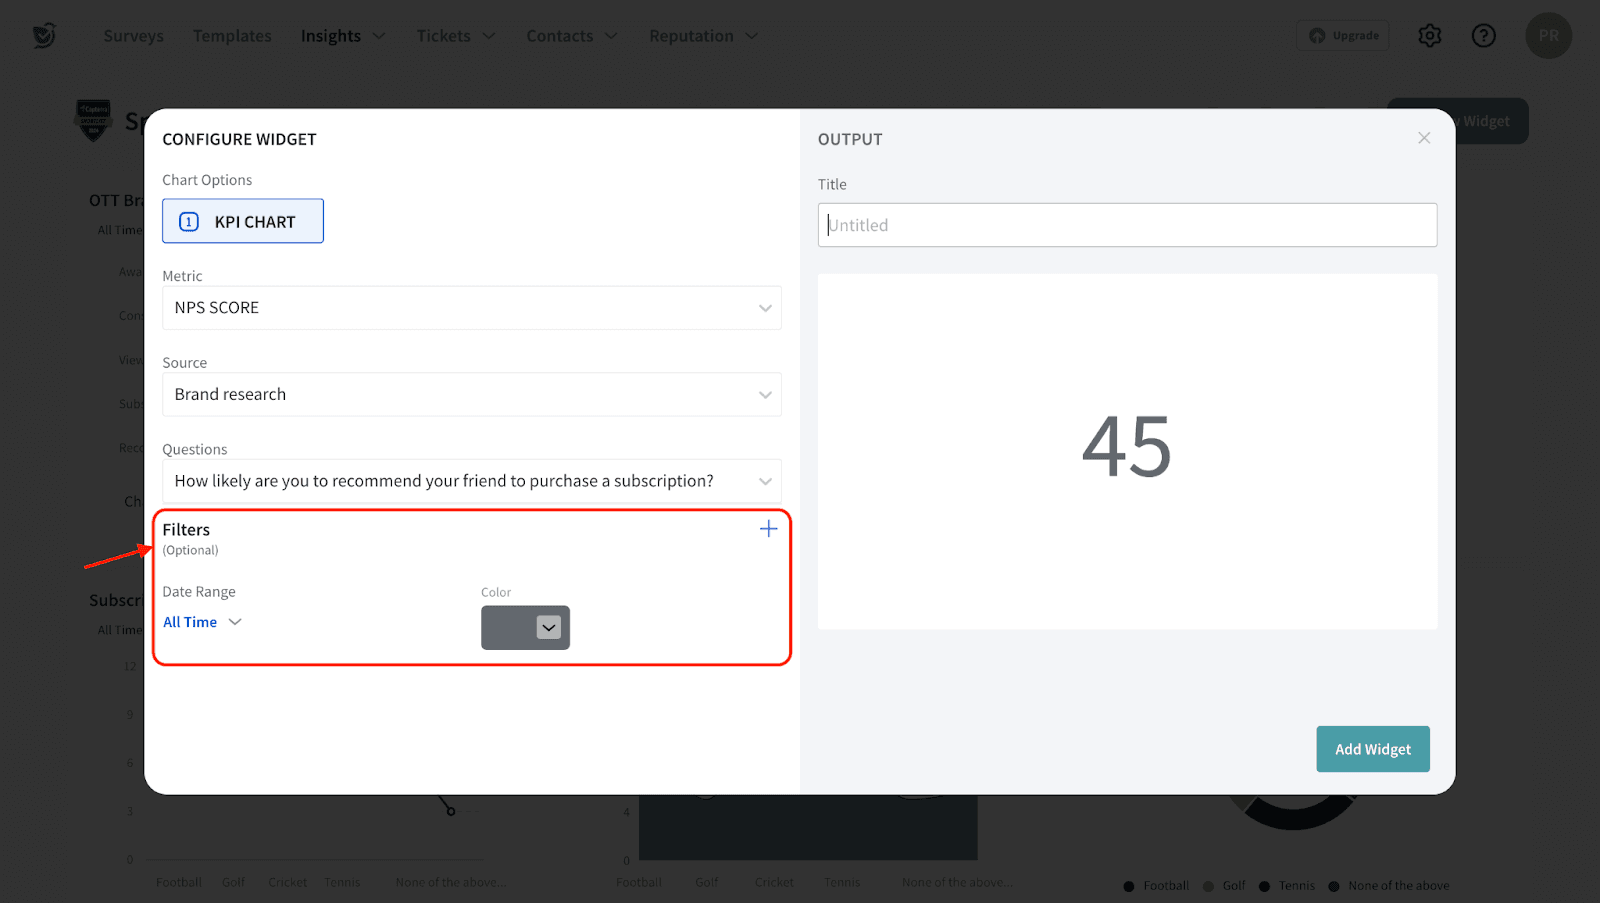
9. Enter the widget title for your reference.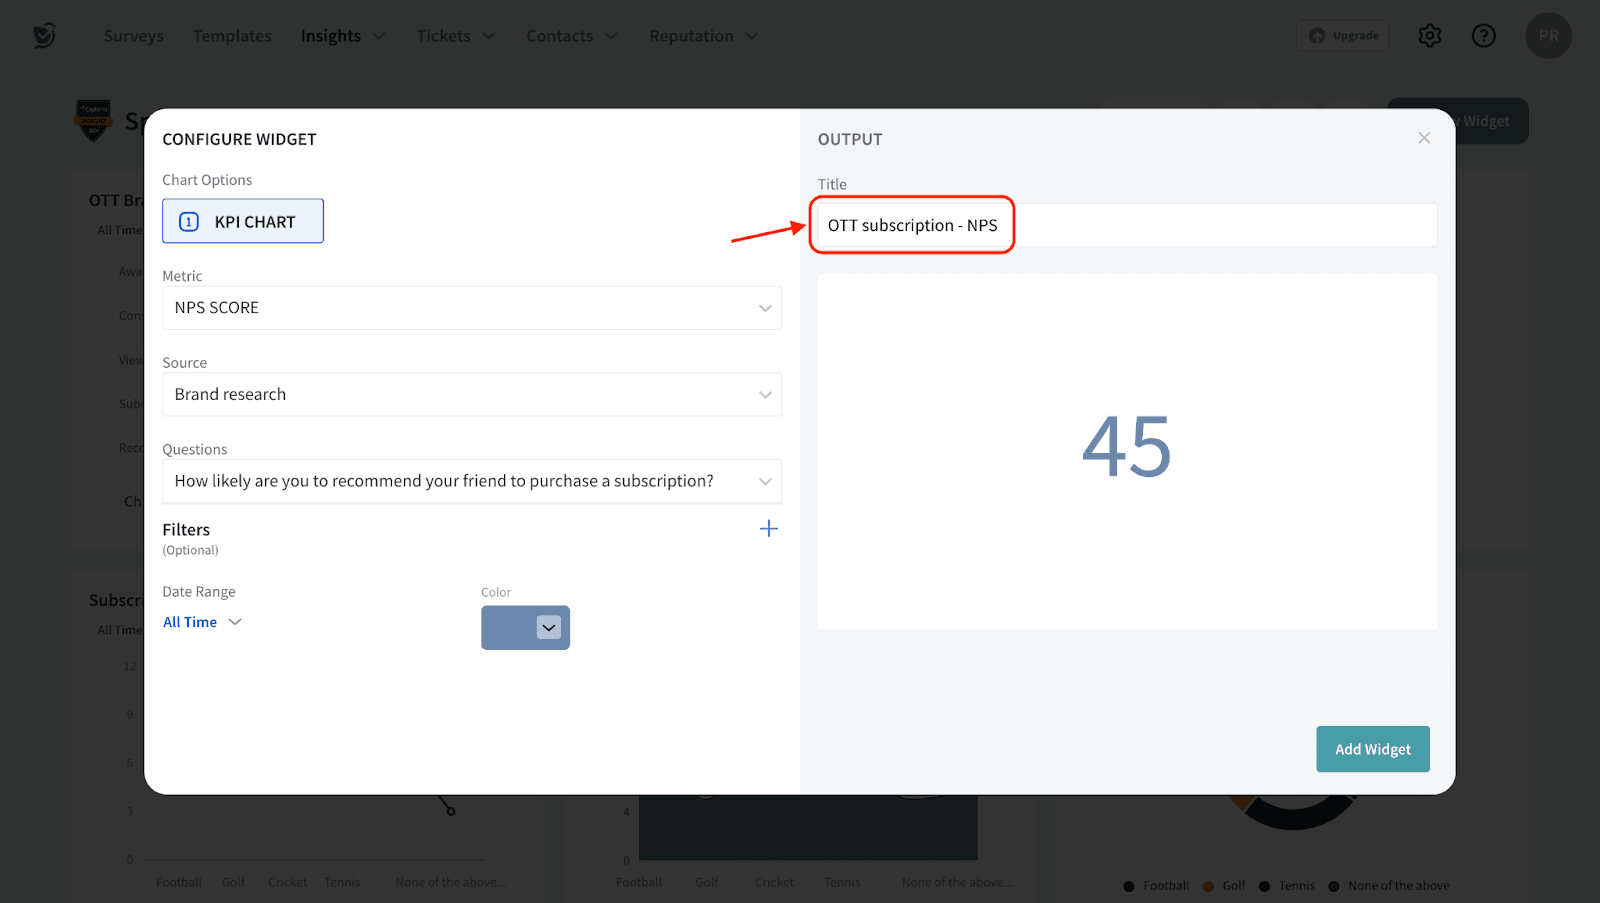
10. Click Add Widget.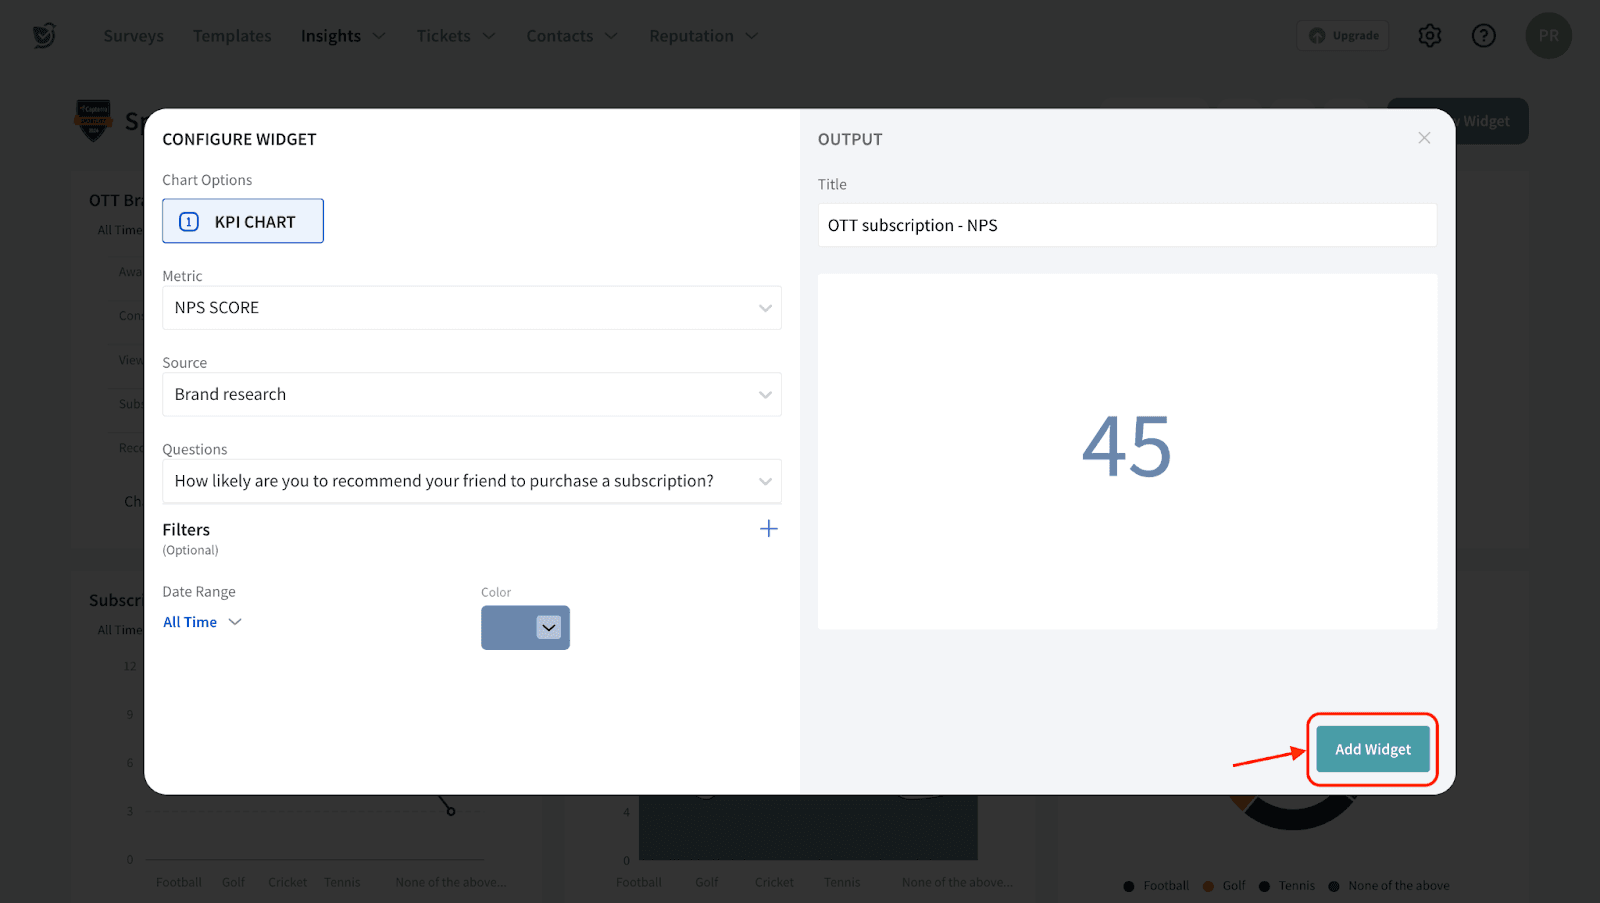
Move and resize the widget according to your preference. 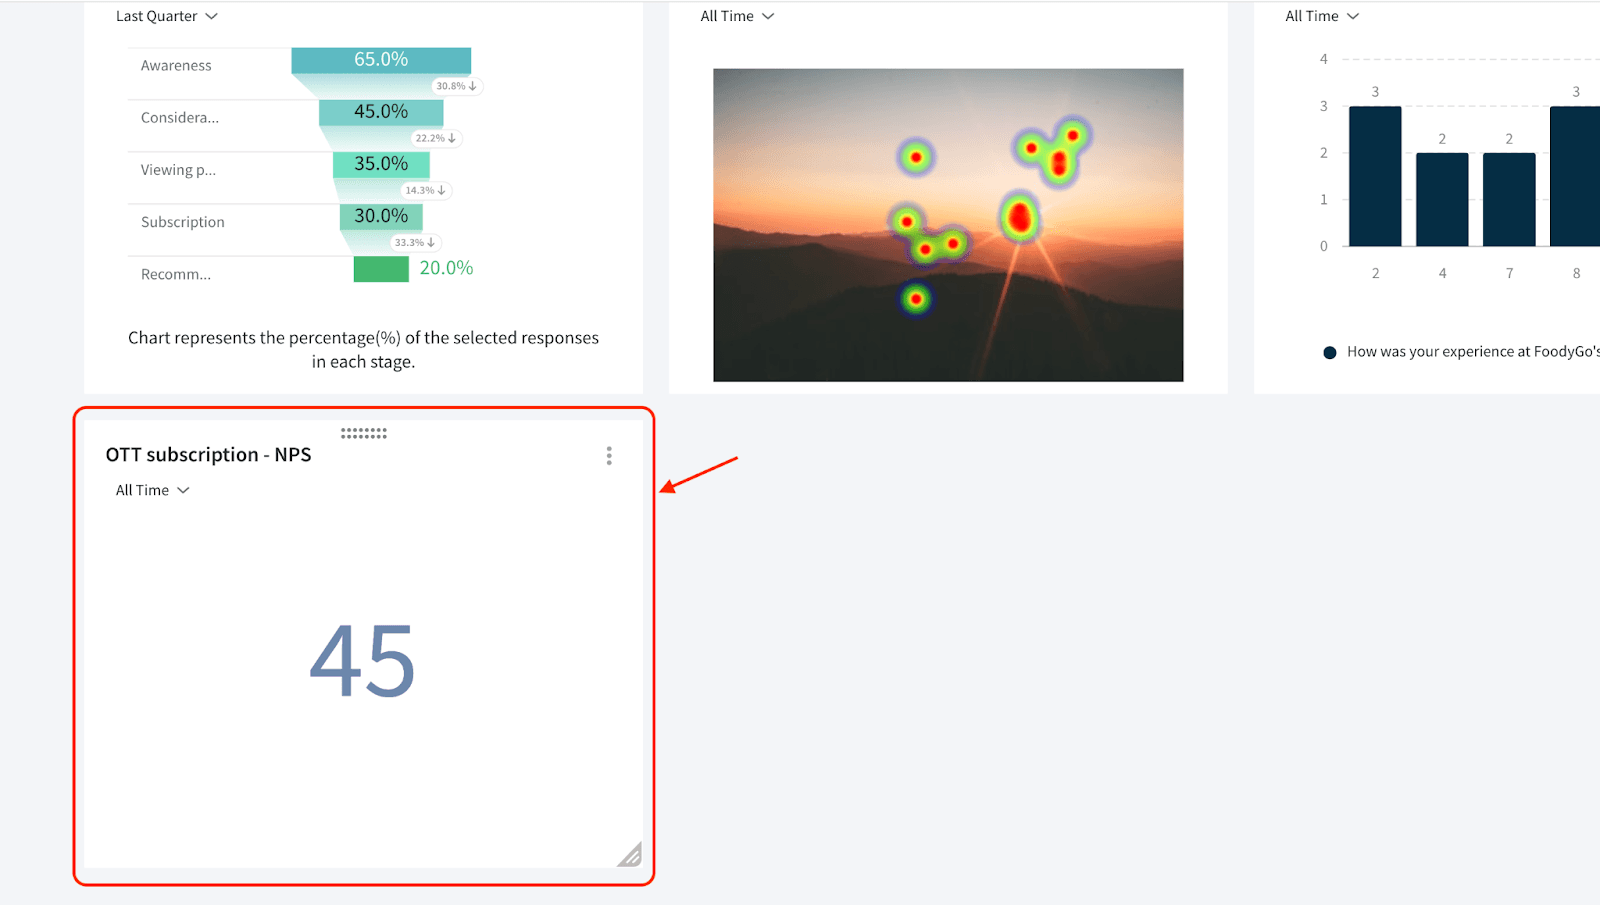
You can now track your KPI metrics within the dashboard! Feel free to reach out to our community if you have any questions.
Powered By SparrowDesk